Grundlæggende statistik
| Institutionelle ejere | 77 total, 75 long only, 0 short only, 2 long/short - change of 1,32% MRQ |
| Gennemsnitlig porteføljeallokering | 0.0388 % - change of 36,97% MRQ |
| Institutionelle aktier (lange) | 360.018 (ex 13D/G) - change of 0,01MM shares 2,78% MRQ |
| Institutionel værdi (lang) | $ 33.257 USD ($1000) |
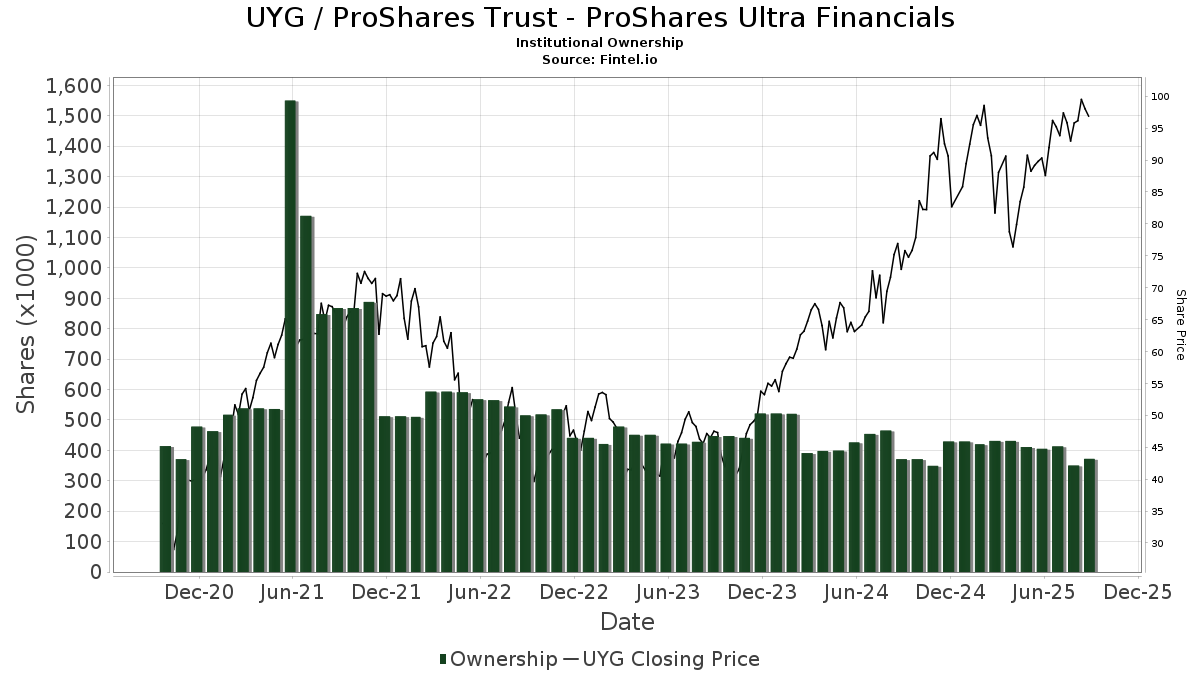
Institutionelt ejerskab og aktionærer
ProShares Trust - ProShares Ultra Financials (US:UYG) har 77 institutionelle ejere og aktionærer, der har indsendt 13D/G- eller 13F-formularer til Securities Exchange Commission (SEC). Disse institutioner har i alt 360,018 aktier. Største aktionærer omfatter Cassaday & Co Wealth Management LLC, Toth Financial Advisory Corp, WealthCare Asset Management, LLC, Colony Group, LLC, Citadel Advisors Llc, Synovus Financial Corp, Pinnacle Financial Partners, Inc., Citadel Advisors Llc, Warren Averett Asset Management, LLC, and Susquehanna International Group, Llp .
ProShares Trust - ProShares Ultra Financials (ARCA:UYG) institutionel ejerskabsstruktur viser aktuelle positioner i virksomheden efter institutioner og fonde, samt seneste ændringer i positionsstørrelse. Større aktionærer kan omfatte individuelle investorer, investeringsforeninger, hedgefonde eller institutioner. Skema 13D angiver, at investoren besidder (eller besidder) mere end 5 % af virksomheden og har til hensigt (eller har til hensigt at) aktivt at forfølge en ændring i forretningsstrategi. Skema 13G indikerer en passiv investering på over 5%.
The share price as of March 24, 2026 is 73,42 / share. Previously, on March 25, 2025, the share price was 91,79 / share. This represents a decline of 20,01% over that period.
Fondens stemningsscore
Fund Sentiment Score (fka Ownership Accumulation Score) finder de aktier, der bliver mest købt af fonde. Det er resultatet af en sofistikeret, multi-faktor kvantitativ model, der identificerer virksomheder med de højeste niveauer af institutionel akkumulering. Scoringsmodellen bruger en kombination af den samlede stigning i oplyste ejere, ændringerne i porteføljeallokeringer i disse ejere og andre målinger. Tallet går fra 0 til 100, hvor højere tal indikerer et højere niveau af akkumulering for sine jævnaldrende, og 50 er gennemsnittet.
Opdateringsfrekvens: Dagligt
Se Ownership Explorer, som giver en liste over højest rangerende virksomheder.
AI+ Ask Fintel’s AI assistant about ProShares Trust - ProShares Ultra Financials.
Select a question to share a public post with an AI-crafted answer.
Thinking of good questions…
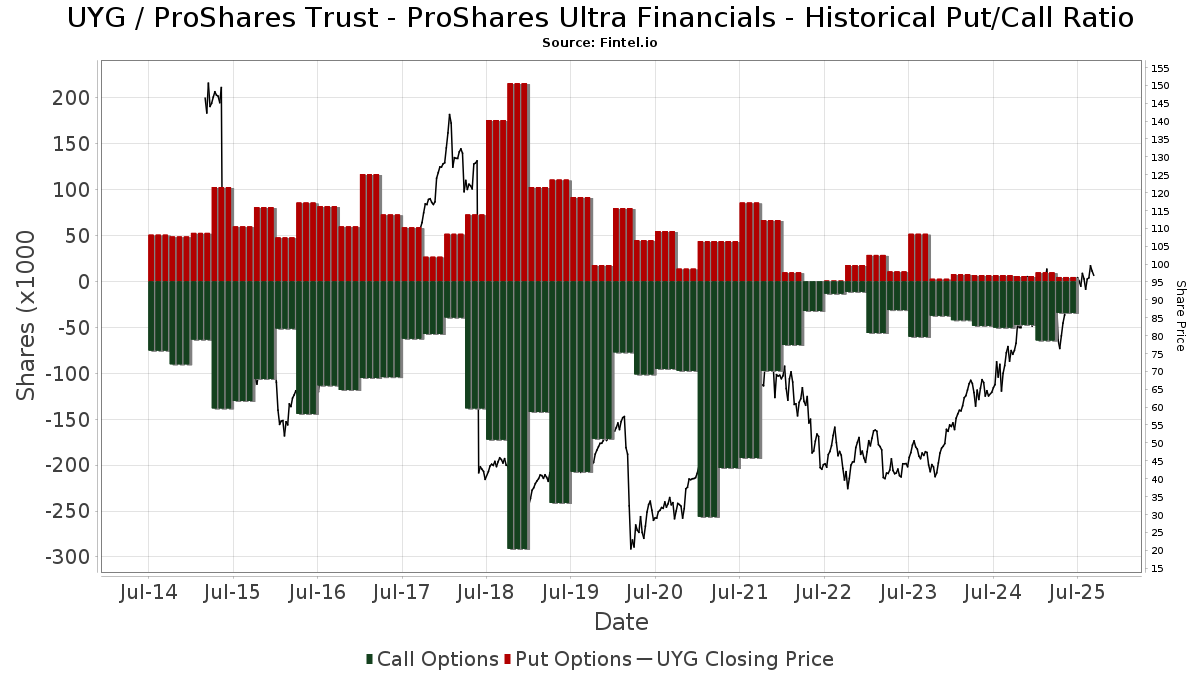
Institutionel Put/Call-forhold
Ud over at indberette standardaktie- og gældsudstedelser skal institutter med mere end 100 mill. aktiver under forvaltning også oplyse deres put- og call-optionsbeholdninger. Da salgsoptioner generelt indikerer negativ stemning, og købsoptioner indikerer positiv stemning, kan vi få en fornemmelse af den overordnede institutionelle stemning ved at plotte forholdet mellem put og kald. Diagrammet til højre viser det historiske put/call-forhold for dette instrument.
Brug af Put/Call Ratio som en indikator for investorernes stemning overvinder en af de vigtigste mangler ved at bruge totalt institutionelt ejerskab, som er, at en betydelig mængde af aktiver under forvaltning investeres passivt for at spore indekser. Passivt forvaltede fonde køber typisk ikke optioner, så indikatoren for put/call-forholdet følger mere nøje følelsen af aktivt forvaltede fonde.
13F og NPORT arkivering
Detaljer om 13F-arkivering er gratis. Detaljer om NP-ansøgninger kræver et premium-medlemskab. Grønne rækker angiver nye positioner. Røde rækker angiver lukkede positioner. Klik på linket ikon for at se den fulde transaktionshistorik.
Opgrader
for at låse premium-data op og eksportere til Excel ![]() .
.
| Fil dato | Kilde | Investor | Type | Gennemsnitlig pris (Øst) |
Aktier | Δ Aktier (%) |
Rapporteret Værdi ($1000) |
Δ Værdi (%) |
Port Alloc (%) |
|
|---|---|---|---|---|---|---|---|---|---|---|
| 2026-02-10 | 13F | Savant Capital, LLC | 3.773 | 0,00 | 346 | -7,49 | ||||
| 2026-02-17 | 13F | Royal Bank Of Canada | 0 | -100,00 | 0 | |||||
| 2026-01-21 | 13F | Hartford Financial Management Inc. | 420 | 0,00 | 39 | -7,32 | ||||
| 2026-01-26 | 13F | Lowery Thomas, Llc | 2.687 | 9,05 | 247 | 0,82 | ||||
| 2026-02-11 | 13F | Cerity Partners LLC | 5.000 | 0,00 | 459 | -7,66 | ||||
| 2026-01-07 | 13F | Parisi Gray Wealth Management | 2.462 | 8,75 | 226 | 0,45 | ||||
| 2026-01-29 | 13F | Sanctuary Advisors, LLC | 3.025 | -0,40 | 278 | -7,97 | ||||
| 2026-02-12 | 13F | Jane Street Group, Llc | 3.534 | -75,21 | 324 | -77,09 | ||||
| 2026-02-12 | 13F | Bank Of Montreal /can/ | 3.579 | -45,60 | 328 | -49,69 | ||||
| 2026-01-30 | 13F | Us Bancorp \de\ | 300 | 0,00 | 28 | -6,90 | ||||
| 2026-02-12 | 13F | Jane Street Group, Llc | Call | 2.800 | 257 | |||||
| 2026-02-17 | 13F | Dimension Capital Management Llc | 5.000 | 459 | ||||||
| 2025-12-02 | 13F | Allworth Financial LP | 0 | -100,00 | 0 | -100,00 | ||||
| 2026-02-11 | 13F | MCF Advisors LLC | 300 | 0,00 | 28 | -6,90 | ||||
| 2026-02-17 | 13F | Creative Planning | 4.123 | -4,03 | 378 | -11,27 | ||||
| 2026-01-20 | 13F | Toth Financial Advisory Corp | 29.854 | -14,51 | 2.740 | -20,92 | ||||
| 2026-02-10 | 13F | Goldman Sachs Group Inc | 2.538 | 0,00 | 233 | -7,57 | ||||
| 2026-02-12 | 13F | CIBC Private Wealth Group, LLC | 7.155 | 0,21 | 657 | -7,34 | ||||
| 2026-01-08 | 13F | Regent Peak Wealth Advisors LLC | 2.256 | 0,00 | 207 | -7,17 | ||||
| 2026-02-11 | 13F | Jpmorgan Chase & Co | 250 | 0,00 | 23 | -8,33 | ||||
| 2026-02-17 | 13F | Coastal Bridge Advisors, LLC | 5.484 | 0,00 | 503 | -7,54 | ||||
| 2026-02-13 | 13F | Colony Group, LLC | 24.179 | 71,29 | 2.302 | 64,31 | ||||
| 2026-02-20 | 13F | Kovitz Investment Group Partners, LLC | 0 | -100,00 | 0 | |||||
| 2025-11-14 | 13F | Wolverine Trading, Llc | Call | 4.200 | 420 | |||||
| 2026-01-28 | 13F | Chicago Partners Investment Group LLC | 9.811 | 10,66 | 839 | -0,71 | ||||
| 2026-01-23 | 13F | Farther Finance Advisors, LLC | 750 | 0,00 | 69 | -8,11 | ||||
| 2026-01-23 | 13F | Steigerwald, Gordon & Koch Inc. | 300 | 0,00 | 28 | -6,90 | ||||
| 2026-02-27 | 13F | Strategic Investment Solutions, Inc. /IL | 1.200 | 0,00 | 110 | -7,56 | ||||
| 2026-02-10 | 13F | Lido Advisors, LLC | 3.534 | 0,00 | 351 | 0,00 | ||||
| 2026-02-17 | 13F | WealthCare Asset Management, LLC | 28.089 | 2.740 | ||||||
| 2026-02-06 | 13F | HighTower Advisors, LLC | 3.060 | -62,48 | 281 | -65,39 | ||||
| 2026-02-17 | 13F | Tower Research Capital LLC (TRC) | 0 | -100,00 | 0 | |||||
| 2026-01-14 | 13F | Spire Wealth Management | 805 | -10,36 | 74 | -17,98 | ||||
| 2026-01-26 | 13F | United Advisor Group, LLC | 3.134 | 4,29 | 288 | -3,69 | ||||
| 2026-02-13 | 13F | Morgan Stanley | 3 | 200,00 | 0 | |||||
| 2026-02-17 | 13F | Glenmede Trust Co Na | 2.463 | 0,00 | 226 | 3,20 | ||||
| 2026-01-15 | 13F | Sollinda Capital Management LLC | 2.454 | -14,79 | 225 | -21,05 | ||||
| 2026-02-10 | 13F | Hazlett, Burt & Watson, Inc. | 67 | 11,67 | 0 | |||||
| 2026-02-13 | 13F | Kestra Advisory Services, LLC | 0 | -100,00 | 0 | |||||
| 2026-02-17 | 13F | Citadel Advisors Llc | 0 | -100,00 | 0 | |||||
| 2026-02-17 | 13F | Blair William & Co/il | 6.140 | 0,00 | 564 | -7,55 | ||||
| 2026-02-13 | 13F | SRS Capital Advisors, Inc. | 2.091 | 192 | ||||||
| 2026-01-23 | 13F | James J. Burns & Company, LLC | 2.857 | 0,00 | 262 | -7,42 | ||||
| 2026-01-07 | 13F | Harbor Investment Advisory, Llc | 2.100 | 0,00 | 193 | -7,69 | ||||
| 2026-02-17 | 13F | Citadel Advisors Llc | Put | 19.400 | 781,82 | 1.781 | 716,51 | |||
| 2026-01-21 | 13F | Flagship Harbor Advisors, Llc | 1.047 | 96 | ||||||
| 2026-01-29 | 13F | UBS Group AG | 285 | 26 | ||||||
| 2026-02-17 | 13F | Citadel Advisors Llc | Call | 13.100 | -3,68 | 1.202 | -10,90 | |||
| 2025-11-13 | 13F | Glenmede Investment Management, LP | 2.463 | 0,00 | 244 | 3,83 | ||||
| 2026-01-26 | 13F | Main Street Group, LTD | 0 | -100,00 | 0 | |||||
| 2026-02-06 | 13F | Pnc Financial Services Group, Inc. | 1.500 | 0,00 | 138 | -7,43 | ||||
| 2026-02-12 | 13F | Great Valley Advisor Group, Inc. | 2.718 | -1,52 | 249 | -9,12 | ||||
| 2026-02-02 | 13F | Truist Financial Corp | 7.314 | 103,17 | 671 | 87,96 | ||||
| 2025-11-07 | 13F | Synovus Financial Corp | 15.000 | 0,00 | 1.489 | 3,84 | ||||
| 2026-02-17 | 13F | Advisor Group Holdings, Inc. | 6.671 | -9,25 | 612 | -16,16 | ||||
| 2026-02-18 | 13F | GWM Advisors LLC | 1.133 | 0,00 | 104 | -8,04 | ||||
| 2026-02-19 | 13F | CI Private Wealth, LLC | 0 | -100,00 | 0 | |||||
| 2026-02-06 | 13F | Global Retirement Partners, LLC | 720 | 0,00 | 66 | -7,04 | ||||
| 2026-02-17 | 13F | Bank Of America Corp /de/ | 5.820 | 0,00 | 534 | -7,45 | ||||
| 2026-02-10 | 13F | Envestnet Asset Management Inc | 5.259 | 8,75 | 483 | 0,63 | ||||
| 2026-02-13 | 13F | Wells Fargo & Company/mn | 71 | 7.000,00 | 7 | |||||
| 2026-02-03 | 13F | Cassaday & Co Wealth Management LLC | 34.801 | 0,00 | 3.194 | -7,53 | ||||
| 2026-02-11 | 13F | LPL Financial LLC | 4.221 | 33,58 | 387 | 23,64 | ||||
| 2026-02-17 | 13F | Pinnacle Financial Partners, Inc. | 15.000 | 1.377 | ||||||
| 2026-02-17 | 13F | Summit Trail Advisors, Llc | 7.242 | 0,00 | 665 | -7,52 | ||||
| 2025-11-12 | 13F | CIBC Bancorp USA Inc. | 7.140 | 709 | ||||||
| 2026-02-12 | 13F | Summit Financial, LLC | 2.424 | 3,50 | 222 | -4,31 | ||||
| 2026-02-13 | 13F | Barclays Plc | 0 | -100,00 | 0 | |||||
| 2026-02-17 | 13F | Quantinno Capital Management LP | 3.125 | 38,52 | 287 | 28,25 | ||||
| 2026-02-04 | 13F | Wsfs Capital Management, Llc | 4.940 | 4,20 | 453 | -3,62 | ||||
| 2026-02-12 | 13F | Colonial Trust Advisors | 200 | 0,00 | 18 | -5,26 | ||||
| 2026-02-05 | 13F | Northwestern Mutual Wealth Management Co | 15 | -98,18 | 0 | -100,00 | ||||
| 2026-02-11 | 13F | Simplex Trading, Llc | 1.933 | 177 | ||||||
| 2026-02-06 | 13F | Copia Wealth Management | 0 | -100,00 | 0 | |||||
| 2026-01-23 | 13F | Capital Investment Counsel, Inc | 8.855 | -5,34 | 813 | -12,50 | ||||
| 2026-02-12 | 13F | Wealthspire Advisors, LLC | 3.992 | 399.100,00 | 366 | |||||
| 2026-01-29 | 13F/A | Lazari Capital Management, Inc. | 3.510 | 0,00 | 322 | -7,47 | ||||
| 2026-02-05 | 13F | Plante Moran Financial Advisors, LLC | 372 | 0,00 | 34 | -5,56 | ||||
| 2026-02-12 | 13F | Beacon Capital Management, Inc. | 44 | 0,00 | 4 | 0,00 | ||||
| 2026-01-26 | 13F | Cwm, Llc | 1.380 | 0,00 | 0 | |||||
| 2026-02-06 | 13F | Kennedy Investment Group | 4.100 | 0,00 | 376 | -7,39 | ||||
| 2026-02-09 | 13F | Texas Capital Bank Wealth Management Services Inc | 3.829 | 351 | ||||||
| 2026-02-17 | 13F | Risk Paradigm Group, LLC | 0 | -100,00 | 0 | |||||
| 2026-02-13 | 13F | MAI Capital Management | 2.050 | 94,31 | 188 | 80,77 | ||||
| 2026-02-17 | 13F | Private Advisor Group, LLC | 3.000 | 0,00 | 275 | -7,41 | ||||
| 2025-11-14 | 13F | Northern Trust Corp | 0 | -100,00 | 0 | -100,00 | ||||
| 2026-02-17 | 13F | National Asset Management, Inc. | 2.351 | 4,16 | 216 | -4,02 | ||||
| 2026-02-17 | 13F | Susquehanna International Group, Llp | Put | 2.200 | 202 | |||||
| 2026-02-05 | 13F | Sculati Wealth Management, LLC | 0 | -100,00 | 0 | |||||
| 2026-02-17 | 13F | Susquehanna International Group, Llp | Call | 5.900 | -78,62 | 542 | -80,25 | |||
| 2026-02-17 | 13F | Susquehanna International Group, Llp | 10.232 | 74,61 | 939 | 61,62 | ||||
| 2026-01-28 | 13F | Geneos Wealth Management Inc. | 114 | 10,68 | 10 | 0,00 | ||||
| 2026-02-17 | 13F | Warren Averett Asset Management, LLC | 10.250 | 0,00 | 941 | -7,57 | ||||
| 2026-01-23 | 13F | Valley National Advisers Inc | 120 | 0 |