Grundlæggende statistik
| Institutionelle ejere | 100 total, 100 long only, 0 short only, 0 long/short - change of -4,76% MRQ |
| Gennemsnitlig porteføljeallokering | 0.2897 % - change of 8,68% MRQ |
| Institutionelle aktier (lange) | 7.030.070 (ex 13D/G) - change of -0,32MM shares -4,34% MRQ |
| Institutionel værdi (lang) | $ 1.529.628 USD ($1000) |
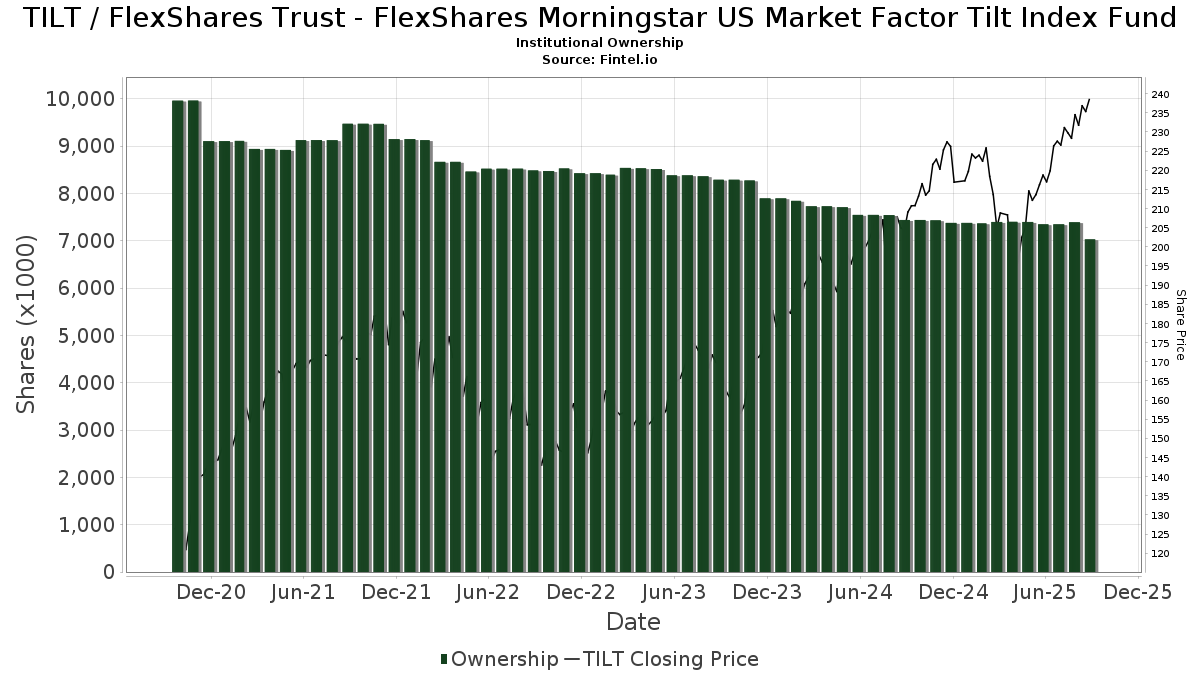
Institutionelt ejerskab og aktionærer
FlexShares Trust - FlexShares Morningstar US Market Factor Tilt Index Fund (US:TILT) har 100 institutionelle ejere og aktionærer, der har indsendt 13D/G- eller 13F-formularer til Securities Exchange Commission (SEC). Disse institutioner har i alt 7,030,070 aktier. Største aktionærer omfatter Northern Trust Corp, Capstone Financial Advisors, Inc., Morgan Stanley, Commonwealth Equity Services, Llc, Envestnet Asset Management Inc, RVW Wealth, LLC, Sageworth Trust Co, SageView Advisory Group, LLC, BBALX - Northern Global Tactical Asset Allocation Fund, and Mml Investors Services, Llc .
FlexShares Trust - FlexShares Morningstar US Market Factor Tilt Index Fund (BATS:TILT) institutionel ejerskabsstruktur viser aktuelle positioner i virksomheden efter institutioner og fonde, samt seneste ændringer i positionsstørrelse. Større aktionærer kan omfatte individuelle investorer, investeringsforeninger, hedgefonde eller institutioner. Skema 13D angiver, at investoren besidder (eller besidder) mere end 5 % af virksomheden og har til hensigt (eller har til hensigt at) aktivt at forfølge en ændring i forretningsstrategi. Skema 13G indikerer en passiv investering på over 5%.
The share price as of September 8, 2025 is 238,06 / share. Previously, on September 9, 2024, the share price was 202,33 / share. This represents an increase of 17,66% over that period.
Fondens stemningsscore
Fund Sentiment Score (fka Ownership Accumulation Score) finder de aktier, der bliver mest købt af fonde. Det er resultatet af en sofistikeret, multi-faktor kvantitativ model, der identificerer virksomheder med de højeste niveauer af institutionel akkumulering. Scoringsmodellen bruger en kombination af den samlede stigning i oplyste ejere, ændringerne i porteføljeallokeringer i disse ejere og andre målinger. Tallet går fra 0 til 100, hvor højere tal indikerer et højere niveau af akkumulering for sine jævnaldrende, og 50 er gennemsnittet.
Opdateringsfrekvens: Dagligt
Se Ownership Explorer, som giver en liste over højest rangerende virksomheder.
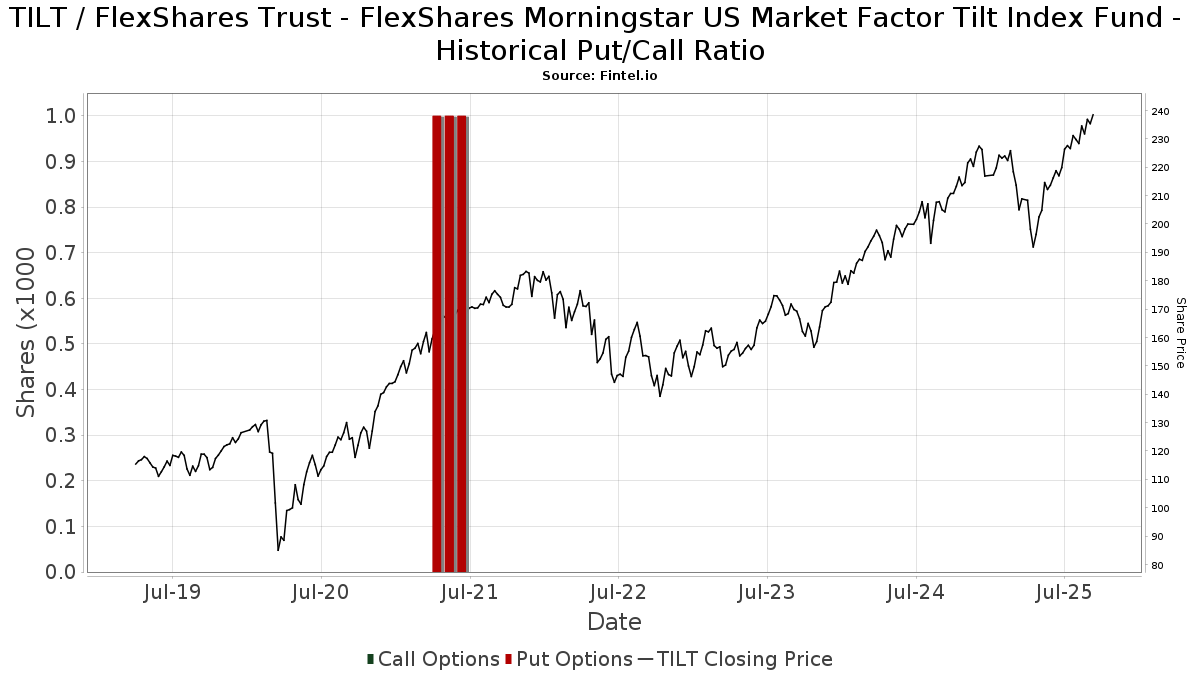
Institutionel Put/Call-forhold
Ud over at indberette standardaktie- og gældsudstedelser skal institutter med mere end 100 mill. aktiver under forvaltning også oplyse deres put- og call-optionsbeholdninger. Da salgsoptioner generelt indikerer negativ stemning, og købsoptioner indikerer positiv stemning, kan vi få en fornemmelse af den overordnede institutionelle stemning ved at plotte forholdet mellem put og kald. Diagrammet til højre viser det historiske put/call-forhold for dette instrument.
Brug af Put/Call Ratio som en indikator for investorernes stemning overvinder en af de vigtigste mangler ved at bruge totalt institutionelt ejerskab, som er, at en betydelig mængde af aktiver under forvaltning investeres passivt for at spore indekser. Passivt forvaltede fonde køber typisk ikke optioner, så indikatoren for put/call-forholdet følger mere nøje følelsen af aktivt forvaltede fonde.
13F og NPORT arkivering
Detaljer om 13F-arkivering er gratis. Detaljer om NP-ansøgninger kræver et premium-medlemskab. Grønne rækker angiver nye positioner. Røde rækker angiver lukkede positioner. Klik på linket ikon for at se den fulde transaktionshistorik.
Opgrader
for at låse premium-data op og eksportere til Excel ![]() .
.
| Fil dato | Kilde | Investor | Type | Gennemsnitlig pris (Øst) |
Aktier | Δ Aktier (%) |
Rapporteret Værdi ($1000) |
Δ Værdi (%) |
Port Alloc (%) |
|
|---|---|---|---|---|---|---|---|---|---|---|
| 2025-08-01 | 13F | Envestnet Asset Management Inc | 121.000 | -4,37 | 27.105 | 4,13 | ||||
| 2025-08-13 | 13F | F/M Investments LLC | 3.947 | -29,01 | 884 | -22,66 | ||||
| 2025-07-17 | 13F | Sound Income Strategies, LLC | 3 | 0,00 | 1 | |||||
| 2025-07-10 | 13F | Wealth Enhancement Advisory Services, Llc | 5.929 | -5,57 | 1.352 | 4,65 | ||||
| 2025-08-08 | 13F | Capstone Financial Advisors, Inc. | 189.300 | 25,00 | 42.405 | 36,10 | ||||
| 2025-07-07 | 13F | Greenfield Savings Bank | 5.500 | 0,00 | 1.232 | 8,93 | ||||
| 2025-08-12 | 13F | Choate Investment Advisors | 1.140 | 0,00 | 255 | 8,97 | ||||
| 2025-08-13 | 13F | Northwestern Mutual Wealth Management Co | 6.053 | -11,93 | 1.356 | -4,17 | ||||
| 2025-07-01 | 13F | Park National Corp /oh/ | 2.944 | -10,00 | 659 | -1,93 | ||||
| 2025-07-25 | 13F | Orca Investment Management, LLC | 1.561 | -10,03 | 350 | -1,97 | ||||
| 2025-08-12 | 13F | CIBC Private Wealth Group, LLC | 1.800 | 0,00 | 403 | 23,62 | ||||
| 2025-07-31 | 13F | Hanlon Investment Management, Inc. | 3.073 | -16,20 | 688 | -8,75 | ||||
| 2025-08-12 | 13F | Bokf, Na | 2.813 | 18,49 | 630 | 29,10 | ||||
| 2025-09-03 | 13F | Ballentine Capital Advisors, Inc | 13.039 | -3,76 | 2.921 | 4,77 | ||||
| 2025-07-22 | 13F | Awm Capital, Llc | 1.946 | 0,00 | 436 | 8,75 | ||||
| 2025-08-14 | 13F | Trace Wealth Advisors, LLC | 24.508 | 0,00 | 5.490 | 8,89 | ||||
| 2025-07-23 | 13F | Trifecta Capital Advisors, LLC | 713 | -13,37 | 160 | -5,92 | ||||
| 2025-08-13 | 13F | Baird Financial Group, Inc. | 1.480 | 0,00 | 332 | 8,88 | ||||
| 2025-08-15 | 13F | Morgan Stanley | 181.205 | 7,30 | 40.592 | 16,84 | ||||
| 2025-07-03 | 13F | Garde Capital, Inc. | 739 | 0,00 | 166 | 8,55 | ||||
| 2025-08-07 | 13F | Allworth Financial LP | 2.596 | -15,00 | 582 | -4,75 | ||||
| 2025-08-11 | 13F | Advisor Resource Council | 0 | -100,00 | 0 | -100,00 | ||||
| 2025-08-11 | 13F | Wealthspire Advisors, LLC | 6.592 | 0,00 | 1.477 | 8,85 | ||||
| 2025-08-14 | 13F | Jane Street Group, Llc | 6.629 | 58,47 | 1.485 | 72,56 | ||||
| 2025-07-07 | 13F | Discipline Wealth Solutions, LLC | 8.071 | 356,50 | 1.808 | 398,07 | ||||
| 2025-07-30 | 13F | Strategic Blueprint, LLC | 0 | -100,00 | 0 | |||||
| 2025-08-05 | 13F | Bank Of Montreal /can/ | 1.952 | -5,75 | 437 | 2,58 | ||||
| 2025-07-28 | 13F | Harbour Investments, Inc. | 170 | 11,11 | 38 | 22,58 | ||||
| 2025-07-25 | 13F | Wealth Architects, LLC | 1.686 | 0,00 | 378 | 8,96 | ||||
| 2025-08-15 | 13F | CI Private Wealth, LLC | 18.816 | 0,00 | 4.215 | 8,86 | ||||
| 2025-08-15 | 13F | Kestra Advisory Services, LLC | 5.820 | -9,09 | 1.304 | -1,06 | ||||
| 2025-08-14 | 13F | Comerica Bank | 7.079 | 0,00 | 1.586 | 8,86 | ||||
| 2025-08-13 | 13F | SageView Advisory Group, LLC | 66.346 | -18,66 | 15.340 | -8,59 | ||||
| 2025-08-14 | 13F | Ameriprise Financial Inc | 1.026 | 230 | ||||||
| 2025-08-13 | 13F | M&t Bank Corp | 1.198 | -7,20 | 268 | 1,13 | ||||
| 2025-07-28 | 13F | BRYN MAWR TRUST Co | 121 | 0,00 | 27 | 12,50 | ||||
| 2025-08-04 | 13F | AMG National Trust Bank | 10.699 | 0,00 | 2.397 | 8,86 | ||||
| 2025-07-29 | 13F | Wealthstream Advisors, Inc. | 20.423 | 4,80 | 4.575 | 14,09 | ||||
| 2025-08-08 | 13F | Larson Financial Group LLC | 0 | -100,00 | 0 | |||||
| 2025-08-13 | 13F | Lido Advisors, LLC | 4.045 | 0,00 | 906 | 8,89 | ||||
| 2025-08-14 | 13F | Fmr Llc | 860 | -2,82 | 193 | 6,08 | ||||
| 2025-07-21 | 13F | Sageworth Trust Co | 70.542 | 2.708,20 | 15.802 | 2.962,40 | ||||
| 2025-08-12 | 13F | Proequities, Inc. | Put | 0 | 0 | |||||
| 2025-08-05 | 13F | Bank of New York Mellon Corp | 2.597 | 0,00 | 582 | 8,80 | ||||
| 2025-08-12 | 13F | Proequities, Inc. | Call | 0 | 0 | |||||
| 2025-08-12 | 13F | Proequities, Inc. | 0 | 0 | ||||||
| 2025-07-24 | 13F | Blair William & Co/il | 949 | 0,00 | 213 | 8,72 | ||||
| 2025-07-29 | 13F | Goldstein Advisors, LLC | 14.022 | -0,37 | 3.141 | 8,50 | ||||
| 2025-08-11 | 13F | Cornerstone Planning Group LLC | 152 | 0,00 | 35 | 17,24 | ||||
| 2025-07-15 | 13F | RVW Wealth, LLC | 72.460 | -0,52 | 16.232 | 8,31 | ||||
| 2025-08-15 | 13F | Tower Research Capital LLC (TRC) | 1.385 | -40,48 | 310 | -35,15 | ||||
| 2025-08-14 | 13F | Mml Investors Services, Llc | 33.023 | -0,46 | 7 | 16,67 | ||||
| 2025-09-04 | 13F/A | Advisor Group Holdings, Inc. | 3.672 | -8,61 | 823 | -0,48 | ||||
| 2025-07-28 | 13F | Bridges Investment Management Inc | 10.299 | -2,05 | 2.307 | 6,66 | ||||
| 2025-07-29 | 13F | Calamos Wealth Management LLC | 0 | -100,00 | 0 | |||||
| 2025-08-08 | 13F | L & S Advisors Inc | 1.059 | 0,00 | 237 | 9,22 | ||||
| 2025-08-14 | 13F | Royal Bank Of Canada | 13.396 | 12,06 | 3.002 | 22,08 | ||||
| 2025-04-25 | 13F | Colonial River Wealth Management, LLC | 0 | -100,00 | 0 | |||||
| 2025-08-06 | 13F | Golden State Wealth Management, LLC | 226 | 0,44 | 51 | 8,70 | ||||
| 2025-07-14 | 13F | U.S. Capital Wealth Advisors, LLC | 1.367 | 0,00 | 306 | 8,90 | ||||
| 2025-08-08 | 13F | Pnc Financial Services Group, Inc. | 732 | 0,00 | 164 | 8,67 | ||||
| 2025-07-31 | 13F | Curio Wealth, Llc | 335 | 33.400,00 | 75 | -11,76 | ||||
| 2025-07-31 | 13F | Cambridge Investment Research Advisors, Inc. | 19.732 | -0,05 | 4 | 0,00 | ||||
| 2025-07-07 | 13F | Versant Capital Management, Inc | 600 | 0,00 | 134 | 8,94 | ||||
| 2025-08-14 | 13F | Qube Research & Technologies Ltd | 201 | 0,00 | 45 | 9,76 | ||||
| 2025-08-05 | 13F | Plante Moran Financial Advisors, LLC | 3.538 | 0,00 | 793 | 8,94 | ||||
| 2025-07-23 | 13F | West Paces Advisors Inc. | 243 | 0,00 | 54 | 10,20 | ||||
| 2025-07-16 | 13F | ORG Partners LLC | 0 | -100,00 | 0 | |||||
| 2025-08-14 | 13F | Integrated Wealth Concepts LLC | 6.499 | 2,51 | 1.456 | 11,58 | ||||
| 2025-08-14 | 13F | Bank Of America Corp /de/ | 6.126 | -1,62 | 1.372 | 7,10 | ||||
| 2025-08-14 | 13F | UBS Group AG | 14.751 | -5,67 | 3.304 | 2,70 | ||||
| 2025-08-06 | 13F | North Capital, Inc. | 50 | 0,00 | 11 | 10,00 | ||||
| 2025-07-07 | 13F | Kings Path Partners LLC | 2.430 | -4,41 | 544 | 4,02 | ||||
| 2025-08-13 | 13F | Texas Capital Bank Wealth Management Services Inc | 4.885 | -4,50 | 1.094 | 3,99 | ||||
| 2025-08-14 | 13F | Mariner, LLC | 0 | -100,00 | 0 | -100,00 | ||||
| 2025-08-14 | 13F | Raymond James Financial Inc | 9.335 | -20,44 | 2.091 | -13,38 | ||||
| 2025-08-13 | 13F | Cerity Partners LLC | 1.400 | 0,00 | 314 | 8,68 | ||||
| 2025-07-11 | 13F | Essex Savings Bank | 2.045 | 0,00 | 458 | 9,05 | ||||
| 2025-08-13 | 13F | Empire Financial Management Company, LLC | 1.210 | 0,00 | 271 | 9,27 | ||||
| 2025-07-30 | 13F | Eqis Capital Management, Inc. | 3.162 | 5,05 | 708 | 14,38 | ||||
| 2025-08-05 | 13F | Tiaa Trust, National Association | 4.243 | 0,00 | 950 | 8,94 | ||||
| 2025-08-14 | 13F | Susquehanna International Group, Llp | 24.523 | 79,29 | 5.493 | 95,20 | ||||
| 2025-04-30 | 13F | Axxcess Wealth Management, Llc | 0 | -100,00 | 0 | |||||
| 2025-07-25 | 13F | Cwm, Llc | 200 | 0,00 | 0 | |||||
| 2025-08-13 | 13F | Russell Investments Group, Ltd. | 170 | 38 | ||||||
| 2025-08-14 | 13F | Citadel Advisors Llc | 29.606 | 6.632 | ||||||
| 2025-07-24 | 13F | Comprehensive Money Management Services LLC | 2.857 | 0,00 | 640 | 8,86 | ||||
| 2025-07-31 | 13F | Sentinel Trust Co Lba | 27.536 | -0,05 | 6 | 20,00 | ||||
| 2025-08-13 | 13F | Northern Trust Corp | 5.627.964 | -7,08 | 1.260.713 | 1,17 | ||||
| 2025-08-13 | 13F | Flow Traders U.s. Llc | 2.229 | -28,44 | 0 | |||||
| 2025-07-31 | 13F | CNB Bank | 644 | 0,00 | 144 | 9,09 | ||||
| 2025-08-06 | 13F | Commonwealth Equity Services, Llc | 121.177 | -0,56 | 27 | 8,00 | ||||
| 2025-08-12 | 13F | LPL Financial LLC | 32.637 | -3,56 | 7.311 | 5,00 | ||||
| 2025-07-31 | 13F | Buckingham Strategic Partners | 0 | -100,00 | 0 | |||||
| 2025-07-24 | 13F | IFP Advisors, Inc | 20 | 0,00 | 4 | 0,00 | ||||
| 2025-08-05 | 13F | GPS Wealth Strategies Group, LLC | 41 | 0,00 | 9 | 12,50 | ||||
| 2025-08-04 | 13F | Creative Financial Designs Inc /adv | 5 | 1 | ||||||
| 2025-08-04 | 13F | Keybank National Association/oh | 3.288 | 0,00 | 737 | 8,88 | ||||
| 2025-08-05 | 13F | Cherry Tree Wealth Management, LLC | 26 | 0,00 | 6 | 0,00 | ||||
| 2025-08-12 | 13F | Zacks Investment Management | 2.904 | 0,00 | 650 | 8,88 | ||||
| 2025-08-14 | 13F | CoreCap Advisors, LLC | 606 | -4,87 | 136 | 3,05 | ||||
| 2025-08-14 | 13F | Goldman Sachs Group Inc | 4.616 | 0,00 | 1.034 | 8,96 | ||||
| 2025-08-26 | NP | BBALX - Northern Global Tactical Asset Allocation Fund | 42.243 | -3,09 | 9.463 | 5,51 | ||||
| 2025-08-04 | 13F | Assetmark, Inc | 85 | 304,76 | 19 | 375,00 | ||||
| 2025-08-12 | 13F | Jpmorgan Chase & Co | 0 | -100,00 | 0 | -100,00 | ||||
| 2025-08-08 | 13F | Creative Planning | 1.662 | 0,00 | 372 | 9,09 | ||||
| 2025-08-14 | 13F | Wells Fargo & Company/mn | 12.900 | 2,69 | 2.890 | 11,80 | ||||
| 2025-08-07 | 13F | Efficient Advisors, LLC | 22.268 | -31,37 | 4.988 | -25,27 | ||||
| 2025-04-21 | 13F | PSI Advisors, LLC | 0 | -100,00 | 0 | -100,00 | ||||
| 2025-08-08 | 13F | Cetera Investment Advisers | 27.243 | 242,94 | 6.103 | 273,44 | ||||
| 2025-05-15 | 13F | Two Sigma Securities, Llc | 0 | -100,00 | 0 | |||||
| 2025-07-24 | 13F | Us Bancorp \de\ | 451 | 0,00 | 101 | 9,78 | ||||
| 2025-08-14 | 13F | Marquette Associates, Inc. | 95 | -16,67 | 21 | -8,70 | ||||
| 2025-07-25 | 13F | NorthRock Partners, LLC | 100 | 0,00 | 22 | 10,00 | ||||
| 2025-08-15 | 13F | Captrust Financial Advisors | 2.486 | -28,17 | 557 | -21,91 |