Grundlæggende statistik
| Institutionelle ejere | 101 total, 101 long only, 0 short only, 0 long/short - change of -0,98% MRQ |
| Gennemsnitlig porteføljeallokering | 0.2068 % - change of -11,06% MRQ |
| Institutionelle aktier (lange) | 8.505.112 (ex 13D/G) - change of -1,17MM shares -12,12% MRQ |
| Institutionel værdi (lang) | $ 283.916 USD ($1000) |
Institutionelt ejerskab og aktionærer
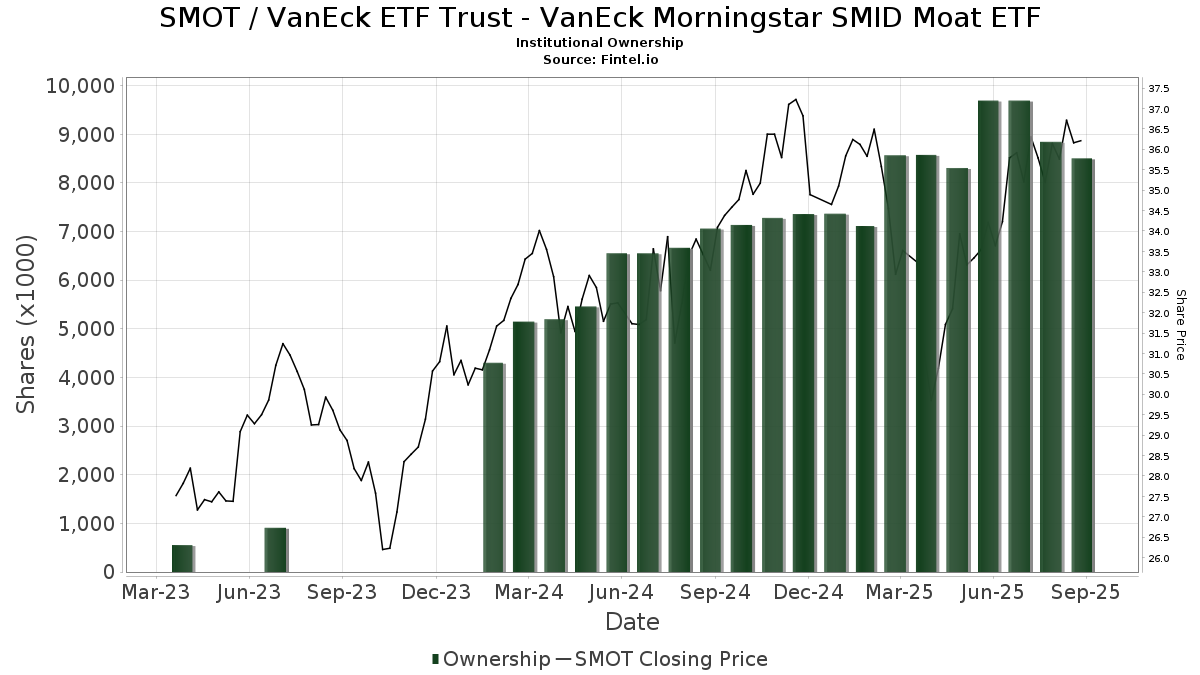
VanEck ETF Trust - VanEck Morningstar SMID Moat ETF (US:SMOT) har 101 institutionelle ejere og aktionærer, der har indsendt 13D/G- eller 13F-formularer til Securities Exchange Commission (SEC). Disse institutioner har i alt 8,505,112 aktier. Største aktionærer omfatter Gradient Investments LLC, LPL Financial LLC, Great Lakes Advisors, Llc, Bank Of America Corp /de/, Morgan Stanley, Financial Management Network Inc, Apexium Financial, Lp, Mesirow Financial Investment Management, Inc., Raymond James Financial Inc, and Woodmont Investment Counsel Llc .
VanEck ETF Trust - VanEck Morningstar SMID Moat ETF (BATS:SMOT) institutionel ejerskabsstruktur viser aktuelle positioner i virksomheden efter institutioner og fonde, samt seneste ændringer i positionsstørrelse. Større aktionærer kan omfatte individuelle investorer, investeringsforeninger, hedgefonde eller institutioner. Skema 13D angiver, at investoren besidder (eller besidder) mere end 5 % af virksomheden og har til hensigt (eller har til hensigt at) aktivt at forfølge en ændring i forretningsstrategi. Skema 13G indikerer en passiv investering på over 5%.
The share price as of September 8, 2025 is 36,56 / share. Previously, on September 9, 2024, the share price was 33,10 / share. This represents an increase of 10,45% over that period.
Fondens stemningsscore
Fund Sentiment Score (fka Ownership Accumulation Score) finder de aktier, der bliver mest købt af fonde. Det er resultatet af en sofistikeret, multi-faktor kvantitativ model, der identificerer virksomheder med de højeste niveauer af institutionel akkumulering. Scoringsmodellen bruger en kombination af den samlede stigning i oplyste ejere, ændringerne i porteføljeallokeringer i disse ejere og andre målinger. Tallet går fra 0 til 100, hvor højere tal indikerer et højere niveau af akkumulering for sine jævnaldrende, og 50 er gennemsnittet.
Opdateringsfrekvens: Dagligt
Se Ownership Explorer, som giver en liste over højest rangerende virksomheder.
Institutionel Put/Call-forhold
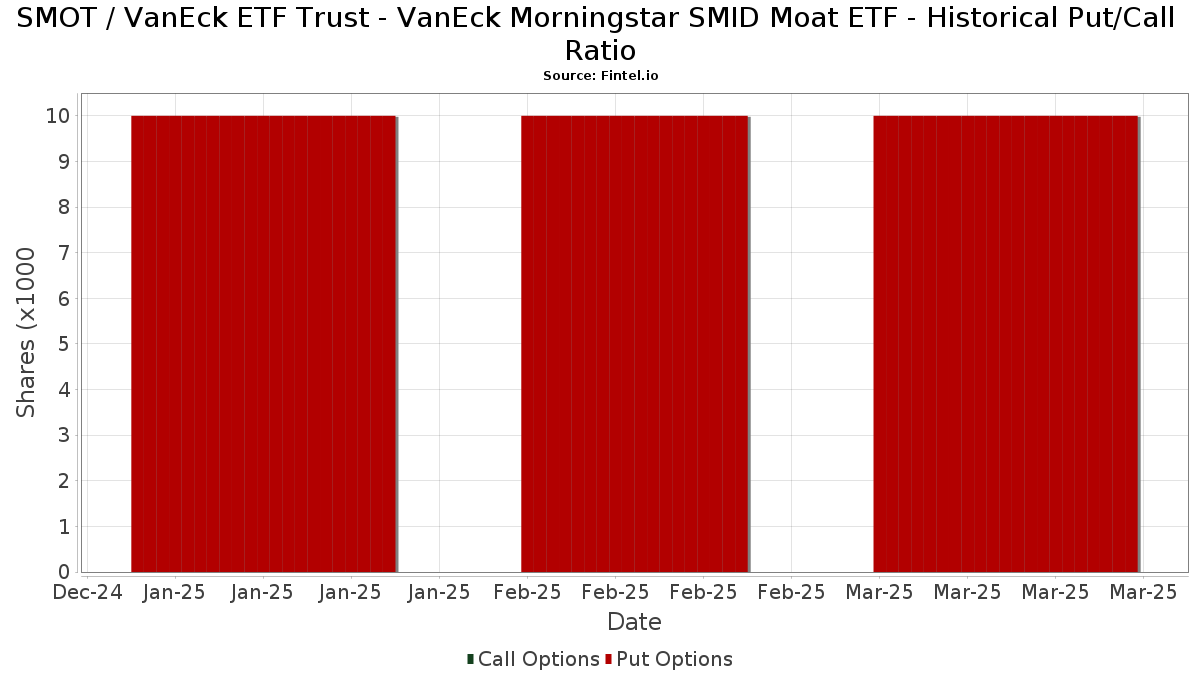
Ud over at indberette standardaktie- og gældsudstedelser skal institutter med mere end 100 mill. aktiver under forvaltning også oplyse deres put- og call-optionsbeholdninger. Da salgsoptioner generelt indikerer negativ stemning, og købsoptioner indikerer positiv stemning, kan vi få en fornemmelse af den overordnede institutionelle stemning ved at plotte forholdet mellem put og kald. Diagrammet til højre viser det historiske put/call-forhold for dette instrument.
Brug af Put/Call Ratio som en indikator for investorernes stemning overvinder en af de vigtigste mangler ved at bruge totalt institutionelt ejerskab, som er, at en betydelig mængde af aktiver under forvaltning investeres passivt for at spore indekser. Passivt forvaltede fonde køber typisk ikke optioner, så indikatoren for put/call-forholdet følger mere nøje følelsen af aktivt forvaltede fonde.
13F og NPORT arkivering
Detaljer om 13F-arkivering er gratis. Detaljer om NP-ansøgninger kræver et premium-medlemskab. Grønne rækker angiver nye positioner. Røde rækker angiver lukkede positioner. Klik på linket ikon for at se den fulde transaktionshistorik.
Opgrader
for at låse premium-data op og eksportere til Excel ![]() .
.
| Fil dato | Kilde | Investor | Type | Gennemsnitlig pris (Øst) |
Aktier | Δ Aktier (%) |
Rapporteret Værdi ($1000) |
Δ Værdi (%) |
Port Alloc (%) |
|
|---|---|---|---|---|---|---|---|---|---|---|
| 2025-05-12 | 13F | Simplex Trading, Llc | 0 | -100,00 | 0 | |||||
| 2025-08-14 | 13F | Fmr Llc | 0 | -100,00 | 0 | |||||
| 2025-04-30 | 13F | M&t Bank Corp | 0 | -100,00 | 0 | -100,00 | ||||
| 2025-08-06 | 13F | Financial Advisory Corp /ut/ /adv | 13.709 | 0,00 | 0 | |||||
| 2025-05-15 | 13F | Citadel Advisors Llc | 0 | -100,00 | 0 | |||||
| 2025-07-29 | 13F | Private Trust Co Na | 1.659 | -58,93 | 58 | -56,82 | ||||
| 2025-08-13 | 13F | Capital Analysts, Inc. | 9.614 | -0,03 | 0 | |||||
| 2025-08-12 | 13F | Proequities, Inc. | 0 | 0 | ||||||
| 2025-07-30 | 13F | Principle Wealth Partners Llc | 12.208 | -98,49 | 425 | -98,40 | ||||
| 2025-08-07 | 13F | Allworth Financial LP | 316 | 11 | ||||||
| 2025-08-08 | 13F | Capital Investment Advisory Services, LLC | 8.933 | -16,13 | 311 | -11,17 | ||||
| 2025-07-15 | 13F | Missouri Trust & Investment Co | 0 | -100,00 | 0 | |||||
| 2025-07-22 | 13F | Woodmont Investment Counsel Llc | 175.639 | 0,34 | 6.112 | 6,50 | ||||
| 2025-08-14 | 13F | Mariner, LLC | 13.727 | -4,29 | 478 | 1,49 | ||||
| 2025-07-11 | 13F | Global X Japan Co., Ltd. | 527 | 167,51 | 18 | 200,00 | ||||
| 2025-08-13 | 13F | Jones Financial Companies Lllp | 65.871 | 37,68 | 2.288 | 46,39 | ||||
| 2025-08-04 | 13F | Clear Investment Research, Llc | 652 | 13,19 | 23 | 22,22 | ||||
| 2025-07-22 | 13F | Comprehensive Financial Consultants Institutional, Inc. | 20.222 | -0,87 | 704 | 5,24 | ||||
| 2025-08-14 | 13F | Financial Advisory Service, Inc. | 633 | -0,16 | 22 | 10,00 | ||||
| 2025-08-14 | 13F | Mercer Global Advisors Inc /adv | 73.249 | -4,42 | 2.549 | 1,47 | ||||
| 2025-07-25 | 13F | Iron Financial, LLC | 18.601 | 2,13 | 647 | 8,38 | ||||
| 2025-08-07 | 13F | 1620 Investment Advisors, Inc. | 500 | 33,33 | 17 | 41,67 | ||||
| 2025-08-13 | 13F | EverSource Wealth Advisors, LLC | 0 | -100,00 | 0 | |||||
| 2025-08-15 | 13F | Morgan Stanley | 566.448 | -10,85 | 19.712 | -5,39 | ||||
| 2025-08-14 | 13F | UBS Group AG | 720 | 25 | ||||||
| 2025-07-29 | 13F | Stephens Inc /ar/ | 52.172 | 4,34 | 1.816 | 10,74 | ||||
| 2025-07-23 | 13F | First Financial Group Corp | 24.551 | 9,28 | 854 | 16,03 | ||||
| 2025-08-14 | 13F | Royal Bank Of Canada | 22.460 | 81,72 | 782 | 93,09 | ||||
| 2025-07-25 | 13F | Tranquility Partners, LLC | 13.629 | 1,71 | 474 | 7,97 | ||||
| 2025-08-06 | 13F | Stonebridge Financial Planning Group, LLC | 28.648 | -6,32 | 997 | -0,60 | ||||
| 2025-07-22 | 13F | Apexium Financial, Lp | 324.756 | -5,46 | 11.302 | 0,34 | ||||
| 2025-08-08 | 13F | Avantax Advisory Services, Inc. | 38.314 | 1.333 | ||||||
| 2025-08-08 | 13F | Cetera Investment Advisers | 87.341 | -2,08 | 3.039 | 3,93 | ||||
| 2025-08-13 | 13F | VestGen Advisors, LLC | 13.012 | -80,95 | 453 | -79,82 | ||||
| 2025-08-14 | 13F | Stifel Financial Corp | 49.435 | 0,79 | 1.720 | 6,97 | ||||
| 2025-08-15 | 13F | Tower Research Capital LLC (TRC) | 11.086 | 34,49 | 386 | 42,59 | ||||
| 2025-08-04 | 13F | Eubel Brady & Suttman Asset Management Inc | 77.200 | -0,74 | 3 | 0,00 | ||||
| 2025-09-04 | 13F/A | Advisor Group Holdings, Inc. | 77.691 | -14,53 | 2.704 | -9,30 | ||||
| 2025-08-14 | 13F | Raymond James Financial Inc | 177.833 | -32,98 | 6.189 | -28,87 | ||||
| 2025-08-12 | 13F | Soundwatch Capital LLC | 7.824 | 0,50 | 439 | 71,76 | ||||
| 2025-07-25 | 13F | Cwm, Llc | 215 | 0,00 | 0 | |||||
| 2025-07-29 | 13F | Mattson Financial Services, LLC | 39.836 | -4,37 | 1.386 | 1,54 | ||||
| 2025-08-12 | 13F | AlphaCore Capital LLC | 14.350 | 0,00 | 499 | 6,17 | ||||
| 2025-07-11 | 13F | Farther Finance Advisors, LLC | 153.785 | -32,23 | 5.352 | -28,25 | ||||
| 2025-08-12 | 13F | O'shaughnessy Asset Management, Llc | 0 | -100,00 | 0 | |||||
| 2025-08-11 | 13F | TRUE Private Wealth Advisors | 87.833 | -2,58 | 3.057 | 3,38 | ||||
| 2025-07-31 | 13F | Oppenheimer & Co Inc | 5.755 | 200 | ||||||
| 2025-08-13 | 13F | IAG Wealth Partners, LLC | 2.305 | 0,00 | 80 | 6,67 | ||||
| 2025-08-13 | 13F | Copley Financial Group, Inc. | 13.572 | -4,94 | 472 | 0,85 | ||||
| 2025-08-14 | 13F | IHT Wealth Management, LLC | 15.583 | -16,73 | 542 | -11,58 | ||||
| 2025-08-01 | 13F | Belvedere Trading LLC | Put | 0 | -100,00 | 0 | ||||
| 2025-08-12 | 13F | BlackRock, Inc. | 2.836 | 99 | ||||||
| 2025-08-14 | 13F | Bank Of America Corp /de/ | 609.663 | 18,68 | 21.216 | 25,96 | ||||
| 2025-08-14 | 13F | Ancora Advisors, LLC | 13.058 | 11,23 | 454 | 18,23 | ||||
| 2025-07-09 | 13F | Fermata Advisors, LLC | 8.570 | 298 | ||||||
| 2025-08-14 | 13F | GWM Advisors LLC | 10.193 | 355 | ||||||
| 2025-08-15 | 13F | Brown Financial Advisors | 73.269 | -1,76 | 2.550 | 4,25 | ||||
| 2025-04-22 | 13F | Whalen Wealth Management Inc. | 0 | -100,00 | 0 | |||||
| 2025-05-16 | 13F | Coordinated Financial Services, Inc./CO | 16.999 | 7,49 | 557 | 10,30 | ||||
| 2025-08-12 | 13F | Argent Trust Co | 23.750 | -4,04 | 826 | 1,85 | ||||
| 2025-08-06 | 13F | AE Wealth Management LLC | 156 | 200,00 | 5 | 400,00 | ||||
| 2025-08-12 | 13F | Jpmorgan Chase & Co | 80 | 3 | ||||||
| 2025-08-12 | 13F | Steward Partners Investment Advisory, Llc | 49.046 | -1,90 | 1.707 | 4,09 | ||||
| 2025-08-14 | 13F | First Foundation Advisors | 50.490 | -0,50 | 1.757 | 5,65 | ||||
| 2025-07-31 | 13F | Cambridge Investment Research Advisors, Inc. | 87.938 | 4,32 | 3 | 50,00 | ||||
| 2025-08-13 | 13F | Icapital Wealth Llc | 27.221 | -42,35 | 947 | -38,82 | ||||
| 2025-05-14 | 13F | Susquehanna International Group, Llp | 0 | -100,00 | 0 | |||||
| 2025-07-24 | 13F | Etesian Wealth Advisors, Inc. | 7.146 | -12,69 | 249 | -7,46 | ||||
| 2025-05-16 | 13F/A | Kestra Investment Management, LLC | 0 | -100,00 | 0 | |||||
| 2025-08-12 | 13F | Calton & Associates, Inc. | 8.813 | 0,22 | 307 | 6,25 | ||||
| 2025-08-14 | 13F | Family Office Research LLC | 77.726 | -3,07 | 2.705 | 2,85 | ||||
| 2025-08-15 | 13F | Equitable Holdings, Inc. | 21.962 | -18,48 | 764 | -13,48 | ||||
| 2025-08-04 | 13F | Atria Investments Llc | 0 | -100,00 | 0 | |||||
| 2025-08-12 | 13F | LPL Financial LLC | 1.158.015 | -8,83 | 40.299 | -3,24 | ||||
| 2025-07-24 | 13F | Eastern Bank | 1.000 | 0,00 | 35 | 6,25 | ||||
| 2025-08-06 | 13F | Prospera Financial Services Inc | 65.322 | 23,56 | 2.273 | 31,16 | ||||
| 2025-07-29 | 13F | Creekside Partners | 65.289 | 0,42 | 2.272 | 6,62 | ||||
| 2025-08-11 | 13F | Private Advisor Group, LLC | 8.084 | 3,91 | 281 | 10,20 | ||||
| 2025-08-04 | 13F | Assetmark, Inc | 569 | 20 | ||||||
| 2025-08-11 | 13F | Great Lakes Advisors, Llc | 998.750 | 6,96 | 34.756 | 13,52 | ||||
| 2025-04-23 | 13F | Archford Capital Strategies, LLC | 0 | -100,00 | 0 | |||||
| 2025-08-04 | 13F | Mesirow Financial Investment Management, Inc. | 256.624 | -4,59 | 8.931 | 1,26 | ||||
| 2025-07-24 | 13F | Stiles Financial Services Inc | 20.335 | 4,62 | 708 | 10,99 | ||||
| 2025-08-11 | 13F | Cornerstone Planning Group LLC | 0 | -100,00 | 0 | |||||
| 2025-08-26 | 13F/A | Thrivent Financial For Lutherans | 12.688 | 0 | ||||||
| 2025-08-05 | 13F | GPS Wealth Strategies Group, LLC | 1.080 | 0,00 | 38 | 5,71 | ||||
| 2025-07-08 | 13F | Gradient Investments LLC | 1.236.426 | 2,01 | 43.028 | 8,27 | ||||
| 2025-08-01 | 13F | Envestnet Asset Management Inc | 8.924 | -10,57 | 311 | -5,20 | ||||
| 2025-08-07 | 13F | Sierra Ocean, Llc | 4.226 | 0,00 | 143 | 0,00 | ||||
| 2025-07-17 | 13F | Janney Montgomery Scott LLC | 24.875 | -19,81 | 1 | -100,00 | ||||
| 2025-08-05 | 13F | Atlas Wealth LLC | 11.374 | -24,35 | 403 | -18,29 | ||||
| 2025-08-14 | 13F | Van Eck Associates Corp | 165 | 0,00 | 0 | |||||
| 2025-07-10 | 13F | Financial Management Network Inc | 561.077 | 1,05 | 20.193 | 24,73 | ||||
| 2025-08-14 | 13F | Goldman Sachs Group Inc | 0 | -100,00 | 0 | |||||
| 2025-08-15 | 13F | Kestra Advisory Services, LLC | 70.195 | -53,38 | 2.443 | -50,54 | ||||
| 2025-07-10 | 13F | Wealth Enhancement Advisory Services, Llc | 55.629 | 2.002 | ||||||
| 2025-07-18 | 13F | TPG Advisors LLC | 56.716 | 2,48 | 1.974 | 8,77 | ||||
| 2025-08-06 | 13F | Commonwealth Equity Services, Llc | 26.510 | 0,30 | 1 | |||||
| 2025-08-13 | 13F | SageView Advisory Group, LLC | 6.561 | 0,00 | 236 | 9,77 | ||||
| 2025-07-16 | 13F | Essex Financial Services, Inc. | 14.489 | -18,27 | 504 | -13,25 | ||||
| 2025-08-14 | 13F | Mml Investors Services, Llc | 117.718 | -11,52 | 4 | 0,00 | ||||
| 2025-07-07 | 13F | Whitaker-Myers Wealth Managers, LTD. | 7.230 | 8,72 | 252 | 15,14 | ||||
| 2025-08-14 | 13F | EP Wealth Advisors, Inc. | 29.375 | -53,34 | 1.022 | -50,48 | ||||
| 2025-07-18 | 13F | Truist Financial Corp | 0 | -100,00 | 0 | |||||
| 2025-08-05 | 13F | Bank Of Montreal /can/ | 0 | -100,00 | 0 | |||||
| 2025-07-24 | 13F | IFP Advisors, Inc | 7.253 | 5,62 | 252 | 12,00 | ||||
| 2025-05-07 | 13F | Valued Retirements, Inc. | 0 | -100,00 | 0 | |||||
| 2025-08-04 | 13F | Creative Financial Designs Inc /adv | 23 | 1 | ||||||
| 2025-07-16 | 13F | Maridea Wealth Management LLC | 0 | -100,00 | 0 | |||||
| 2025-05-16 | 13F | Coppell Advisory Solutions LLC | 0 | -100,00 | 0 | |||||
| 2025-07-17 | 13F | Patton Albertson Miller Group, Llc | 14.507 | -53,61 | 505 | -50,83 | ||||
| 2025-08-14 | 13F | Comerica Bank | 10.752 | -1,84 | 374 | 4,18 | ||||
| 2025-07-24 | 13F | Coordinated Financial Services, Inc. | 22.368 | 35,15 | 778 | 36,49 | ||||
| 2025-08-14 | 13F | Acorn Wealth Advisors, LLC | 35.323 | -8,58 | 1.229 | -2,92 | ||||
| 2025-08-12 | 13F | SRS Capital Advisors, Inc. | 1.432 | 166,67 | 50 | 188,24 | ||||
| 2025-07-31 | 13F | Stegent Equity Advisors, Inc. | 72.756 | 43,72 | 2.532 | 52,56 | ||||
| 2025-04-22 | 13F/A | NorthRock Partners, LLC | 0 | -100,00 | 0 | -100,00 | ||||
| 2025-08-13 | 13F | Russell Investments Group, Ltd. | 50 | 0,00 | 2 | 0,00 | ||||
| 2025-08-01 | 13F | Brinker Capital Investments, LLC | 0 | -100,00 | 0 | |||||
| 2025-07-08 | 13F | Lowe Wealth Advisors, LLC | 19.892 | -2,60 | 692 | 3,44 | ||||
| 2025-07-16 | 13F | Beaumont Financial Advisors, LLC | 31.980 | -3,66 | 1.113 | 2,21 | ||||
| 2025-08-18 | 13F | Geneos Wealth Management Inc. | 515 | 123,91 | 18 | 142,86 | ||||
| 2025-07-08 | 13F | Paladin Wealth, LLC | 32.937 | 6,76 | 1.146 | 13,35 | ||||
| 2025-08-11 | 13F | HighTower Advisors, LLC | 24.748 | -57,72 | 861 | -55,13 |