Grundlæggende statistik
| Institutionelle ejere | 93 total, 93 long only, 0 short only, 0 long/short - change of 3,33% MRQ |
| Gennemsnitlig porteføljeallokering | 0.2603 % - change of -10,98% MRQ |
| Institutionelle aktier (lange) | 791.368 (ex 13D/G) - change of 0,02MM shares 2,69% MRQ |
| Institutionel værdi (lang) | $ 84.391 USD ($1000) |
Institutionelt ejerskab og aktionærer
SPDR Series Trust - SPDR SSGA US Small Cap Low Volatility Index ETF (US:SMLV) har 93 institutionelle ejere og aktionærer, der har indsendt 13D/G- eller 13F-formularer til Securities Exchange Commission (SEC). Disse institutioner har i alt 791,368 aktier. Største aktionærer omfatter Congress Wealth Management LLC / DE /, LPL Financial LLC, DORVAL Corp, Cambridge Investment Research Advisors, Inc., Ieq Capital, Llc, Aqr Capital Management Llc, Ameriprise Financial Inc, Commonwealth Equity Services, Llc, McNaughton Wealth Management, LLC, and Susquehanna International Group, Llp .
SPDR Series Trust - SPDR SSGA US Small Cap Low Volatility Index ETF (ARCA:SMLV) institutionel ejerskabsstruktur viser aktuelle positioner i virksomheden efter institutioner og fonde, samt seneste ændringer i positionsstørrelse. Større aktionærer kan omfatte individuelle investorer, investeringsforeninger, hedgefonde eller institutioner. Skema 13D angiver, at investoren besidder (eller besidder) mere end 5 % af virksomheden og har til hensigt (eller har til hensigt at) aktivt at forfølge en ændring i forretningsstrategi. Skema 13G indikerer en passiv investering på over 5%.
The share price as of September 9, 2025 is 131,88 / share. Previously, on September 10, 2024, the share price was 121,31 / share. This represents an increase of 8,72% over that period.

Fondens stemningsscore
Fund Sentiment Score (fka Ownership Accumulation Score) finder de aktier, der bliver mest købt af fonde. Det er resultatet af en sofistikeret, multi-faktor kvantitativ model, der identificerer virksomheder med de højeste niveauer af institutionel akkumulering. Scoringsmodellen bruger en kombination af den samlede stigning i oplyste ejere, ændringerne i porteføljeallokeringer i disse ejere og andre målinger. Tallet går fra 0 til 100, hvor højere tal indikerer et højere niveau af akkumulering for sine jævnaldrende, og 50 er gennemsnittet.
Opdateringsfrekvens: Dagligt
Se Ownership Explorer, som giver en liste over højest rangerende virksomheder.
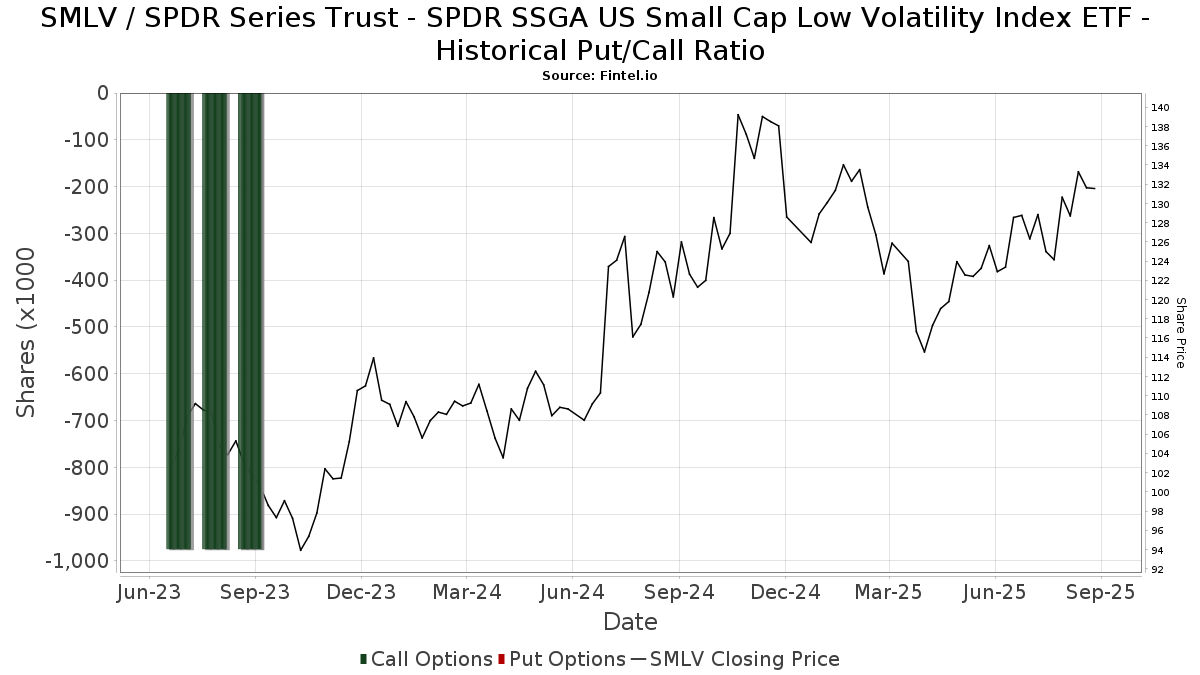
Institutionel Put/Call-forhold
Ud over at indberette standardaktie- og gældsudstedelser skal institutter med mere end 100 mill. aktiver under forvaltning også oplyse deres put- og call-optionsbeholdninger. Da salgsoptioner generelt indikerer negativ stemning, og købsoptioner indikerer positiv stemning, kan vi få en fornemmelse af den overordnede institutionelle stemning ved at plotte forholdet mellem put og kald. Diagrammet til højre viser det historiske put/call-forhold for dette instrument.
Brug af Put/Call Ratio som en indikator for investorernes stemning overvinder en af de vigtigste mangler ved at bruge totalt institutionelt ejerskab, som er, at en betydelig mængde af aktiver under forvaltning investeres passivt for at spore indekser. Passivt forvaltede fonde køber typisk ikke optioner, så indikatoren for put/call-forholdet følger mere nøje følelsen af aktivt forvaltede fonde.
13F og NPORT arkivering
Detaljer om 13F-arkivering er gratis. Detaljer om NP-ansøgninger kræver et premium-medlemskab. Grønne rækker angiver nye positioner. Røde rækker angiver lukkede positioner. Klik på linket ikon for at se den fulde transaktionshistorik.
Opgrader
for at låse premium-data op og eksportere til Excel ![]() .
.
| Fil dato | Kilde | Investor | Type | Gennemsnitlig pris (Øst) |
Aktier | Δ Aktier (%) |
Rapporteret Værdi ($1000) |
Δ Værdi (%) |
Port Alloc (%) |
|
|---|---|---|---|---|---|---|---|---|---|---|
| 2025-07-31 | 13F | Sage Mountain Advisors LLC | 452 | 0,00 | 57 | 1,82 | ||||
| 2025-08-15 | 13F | Equitable Holdings, Inc. | 0 | -100,00 | 0 | |||||
| 2025-08-06 | 13F | Commonwealth Equity Services, Llc | 24.821 | -21,58 | 3 | 0,00 | ||||
| 2025-05-12 | 13F | Jpmorgan Chase & Co | 0 | -100,00 | 0 | -100,00 | ||||
| 2025-08-14 | 13F | Bank Of America Corp /de/ | 13.562 | 10,05 | 1.697 | 12,02 | ||||
| 2025-07-10 | 13F | High Net Worth Advisory Group LLC | 1.870 | -1,84 | 234 | -0,43 | ||||
| 2025-08-07 | 13F | Winthrop Capital Management, LLC | 142 | -4,70 | 0 | |||||
| 2025-04-21 | 13F | PSI Advisors, LLC | 0 | -100,00 | 0 | |||||
| 2025-08-12 | 13F | Proequities, Inc. | 0 | 0 | ||||||
| 2025-07-29 | 13F | Portland Financial Advisors Inc | 4.215 | 0,00 | 527 | 1,93 | ||||
| 2025-08-01 | 13F | Envestnet Asset Management Inc | 17.287 | -6,19 | 2.163 | -4,51 | ||||
| 2025-08-11 | 13F | United Capital Financial Advisers, Llc | 5.786 | -1,93 | 724 | -0,14 | ||||
| 2025-05-08 | 13F | Plante Moran Financial Advisors, LLC | 0 | -100,00 | 0 | |||||
| 2025-07-30 | 13F | Insight Advisors, LLC/ PA | 8.480 | -3,89 | 1.061 | -2,21 | ||||
| 2025-08-14 | 13F | Ieq Capital, Llc | 56.025 | 0,00 | 7.009 | 1,82 | ||||
| 2025-08-14 | 13F | Sunbelt Securities, Inc. | 10 | 0,00 | 1 | 0,00 | ||||
| 2025-08-14 | 13F | UBS Group AG | 10.285 | 1,50 | 1.287 | 3,29 | ||||
| 2025-07-29 | 13F | Stratos Wealth Partners, LTD. | 4.056 | 2,81 | 508 | 4,75 | ||||
| 2025-07-25 | 13F | Cwm, Llc | 0 | -100,00 | 0 | |||||
| 2025-08-14 | 13F | Ausdal Financial Partners, Inc. | 3.985 | 0,66 | 499 | 2,47 | ||||
| 2025-07-31 | 13F | Cambridge Investment Research Advisors, Inc. | 64.889 | 4,75 | 8 | 14,29 | ||||
| 2025-08-12 | 13F | Jaffetilchin Investment Partners, LLC | 2.979 | 0,27 | 373 | 1,92 | ||||
| 2025-07-14 | 13F | Painted Porch Advisors LLC | 115 | 0,88 | 14 | 0,00 | ||||
| 2025-08-13 | 13F | Summit Wealth Group Llc / Co | 4.493 | 562 | ||||||
| 2025-06-24 | NP | TNQIX - 1290 Retirement 2055 Fund Class I | 744 | 0,00 | 89 | -9,28 | ||||
| 2025-08-14 | 13F | Ameriprise Financial Inc | 36.642 | 1,82 | 4.584 | 3,69 | ||||
| 2025-08-08 | 13F | Avantax Advisory Services, Inc. | 11.001 | -2,14 | 1.376 | -0,36 | ||||
| 2025-08-18 | 13F | N.E.W. Advisory Services LLC | 113 | 0,89 | 14 | 7,69 | ||||
| 2025-08-04 | 13F | Spire Wealth Management | 37 | -77,16 | 5 | -78,95 | ||||
| 2025-07-09 | 13F | Fragasso Group Inc. | 2.909 | 364 | ||||||
| 2025-08-06 | 13F | AE Wealth Management LLC | 69 | 0,00 | 9 | 0,00 | ||||
| 2025-08-11 | 13F | Citigroup Inc | 6.100 | 0,15 | 763 | 2,01 | ||||
| 2025-07-16 | 13F | Swisher Financial Concepts, Inc. | 2.541 | 7,90 | 318 | 9,69 | ||||
| 2025-07-30 | 13F | Pacific Sun Financial Corp | 6.194 | -6,77 | 775 | -5,15 | ||||
| 2025-08-14 | 13F | Goldman Sachs Group Inc | 7.702 | 0,00 | 964 | 1,80 | ||||
| 2025-07-24 | 13F | Us Bancorp \de\ | 8 | 0,00 | 1 | |||||
| 2025-06-24 | NP | TNWIX - 1290 Retirement 2050 Fund Class I | 726 | 0,00 | 86 | -9,47 | ||||
| 2025-08-15 | 13F | Morgan Stanley | 10.664 | 6,45 | 1.334 | 8,46 | ||||
| 2025-08-12 | 13F | Steward Partners Investment Advisory, Llc | 720 | 0,00 | 90 | 2,27 | ||||
| 2025-08-11 | 13F | Western Wealth Management, LLC | 2.015 | 0,05 | 252 | 2,02 | ||||
| 2025-08-13 | 13F | Jones Financial Companies Lllp | 5.513 | 86,00 | 690 | 89,29 | ||||
| 2025-08-12 | 13F | CIBC Private Wealth Group, LLC | 1.400 | 0,00 | 175 | 13,64 | ||||
| 2025-09-04 | 13F/A | Advisor Group Holdings, Inc. | 5.118 | 16,93 | 641 | 19,14 | ||||
| 2025-07-22 | 13F | Valley National Advisers Inc | 191 | 0,00 | 0 | |||||
| 2025-06-24 | NP | TNIIX - 1290 Retirement 2020 Fund Class I | 85 | 0,00 | 10 | -9,09 | ||||
| 2025-05-15 | 13F | Capstone Investment Advisors, Llc | 0 | -100,00 | 0 | |||||
| 2025-07-24 | 13F | IFP Advisors, Inc | 1.052 | 0,00 | 132 | 1,55 | ||||
| 2025-07-17 | 13F | Johnson & White Wealth Management, LLC | 13.361 | 3,29 | 2 | 0,00 | ||||
| 2025-08-14 | 13F | IHT Wealth Management, LLC | 1.991 | 0,61 | 249 | 2,47 | ||||
| 2025-07-10 | 13F | HF Advisory Group, LLC | 7.289 | -1,21 | 912 | 0,55 | ||||
| 2025-07-28 | 13F | DORVAL Corp | 74.202 | 4,19 | 9.284 | -0,42 | ||||
| 2025-06-24 | NP | TNLIX - 1290 Retirement 2035 Fund Class I | 270 | 0,00 | 32 | -8,57 | ||||
| 2025-08-04 | 13F | Assetmark, Inc | 165 | 21 | ||||||
| 2025-08-14 | 13F | Warren Averett Asset Management, LLC | 2.545 | -9,53 | 318 | -7,83 | ||||
| 2025-07-29 | 13F | Signature Estate & Investment Advisors Llc | 1.602 | 200 | ||||||
| 2025-08-06 | 13F | Savant Capital, LLC | 6.255 | -6,88 | 783 | -5,21 | ||||
| 2025-07-23 | 13F | Dohj, Llc | 2.555 | -0,04 | 300 | -4,78 | ||||
| 2025-08-12 | 13F | O'shaughnessy Asset Management, Llc | 480 | 0,00 | 60 | 3,45 | ||||
| 2025-07-09 | 13F | Reyes Financial Architecture, Inc. | 100 | 0,00 | 13 | 0,00 | ||||
| 2025-07-17 | 13F | Vermillion Wealth Management, Inc. | 112 | 0,90 | 14 | 0,00 | ||||
| 2025-07-08 | 13F | Nbc Securities, Inc. | 110 | 0,00 | 0 | |||||
| 2025-08-11 | 13F | Principal Securities, Inc. | 629 | 1,94 | 79 | 0,00 | ||||
| 2025-08-13 | 13F | Capital Analysts, Inc. | 2.974 | -41,88 | 0 | |||||
| 2025-07-28 | 13F | Harbour Investments, Inc. | 66 | 0,00 | 8 | 0,00 | ||||
| 2025-08-14 | 13F | Aqr Capital Management Llc | 46.571 | 0,00 | 5.827 | 1,82 | ||||
| 2025-08-12 | 13F | Cowa, Llc | 7.387 | 4,51 | 924 | 6,45 | ||||
| 2025-07-22 | 13F | McNaughton Wealth Management, LLC | 23.417 | 1,96 | 2.930 | 3,79 | ||||
| 2025-08-08 | 13F | Cornerstone Advisors Asset Management, Inc | 0 | -100,00 | 0 | |||||
| 2025-07-14 | 13F | AdvisorNet Financial, Inc | 383 | 0,79 | 48 | 2,17 | ||||
| 2025-08-13 | 13F | Navis Wealth Advisors, LLC | 6.050 | 0,67 | 757 | 2,44 | ||||
| 2025-08-13 | 13F | Beacon Pointe Advisors, LLC | 4.391 | -12,95 | 549 | -11,31 | ||||
| 2025-08-13 | 13F | IAG Wealth Partners, LLC | 13.280 | -5,05 | 1.662 | -3,32 | ||||
| 2025-08-13 | 13F | Continuum Advisory, LLC | 2.272 | 0,53 | 284 | 2,53 | ||||
| 2025-08-11 | 13F | HighTower Advisors, LLC | 3.846 | 0,65 | 481 | 2,56 | ||||
| 2025-08-11 | 13F | Tidemark, LLC | 162 | 0,00 | 20 | 5,26 | ||||
| 2025-06-24 | NP | TNKIX - 1290 Retirement 2030 Fund Class I | 227 | 0,00 | 27 | -6,90 | ||||
| 2025-08-14 | 13F | GWM Advisors LLC | 5.762 | 16,08 | 721 | 18,23 | ||||
| 2025-07-15 | 13F | McAdam, LLC | 2.988 | 5,55 | 374 | 7,49 | ||||
| 2025-06-24 | NP | TNJIX - 1290 Retirement 2025 Fund Class I | 19 | -5,00 | 2 | 0,00 | ||||
| 2025-08-11 | 13F | Private Advisor Group, LLC | 1.924 | -48,36 | 241 | -47,48 | ||||
| 2025-08-08 | 13F | Capital Investment Advisory Services, LLC | 67 | 0,00 | 8 | 0,00 | ||||
| 2025-06-24 | NP | TNOIX - 1290 Retirement 2045 Fund Class I | 654 | 0,00 | 78 | -9,41 | ||||
| 2025-08-14 | 13F | Two Sigma Investments, Lp | 7.400 | -28,85 | 926 | -27,56 | ||||
| 2025-08-14 | 13F | Wells Fargo & Company/mn | 89 | -31,01 | 11 | -26,67 | ||||
| 2025-08-08 | 13F | Cetera Investment Advisers | 8.225 | 44,81 | 1.029 | 47,49 | ||||
| 2025-08-12 | 13F | LPL Financial LLC | 75.092 | 25,27 | 9.395 | 27,55 | ||||
| 2025-07-30 | 13F | Strategic Blueprint, LLC | 3.110 | 0,00 | 389 | 1,83 | ||||
| 2025-08-05 | 13F | Roffman Miller Associates Inc /pa/ | 2.932 | 0,55 | 367 | 2,23 | ||||
| 2025-08-14 | 13F | Royal Bank Of Canada | 1.346 | 62,17 | 169 | 65,69 | ||||
| 2025-08-14 | 13F | Susquehanna International Group, Llp | 19.694 | 2.464 | ||||||
| 2025-04-08 | 13F | J2 Capital Management Inc | 0 | -100,00 | 0 | |||||
| 2025-05-14 | 13F | Kestra Advisory Services, LLC | 0 | -100,00 | 0 | -100,00 | ||||
| 2025-07-30 | 13F | Bogart Wealth, LLC | 74 | 0,00 | 9 | 0,00 | ||||
| 2025-03-28 | 13F/A | Berkeley, Inc | 0 | -100,00 | 0 | -100,00 | ||||
| 2025-07-14 | 13F | Park Avenue Securities Llc | 9.798 | 41,30 | 1 | |||||
| 2025-05-14 | 13F | Northwestern Mutual Wealth Management Co | 0 | -100,00 | 0 | |||||
| 2025-08-08 | 13F | Pnc Financial Services Group, Inc. | 9.328 | -9,71 | 1.167 | -8,12 | ||||
| 2025-08-14 | 13F | Raymond James Financial Inc | 3.062 | 1,36 | 383 | 3,23 | ||||
| 2025-06-24 | NP | TNNIX - 1290 Retirement 2040 Fund Class I | 577 | 0,00 | 69 | -9,33 | ||||
| 2025-08-14 | 13F | Fmr Llc | 157 | -12,78 | 20 | -13,64 | ||||
| 2025-07-18 | 13F | SOA Wealth Advisors, LLC. | 668 | 0,60 | 84 | 2,47 | ||||
| 2025-07-16 | 13F | ORG Partners LLC | 0 | -100,00 | 0 | |||||
| 2025-07-11 | 13F | Farther Finance Advisors, LLC | 59 | 1,72 | 7 | 0,00 | ||||
| 2025-08-13 | 13F | Congress Wealth Management LLC / DE / | 85.695 | -19,27 | 10.722 | -17,80 | ||||
| 2025-08-14 | 13F | Atomi Financial Group, Inc. | 2.235 | -1,97 | 280 | -0,36 | ||||
| 2025-07-22 | 13F | Miracle Mile Advisors, LLC | 2.725 | 341 | ||||||
| 2025-04-29 | 13F | Resources Investment Advisors, LLC. | 0 | -100,00 | 0 | -100,00 |