Grundlæggende statistik
| Institutionelle ejere | 71 total, 71 long only, 0 short only, 0 long/short - change of 22,41% MRQ |
| Gennemsnitlig porteføljeallokering | 0.0666 % - change of -30,21% MRQ |
| Institutionelle aktier (lange) | 223.986.193 (ex 13D/G) - change of 11,75MM shares 5,54% MRQ |
| Institutionel værdi (lang) | $ 5.750.423 USD ($1000) |
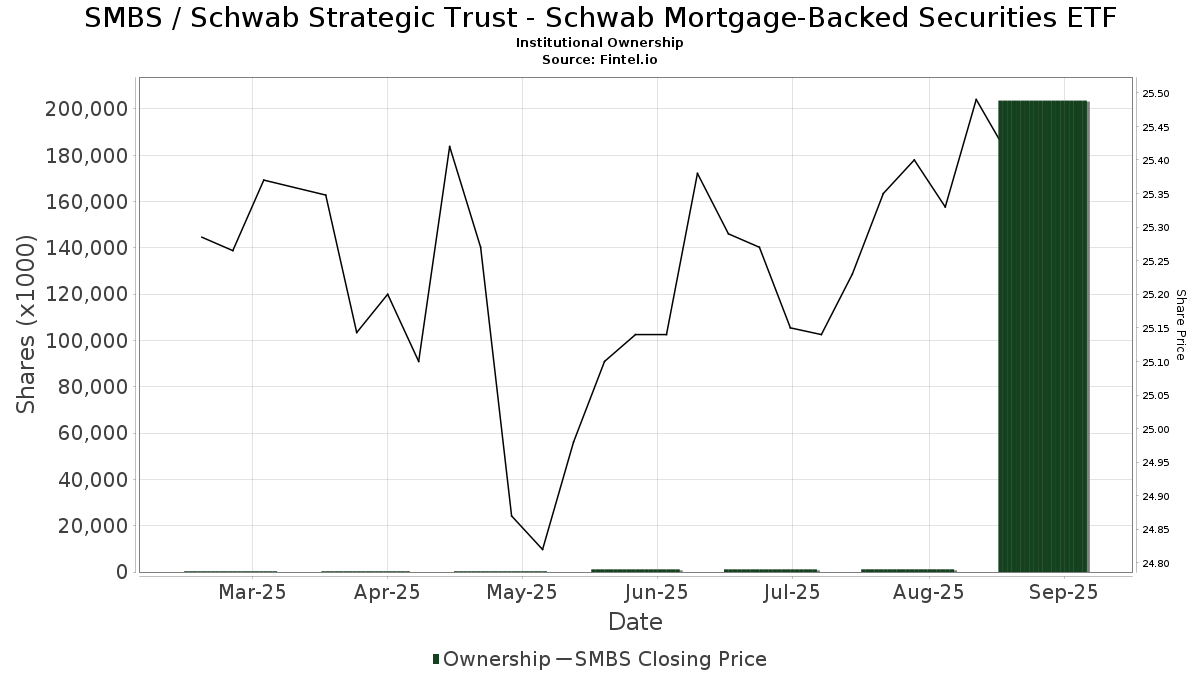
Institutionelt ejerskab og aktionærer
Schwab Strategic Trust - Schwab Mortgage-Backed Securities ETF (US:SMBS) har 71 institutionelle ejere og aktionærer, der har indsendt 13D/G- eller 13F-formularer til Securities Exchange Commission (SEC). Disse institutioner har i alt 223,986,193 aktier. Største aktionærer omfatter Charles Schwab Investment Management Inc, CacheTech Inc., Adams Wealth Management, Summit Financial, LLC, Susquehanna International Group, Llp, Citadel Advisors Llc, Jane Street Group, Llc, Mariner, LLC, LPL Financial LLC, and Chapman Financial Group, Llc .
Schwab Strategic Trust - Schwab Mortgage-Backed Securities ETF (ARCA:SMBS) institutionel ejerskabsstruktur viser aktuelle positioner i virksomheden efter institutioner og fonde, samt seneste ændringer i positionsstørrelse. Større aktionærer kan omfatte individuelle investorer, investeringsforeninger, hedgefonde eller institutioner. Skema 13D angiver, at investoren besidder (eller besidder) mere end 5 % af virksomheden og har til hensigt (eller har til hensigt at) aktivt at forfølge en ændring i forretningsstrategi. Skema 13G indikerer en passiv investering på over 5%.
The share price as of March 18, 2026 is 25,59 / share. Previously, on March 19, 2025, the share price was 25,37 / share. This represents an increase of 0,87% over that period.
Fondens stemningsscore
Fund Sentiment Score (fka Ownership Accumulation Score) finder de aktier, der bliver mest købt af fonde. Det er resultatet af en sofistikeret, multi-faktor kvantitativ model, der identificerer virksomheder med de højeste niveauer af institutionel akkumulering. Scoringsmodellen bruger en kombination af den samlede stigning i oplyste ejere, ændringerne i porteføljeallokeringer i disse ejere og andre målinger. Tallet går fra 0 til 100, hvor højere tal indikerer et højere niveau af akkumulering for sine jævnaldrende, og 50 er gennemsnittet.
Opdateringsfrekvens: Dagligt
Se Ownership Explorer, som giver en liste over højest rangerende virksomheder.
AI+ Ask Fintel’s AI assistant about Schwab Strategic Trust - Schwab Mortgage-Backed Securities ETF.
Select a question to share a public post with an AI-crafted answer.
Thinking of good questions…
Institutionel Put/Call-forhold
Ud over at indberette standardaktie- og gældsudstedelser skal institutter med mere end 100 mill. aktiver under forvaltning også oplyse deres put- og call-optionsbeholdninger. Da salgsoptioner generelt indikerer negativ stemning, og købsoptioner indikerer positiv stemning, kan vi få en fornemmelse af den overordnede institutionelle stemning ved at plotte forholdet mellem put og kald. Diagrammet til højre viser det historiske put/call-forhold for dette instrument.
Brug af Put/Call Ratio som en indikator for investorernes stemning overvinder en af de vigtigste mangler ved at bruge totalt institutionelt ejerskab, som er, at en betydelig mængde af aktiver under forvaltning investeres passivt for at spore indekser. Passivt forvaltede fonde køber typisk ikke optioner, så indikatoren for put/call-forholdet følger mere nøje følelsen af aktivt forvaltede fonde.
13F og NPORT arkivering
Detaljer om 13F-arkivering er gratis. Detaljer om NP-ansøgninger kræver et premium-medlemskab. Grønne rækker angiver nye positioner. Røde rækker angiver lukkede positioner. Klik på linket ikon for at se den fulde transaktionshistorik.
Opgrader
for at låse premium-data op og eksportere til Excel ![]() .
.
| Fil dato | Kilde | Investor | Type | Gennemsnitlig pris (Øst) |
Aktier | Δ Aktier (%) |
Rapporteret Værdi ($1000) |
Δ Værdi (%) |
Port Alloc (%) |
|
|---|---|---|---|---|---|---|---|---|---|---|
| 2026-02-13 | 13F | Smartleaf Asset Management LLC | 93 | 2 | ||||||
| 2026-01-29 | 13F | Camelot Portfolios, LLC | 138 | 4 | ||||||
| 2025-11-03 | 13F | SYM FINANCIAL Corp | 0 | -100,00 | 0 | -100,00 | ||||
| 2026-02-18 | 13F | GWM Advisors LLC | 2 | 0 | ||||||
| 2025-10-16 | 13F | Mogy Joel R Investment Counsel Inc | 0 | -100,00 | 0 | |||||
| 2026-01-26 | 13F | Harbor Asset Planning, Inc. | 142 | 4 | ||||||
| 2025-11-13 | 13F | Parallel Advisors, LLC | 0 | -100,00 | 0 | |||||
| 2026-01-29 | 13F | Quent Capital, LLC | 63 | 2 | ||||||
| 2026-02-13 | 13F | Greenline Wealth Management LLC | 84 | 2 | ||||||
| 2026-02-13 | 13F | Colony Group, LLC | 10.745 | 276 | ||||||
| 2026-02-17 | 13F | Raymond James Financial Inc | 8.996 | 231 | ||||||
| 2026-01-26 | 13F | Phillips Financial Management, Llc | 871 | 22 | ||||||
| 2026-02-02 | 13F | Hidden Cove Wealth Management, LLC | 14.501 | 372 | ||||||
| 2026-02-06 | 13F | Larson Financial Group LLC | 0 | -100,00 | 0 | |||||
| 2026-02-12 | 13F | Triumph Capital Management | 1.218 | 0,00 | 31 | 0,00 | ||||
| 2026-02-17 | 13F | Royal Bank Of Canada | 822 | 27.300,00 | 21 | |||||
| 2026-02-17 | 13F | Cetera Investment Advisers | 12.687 | 326 | ||||||
| 2026-02-12 | 13F | CIBC Private Wealth Group, LLC | 0 | -100,00 | 0 | |||||
| 2026-01-16 | 13F | PFS Partners, LLC | 2.688 | 0,00 | 69 | 0,00 | ||||
| 2026-01-30 | 13F | Chapin Davis, Inc. | 12.698 | 0,00 | 326 | 0,00 | ||||
| 2026-01-20 | 13F | Signaturefd, Llc | 101 | 0,00 | 3 | 0,00 | ||||
| 2026-02-06 | 13F | Orin Green Financial, LLC | 0 | -100,00 | 0 | |||||
| 2026-01-23 | 13F | Farther Finance Advisors, LLC | 238 | -58,10 | 6 | -57,14 | ||||
| 2026-02-10 | 13F | Bnp Paribas Arbitrage, Sa | 2 | 0 | ||||||
| 2026-02-17 | 13F | Mercer Global Advisors Inc /adv | 21.999 | -6,70 | 565 | -6,93 | ||||
| 2026-02-17 | 13F | Ancora Advisors, LLC | 3.592 | 92 | ||||||
| 2025-11-14 | 13F | Lido Advisors, LLC | 0 | -100,00 | 0 | |||||
| 2026-02-10 | 13F | Private Wealth Asset Management, LLC | 3.533 | 91 | ||||||
| 2026-02-10 | 13F | Root Financial Partners, LLC | 858 | 87,75 | 22 | 100,00 | ||||
| 2026-01-13 | 13F | CoreCap Advisors, LLC | 1.559 | -46,68 | 40 | -46,67 | ||||
| 2026-02-17 | 13F | Fmr Llc | 5.372 | 138 | ||||||
| 2026-02-11 | 13F | LPL Financial LLC | 29.327 | 20,08 | 753 | 19,94 | ||||
| 2026-01-16 | 13F | Empirical Financial Services, LLC d.b.a. Empirical Wealth Management | 0 | -100,00 | 0 | |||||
| 2026-01-26 | 13F | AE Wealth Management LLC | 246 | 19,42 | 6 | 20,00 | ||||
| 2026-02-17 | 13F | Blair William & Co/il | 6 | 0 | ||||||
| 2026-02-13 | 13F | SRS Capital Advisors, Inc. | 46 | 1 | ||||||
| 2026-01-27 | 13F | Godsey & Gibb Associates | 486 | 0,00 | 12 | 0,00 | ||||
| 2026-02-05 | 13F | Allworth Financial LP | 2.268 | 4.100,00 | 58 | 5.700,00 | ||||
| 2025-11-14 | 13F | Binnacle Investments Inc | 546 | 0,00 | 14 | 7,69 | ||||
| 2026-02-11 | 13F | MCF Advisors LLC | 845 | -14,90 | 22 | -16,00 | ||||
| 2026-02-17 | 13F | Creative Planning | 11.056 | 284 | ||||||
| 2026-02-14 | 13F | Rockefeller Capital Management L.P. | 2.796 | 727,22 | 72 | 787,50 | ||||
| 2026-02-17 | 13F | Adams Wealth Management | 354.800 | 0,63 | 9.109 | 0,50 | ||||
| 2026-02-17 | 13F | Cdkv Holdings Llc | 521 | 13 | ||||||
| 2025-11-12 | 13F | Us Bancorp \de\ | 0 | -100,00 | 0 | |||||
| 2026-02-13 | 13F | Morgan Stanley | 5.245 | 26,81 | 135 | 26,42 | ||||
| 2026-01-29 | 13F | UBS Group AG | 0 | -100,00 | 0 | |||||
| 2026-02-18 | 13F | CacheTech Inc. | 390.201 | 2,79 | 10.018 | 2,64 | ||||
| 2026-02-06 | 13F | Pnc Financial Services Group, Inc. | 7.220 | 80,00 | 185 | 79,61 | ||||
| 2026-02-09 | 13F | Hartland & Co., LLC | 12 | -62,50 | 0 | |||||
| 2026-02-12 | 13F | Jane Street Group, Llc | 48.742 | 202,93 | 1.251 | 202,91 | ||||
| 2026-02-17 | 13F | Jones Financial Companies Lllp | 62 | -91,97 | 2 | -94,74 | ||||
| 2026-02-13 | 13F | Aptus Capital Advisors, LLC | 0 | -100,00 | 0 | |||||
| 2026-02-17 | 13F | Advisor Group Holdings, Inc. | 7.281 | 50,31 | 187 | 51,22 | ||||
| 2026-02-12 | 13F | Summit Financial, LLC | 106.922 | 0,62 | 2.745 | 0,48 | ||||
| 2026-02-27 | 13F | Compass Financial Services Inc | 0 | -100,00 | 0 | |||||
| 2026-02-02 | 13F | Fifth Third Bancorp | 2.064 | 53 | ||||||
| 2026-01-23 | 13F | Creative Capital Management Investments LLC | 487 | 13 | ||||||
| 2026-02-13 | 13F | MAI Capital Management | 5.943 | 1.443,64 | 153 | 1.588,89 | ||||
| 2026-02-06 | 13F | Cullen/frost Bankers, Inc. | 0 | -100,00 | 0 | |||||
| 2026-01-28 | 13F | Hoey Investments, Inc | 1.557 | 0,00 | 40 | -2,50 | ||||
| 2026-02-11 | 13F | Jpmorgan Chase & Co | 810 | 21 | ||||||
| 2026-01-27 | 13F | Financial Management Professionals, Inc. | 115 | 0,00 | 3 | 0,00 | ||||
| 2026-02-11 | 13F | Franklin Resources Inc | 240 | 6 | ||||||
| 2026-02-02 | 13F | Chapman Financial Group, Llc | 25.281 | 4,76 | 649 | 4,68 | ||||
| 2026-02-12 | 13F | Wealthspire Advisors, LLC | 0 | -100,00 | 0 | |||||
| 2026-02-12 | 13F | Hrt Financial Lp | 8.696 | 0 | ||||||
| 2026-02-14 | 13F | Howe & Rusling Inc | 3.080 | 203,75 | 79 | 203,85 | ||||
| 2026-01-20 | 13F | AdvisorNet Financial, Inc | 0 | -100,00 | 0 | |||||
| 2026-01-26 | 13F | Cwm, Llc | 6.560 | 3.213,13 | 0 | |||||
| 2026-02-09 | 13F | Harbour Investments, Inc. | 825 | 1,73 | 21 | 5,00 | ||||
| 2026-01-23 | 13F | Optima Capital Llc | 294 | 8 | ||||||
| 2025-11-14 | 13F | Old Mission Capital Llc | 0 | -100,00 | 0 | |||||
| 2026-01-23 | 13F | Steigerwald, Gordon & Koch Inc. | 0 | -100,00 | 0 | |||||
| 2026-01-22 | 13F | Bartlett & Co. Wealth Management Llc | 0 | -100,00 | 0 | |||||
| 2026-01-27 | 13F | WealthCollab, LLC | 3.235 | 83 | ||||||
| 2026-02-17 | 13F | Susquehanna International Group, Llp | 92.244 | 387,57 | 2.368 | 387,24 | ||||
| 2026-02-13 | 13F | Mariner, LLC | 29.388 | 69,65 | 755 | 69,44 | ||||
| 2025-11-13 | 13F | Johnson Financial Group, Inc. | 0 | -100,00 | 0 | |||||
| 2026-01-23 | 13F | Valley National Advisers Inc | 50 | 0 | ||||||
| 2026-02-13 | 13F | Charles Schwab Investment Management Inc | 222.649.093 | 5,48 | 5.716.516 | 5,34 | ||||
| 2025-11-14 | 13F | NorthRock Partners, LLC | 0 | -100,00 | 0 | -100,00 | ||||
| 2025-11-14 | 13F | Mpwm Advisory Solutions, Llc | 0 | 0 | ||||||
| 2026-02-17 | 13F | Citadel Advisors Llc | 59.155 | -21,45 | 1.519 | -21,59 | ||||
| 2026-01-15 | 13F | Highline Wealth Partners Llc | 0 | -100,00 | 0 | |||||
| 2026-02-13 | 13F | Wells Fargo & Company/mn | 1.736 | 451,11 | 45 | 450,00 | ||||
| 2026-02-06 | 13F | IFP Advisors, Inc | 8.313 | 213 | ||||||
| 2026-01-13 | 13F | John W. Brooker & Co., CPAs | 0 | -100,00 | 0 | |||||
| 2026-02-10 | 13F | Goldman Sachs Group Inc | 0 | -100,00 | 0 | |||||
| 2026-01-16 | 13F | Piscataqua Savings Bank | 5.234 | 134 | ||||||
| 2025-11-06 | 13F | CENTRAL TRUST Co | 0 | -100,00 | 0 | |||||
| 2026-01-23 | 13F | Assetmark, Inc | 24 | -70,73 | 1 | -100,00 | ||||
| 2026-02-12 | 13F | Brown Brothers Harriman & Co | 322 | 8 | ||||||
| 2026-02-17 | 13F | Bank Of America Corp /de/ | 2 | -99,88 | 0 | -100,00 | ||||
| 2026-02-06 | 13F | Global Retirement Partners, LLC | 3.347 | 86 | ||||||
| 2026-02-10 | 13F/A | Northwestern Mutual Wealth Management Co | 6.468 | 305,26 | 166 | 304,88 |