Grundlæggende statistik
| Institutionelle ejere | 107 total, 105 long only, 1 short only, 1 long/short - change of 21,59% MRQ |
| Gennemsnitlig porteføljeallokering | 0.0302 % - change of -0,87% MRQ |
| Institutionelle aktier (lange) | 6.387.203 (ex 13D/G) - change of 1,81MM shares 39,68% MRQ |
| Institutionel værdi (lang) | $ 138.898 USD ($1000) |
Institutionelt ejerskab og aktionærer
Global X Funds - Global X SuperDividend ETF (US:SDIV) har 107 institutionelle ejere og aktionærer, der har indsendt 13D/G- eller 13F-formularer til Securities Exchange Commission (SEC). Disse institutioner har i alt 6,819,612 aktier. Største aktionærer omfatter LPL Financial LLC, Howard Capital Management Inc., Morgan Stanley, Foguth Wealth Management, LLC., Signal Advisors Wealth, LLC, Bank Of America Corp /de/, Advisor Group Holdings, Inc., Wells Fargo & Company/mn, Susquehanna International Group, Llp, and Newbridge Financial Services Group, Inc. .
Global X Funds - Global X SuperDividend ETF (ARCA:SDIV) institutionel ejerskabsstruktur viser aktuelle positioner i virksomheden efter institutioner og fonde, samt seneste ændringer i positionsstørrelse. Større aktionærer kan omfatte individuelle investorer, investeringsforeninger, hedgefonde eller institutioner. Skema 13D angiver, at investoren besidder (eller besidder) mere end 5 % af virksomheden og har til hensigt (eller har til hensigt at) aktivt at forfølge en ændring i forretningsstrategi. Skema 13G indikerer en passiv investering på over 5%.
The share price as of September 12, 2025 is 23,94 / share. Previously, on September 13, 2024, the share price was 22,50 / share. This represents an increase of 6,40% over that period.

Fondens stemningsscore
Fund Sentiment Score (fka Ownership Accumulation Score) finder de aktier, der bliver mest købt af fonde. Det er resultatet af en sofistikeret, multi-faktor kvantitativ model, der identificerer virksomheder med de højeste niveauer af institutionel akkumulering. Scoringsmodellen bruger en kombination af den samlede stigning i oplyste ejere, ændringerne i porteføljeallokeringer i disse ejere og andre målinger. Tallet går fra 0 til 100, hvor højere tal indikerer et højere niveau af akkumulering for sine jævnaldrende, og 50 er gennemsnittet.
Opdateringsfrekvens: Dagligt
Se Ownership Explorer, som giver en liste over højest rangerende virksomheder.
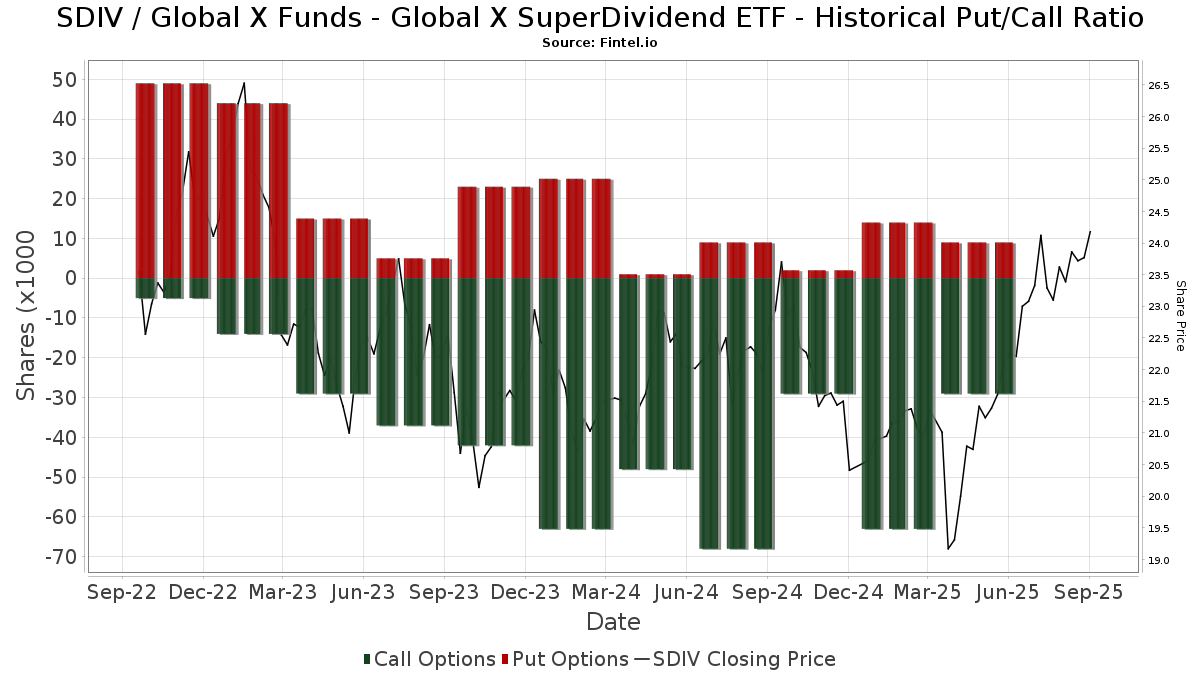
Institutionel Put/Call-forhold
Ud over at indberette standardaktie- og gældsudstedelser skal institutter med mere end 100 mill. aktiver under forvaltning også oplyse deres put- og call-optionsbeholdninger. Da salgsoptioner generelt indikerer negativ stemning, og købsoptioner indikerer positiv stemning, kan vi få en fornemmelse af den overordnede institutionelle stemning ved at plotte forholdet mellem put og kald. Diagrammet til højre viser det historiske put/call-forhold for dette instrument.
Brug af Put/Call Ratio som en indikator for investorernes stemning overvinder en af de vigtigste mangler ved at bruge totalt institutionelt ejerskab, som er, at en betydelig mængde af aktiver under forvaltning investeres passivt for at spore indekser. Passivt forvaltede fonde køber typisk ikke optioner, så indikatoren for put/call-forholdet følger mere nøje følelsen af aktivt forvaltede fonde.
13F og NPORT arkivering
Detaljer om 13F-arkivering er gratis. Detaljer om NP-ansøgninger kræver et premium-medlemskab. Grønne rækker angiver nye positioner. Røde rækker angiver lukkede positioner. Klik på linket ikon for at se den fulde transaktionshistorik.
Opgrader
for at låse premium-data op og eksportere til Excel ![]() .
.
| Fil dato | Kilde | Investor | Type | Gennemsnitlig pris (Øst) |
Aktier | Δ Aktier (%) |
Rapporteret Værdi ($1000) |
Δ Værdi (%) |
Port Alloc (%) |
|
|---|---|---|---|---|---|---|---|---|---|---|
| 2025-08-13 | 13F | Renaissance Technologies Llc | 28.045 | 632 | ||||||
| 2025-08-07 | 13F | Kestra Private Wealth Services, Llc | 46.775 | 67,90 | 1.055 | 80,48 | ||||
| 2025-08-14 | 13F | Bank Of America Corp /de/ | 410.676 | -8,65 | 9.261 | -1,77 | ||||
| 2025-07-31 | 13F | Cambridge Investment Research Advisors, Inc. | 120.288 | 3,35 | 3 | 0,00 | ||||
| 2025-08-06 | 13F | Atlantic Union Bankshares Corp | 230 | 5 | ||||||
| 2025-08-04 | 13F | Integrity Alliance, Llc. | 18.674 | -0,19 | 421 | 7,40 | ||||
| 2025-08-11 | 13F | Private Advisor Group, LLC | 14.377 | 324 | ||||||
| 2025-08-14 | 13F | Jane Street Group, Llc | 17.057 | 385 | ||||||
| 2025-07-09 | 13F | Lifestyle Asset Management, Inc. | 14.372 | 324 | ||||||
| 2025-05-15 | 13F | Talon Private Wealth, LLC | 0 | -100,00 | 0 | -100,00 | ||||
| 2025-08-05 | 13F | Simplex Trading, Llc | 3.350 | 0 | ||||||
| 2025-05-09 | 13F | CoreCap Advisors, LLC | 0 | -100,00 | 0 | |||||
| 2025-07-17 | 13F | Janney Montgomery Scott LLC | 18.376 | -3,91 | 0 | |||||
| 2025-08-06 | 13F | AE Wealth Management LLC | 14.518 | 23,08 | 327 | 32,39 | ||||
| 2025-07-29 | 13F | International Assets Investment Management, Llc | 19.263 | -10,25 | 434 | -3,56 | ||||
| 2025-08-12 | 13F | Waterloo Capital, L.P. | 10.251 | 0,00 | 231 | 7,94 | ||||
| 2025-08-11 | 13F | Wealthspire Advisors, LLC | 23.804 | 1,04 | 537 | 8,50 | ||||
| 2025-05-16 | 13F/A | Kestra Investment Management, LLC | 0 | -100,00 | 0 | |||||
| 2025-05-15 | 13F | Gts Securities Llc | 0 | -100,00 | 0 | |||||
| 2025-08-11 | 13F | Principal Securities, Inc. | 87.453 | 2.387,99 | 1.972 | 2.638,89 | ||||
| 2025-08-14 | 13F | Qube Research & Technologies Ltd | 26.056 | -25,56 | 588 | -19,92 | ||||
| 2025-08-05 | 13F | GPS Wealth Strategies Group, LLC | 9 | 0,00 | 0 | |||||
| 2025-08-12 | 13F | Global Retirement Partners, LLC | 11.865 | 34,57 | 268 | 47,51 | ||||
| 2025-07-22 | 13F/A | Kingstone Capital Partners Texas, LLC | 10.899 | 2,01 | 246 | 9,82 | ||||
| 2025-08-14 | 13F | UBS Group AG | 54.948 | -86,16 | 1.239 | -85,11 | ||||
| 2025-08-28 | NP | BTSAX - BTS Managed Income Fund Class A Shares | 25.303 | 571 | ||||||
| 2025-07-18 | 13F | Truist Financial Corp | 0 | -100,00 | 0 | |||||
| 2025-04-29 | 13F | Wood Tarver Financial Group, LLC | 0 | -100,00 | 0 | |||||
| 2025-07-31 | 13F | Wealthfront Advisers Llc | 54.733 | 10,18 | 1.234 | 18,54 | ||||
| 2025-08-12 | 13F | Founders Financial Alliance, LLC | 19.717 | 3,93 | 445 | 11,84 | ||||
| 2025-07-25 | 13F | Cwm, Llc | 2.174 | 794,65 | 0 | |||||
| 2025-07-18 | 13F | PFG Investments, LLC | 24.146 | -0,15 | 544 | 7,30 | ||||
| 2025-07-21 | 13F | Crews Bank & Trust | 6.115 | 69,16 | 138 | 82,67 | ||||
| 2025-07-09 | 13F | Sterling Manor Financial, LLC | 14.333 | 323 | ||||||
| 2025-08-14 | 13F | Citadel Advisors Llc | Call | 0 | -100,00 | 0 | ||||
| 2025-08-14 | 13F | Citadel Advisors Llc | Put | 0 | -100,00 | 0 | ||||
| 2025-07-21 | 13F | Ameritas Advisory Services, LLC | 38.532 | 9,30 | 869 | 17,62 | ||||
| 2025-07-28 | 13F | Ckw Financial Group | 1.000 | 0,00 | 0 | |||||
| 2025-07-23 | 13F | Kingswood Wealth Advisors, Llc | 44.576 | 41,08 | 1.005 | 51,81 | ||||
| 2025-08-08 | 13F | SBI Securities Co., Ltd. | 44.841 | -0,29 | 1.011 | 7,21 | ||||
| 2025-08-14 | 13F | Raymond James Financial Inc | 81.692 | 2,99 | 1.842 | 10,76 | ||||
| 2025-08-08 | 13F | Financial Gravity Companies, Inc. | 666 | 0,00 | 15 | 15,38 | ||||
| 2025-08-08 | 13F | Cetera Investment Advisers | 103.842 | 18,89 | 2.342 | 27,85 | ||||
| 2025-08-04 | 13F | Kovack Advisors, Inc. | 15.562 | 20,77 | 351 | 29,63 | ||||
| 2025-08-08 | 13F | Fortis Group Advisors, LLC | 14.741 | 340 | ||||||
| 2025-08-08 | 13F | Advyzon Investment Management, LLC | 15.939 | -0,28 | 359 | 7,16 | ||||
| 2025-05-15 | 13F | Tower Research Capital LLC (TRC) | 0 | -100,00 | 0 | |||||
| 2025-08-14 | 13F/A | Rockefeller Capital Management L.P. | 23.428 | 3,12 | 528 | 10,92 | ||||
| 2025-07-10 | 13F | Signal Advisors Wealth, LLC | 528.346 | 723,03 | 11.914 | 785,14 | ||||
| 2025-07-09 | 13F | Triumph Capital Management | 41.074 | 1,22 | 926 | 8,94 | ||||
| 2025-08-13 | 13F | VestGen Advisors, LLC | 12.336 | 278 | ||||||
| 2025-07-08 | 13F | Parallel Advisors, LLC | 230 | 0,00 | 5 | 25,00 | ||||
| 2025-08-29 | 13F | Total Investment Management Inc | 1.506 | 34 | ||||||
| 2025-08-14 | 13F | Royal Bank Of Canada | 9.330 | 19,65 | 211 | 28,66 | ||||
| 2025-08-14 | 13F | Stifel Financial Corp | 14.316 | -2,77 | 323 | 4,55 | ||||
| 2025-08-19 | 13F | Newbridge Financial Services Group, Inc. | 129.172 | 4,19 | 2.913 | 12,04 | ||||
| 2025-08-08 | 13F | Pnc Financial Services Group, Inc. | 366 | 8 | ||||||
| 2025-08-18 | 13F | Geneos Wealth Management Inc. | 133 | 0,00 | 3 | 0,00 | ||||
| 2025-08-04 | 13F | Assetmark, Inc | 72 | 2 | ||||||
| 2025-08-12 | 13F | Jpmorgan Chase & Co | 86.471 | 10,58 | 1.950 | 18,91 | ||||
| 2025-09-04 | 13F/A | Advisor Group Holdings, Inc. | 200.139 | 12,36 | 4.515 | 20,82 | ||||
| 2025-07-10 | 13F | Wealth Enhancement Advisory Services, Llc | 87.521 | -0,24 | 2.002 | 8,81 | ||||
| 2025-08-05 | 13F | Strategic Financial Concepts, LLC | 52.265 | -2,43 | 1.179 | 4,90 | ||||
| 2025-08-14 | 13F | Wells Fargo & Company/mn | 149.778 | 15,17 | 3.377 | 23,84 | ||||
| 2025-05-05 | 13F | Hazlett, Burt & Watson, Inc. | 0 | -100,00 | 0 | |||||
| 2025-08-11 | 13F | Aptus Capital Advisors, LLC | 768 | 17 | ||||||
| 2025-07-22 | 13F | Foguth Wealth Management, LLC. | 536.276 | 735,39 | 12.093 | 798,44 | ||||
| 2025-08-04 | 13F | Spire Wealth Management | 0 | -100,00 | 0 | |||||
| 2025-08-11 | 13F | Tidemark, LLC | 0 | -100,00 | 0 | |||||
| 2025-08-12 | 13F | Proequities, Inc. | 0 | 0 | ||||||
| 2025-08-14 | 13F | Susquehanna International Group, Llp | Call | 29.300 | -42,88 | 661 | -38,60 | |||
| 2025-08-14 | 13F | Mariner, LLC | 9.558 | 216 | ||||||
| 2025-08-01 | 13F | Brookwood Investment Group LLC | 13.726 | 310 | ||||||
| 2025-08-13 | 13F | Northwestern Mutual Wealth Management Co | 23.010 | 106,29 | 519 | 122,32 | ||||
| 2025-08-14 | 13F | Sei Investments Co | 39.944 | 13,10 | 901 | 21,62 | ||||
| 2025-07-24 | 13F | IFP Advisors, Inc | 764 | 86,80 | 17 | 112,50 | ||||
| 2025-08-13 | 13F | Flow Traders U.s. Llc | 0 | -100,00 | 0 | |||||
| 2025-08-14 | 13F | Susquehanna International Group, Llp | Put | 9.200 | -14,81 | 207 | -8,41 | |||
| 2025-08-28 | NP | TFAFX - Tactical Growth Allocation Fund Class I | 2.646 | 60 | ||||||
| 2025-08-14 | 13F | Susquehanna International Group, Llp | 138.100 | 16,44 | 3.114 | 25,21 | ||||
| 2025-08-15 | 13F | Kestra Advisory Services, LLC | 22.805 | 82,57 | 514 | 96,93 | ||||
| 2025-07-17 | 13F | Fifth Third Securities, Inc. | 97.389 | -9,96 | 2.196 | -3,17 | ||||
| 2025-08-05 | 13F | Dunhill Financial, LLC | 1.683 | 38 | ||||||
| 2025-08-12 | 13F | Deutsche Bank Ag\ | 1 | 0 | ||||||
| 2025-07-16 | 13F | Strategic Investment Solutions, Inc. /IL | 150 | 3 | ||||||
| 2025-07-11 | 13F | Farther Finance Advisors, LLC | 3.063 | 2,07 | 69 | 9,52 | ||||
| 2025-04-25 | 13F | New Wave Wealth Advisors Llc | 0 | -100,00 | 0 | |||||
| 2025-07-30 | 13F | BTS Asset Management, Inc. | 26.802 | 604 | ||||||
| 2025-08-14 | 13F | Fmr Llc | 526 | 497,73 | 12 | 1.000,00 | ||||
| 2025-07-31 | 13F | Optimum Investment Advisors | 1.000 | 0,00 | 23 | 10,00 | ||||
| 2025-08-11 | 13F | HighTower Advisors, LLC | 25.247 | -0,30 | 569 | 7,16 | ||||
| 2025-08-12 | 13F | MAI Capital Management | 2.050 | 51.150,00 | 46 | |||||
| 2025-07-28 | 13F | Harbour Investments, Inc. | 5.474 | 0,00 | 123 | 7,89 | ||||
| 2025-08-14 | 13F | Comerica Bank | 178 | 20,27 | 4 | 33,33 | ||||
| 2025-08-06 | 13F | Commonwealth Equity Services, Llc | 38.070 | 35,53 | 1 | |||||
| 2025-08-18 | 13F/A | National Bank Of Canada /fi/ | 15.000 | 0,00 | 325 | 6,56 | ||||
| 2025-08-13 | 13F | SageView Advisory Group, LLC | 11.762 | -9,66 | 278 | 1,47 | ||||
| 2025-08-13 | 13F | M Holdings Securities, Inc. | 17.433 | 0 | ||||||
| 2025-07-08 | 13F | Goldstone Financial Group, LLC | 44.451 | -1,34 | 1.017 | 7,63 | ||||
| 2025-08-11 | 13F | Citigroup Inc | 400 | 0,00 | 9 | 12,50 | ||||
| 2025-08-14 | 13F | Mml Investors Services, Llc | 26.894 | 111,20 | 1 | |||||
| 2025-07-21 | 13F | Ameriflex Group, Inc. | 0 | -100,00 | 0 | |||||
| 2025-08-06 | 13F | Prospera Financial Services Inc | 23.242 | 14,07 | 524 | 22,72 | ||||
| 2025-08-11 | 13F | Western Wealth Management, LLC | 15.714 | -12,28 | 354 | -5,60 | ||||
| 2025-08-14 | 13F | GWM Advisors LLC | 75.791 | 7,48 | 1.709 | 15,63 | ||||
| 2025-08-05 | 13F | Westside Investment Management, Inc. | 1.000 | 0,00 | 23 | 10,00 | ||||
| 2025-07-29 | 13F | Private Trust Co Na | 1.166 | 0,00 | 26 | 8,33 | ||||
| 2025-08-14 | 13F | Ameriprise Financial Inc | 75.794 | 18,62 | 1.709 | 27,63 | ||||
| 2025-07-16 | 13F | ORG Partners LLC | 0 | -100,00 | 0 | |||||
| 2025-08-12 | 13F | LPL Financial LLC | 808.842 | 6,79 | 18.239 | 14,84 | ||||
| 2025-08-08 | 13F | Good Life Advisors, LLC | 18.263 | 3,76 | 412 | 11,38 | ||||
| 2025-08-01 | 13F | Howard Capital Management Inc. | 681.750 | 15.373 | ||||||
| 2025-07-21 | 13F | Synergy Financial Management, LLC | 87.496 | 1.973 | ||||||
| 2025-04-30 | 13F | Sofos Investments, Inc. | 666 | 0,00 | 14 | -7,14 | ||||
| 2025-07-18 | 13F | Bartlett & Co. Wealth Management Llc | 0 | -100,00 | 0 | |||||
| 2025-08-01 | 13F | Envestnet Asset Management Inc | 64.381 | 3,72 | 1.452 | 11,53 | ||||
| 2025-08-13 | 13F | Capital Analysts, Inc. | 266 | 0,00 | 0 | |||||
| 2025-07-25 | 13F | Atria Wealth Solutions, Inc. | 9.467 | -25,58 | 214 | -19,55 | ||||
| 2025-08-19 | 13F | Cape Investment Advisory, Inc. | 1.000 | 23 | ||||||
| 2025-05-12 | 13F | Sandy Spring Bank | 230 | 0,00 | 5 | 0,00 | ||||
| 2025-08-14 | 13F | Federation des caisses Desjardins du Quebec | 685 | -16,05 | 15 | -11,76 | ||||
| 2025-07-30 | NP | ORR - Militia Long/Short Equity ETF | Short | -432.409 | -9.310 | |||||
| 2025-07-08 | 13F | Nbc Securities, Inc. | 75 | 0,00 | 0 | |||||
| 2025-05-09 | 13F | GeoWealth Management, LLC | 0 | -100,00 | 0 | -100,00 | ||||
| 2025-07-21 | 13F | Mirae Asset Global Investments Co., Ltd. | 3.800 | 86 | ||||||
| 2025-05-14 | 13F | Gould Capital, LLC | 0 | -100,00 | 0 | |||||
| 2025-08-07 | 13F | Allworth Financial LP | 112 | 0,00 | 3 | 0,00 | ||||
| 2025-08-13 | 13F | Jones Financial Companies Lllp | 35.893 | 56,29 | 803 | 66,25 | ||||
| 2025-08-15 | 13F | Morgan Stanley | 580.719 | 1,80 | 13.095 | 9,48 |