Grundlæggende statistik
| Institutionelle ejere | 67 total, 67 long only, 0 short only, 0 long/short - change of 0,00% MRQ |
| Gennemsnitlig porteføljeallokering | 0.1795 % - change of 5,72% MRQ |
| Institutionelle aktier (lange) | 968.373 (ex 13D/G) - change of -0,01MM shares -1,16% MRQ |
| Institutionel værdi (lang) | $ 112.715 USD ($1000) |
Institutionelt ejerskab og aktionærer
Invesco Exchange-Traded Fund Trust - Invesco S&P SmallCap 600 Pure Value ETF (US:RZV) har 67 institutionelle ejere og aktionærer, der har indsendt 13D/G- eller 13F-formularer til Securities Exchange Commission (SEC). Disse institutioner har i alt 968,373 aktier. Største aktionærer omfatter Systematic Alpha Investments, LLC, Wealthcare Advisory Partners LLC, LPL Financial LLC, AllSquare Wealth Management LLC, Armbruster Capital Management, Inc., IMC-Chicago, LLC, Bank Of America Corp /de/, Theory Financial Llc, Goldman Sachs Group Inc, and Morgan Stanley .
Invesco Exchange-Traded Fund Trust - Invesco S&P SmallCap 600 Pure Value ETF (ARCA:RZV) institutionel ejerskabsstruktur viser aktuelle positioner i virksomheden efter institutioner og fonde, samt seneste ændringer i positionsstørrelse. Større aktionærer kan omfatte individuelle investorer, investeringsforeninger, hedgefonde eller institutioner. Skema 13D angiver, at investoren besidder (eller besidder) mere end 5 % af virksomheden og har til hensigt (eller har til hensigt at) aktivt at forfølge en ændring i forretningsstrategi. Skema 13G indikerer en passiv investering på over 5%.
The share price as of March 24, 2026 is 123,72 / share. Previously, on March 25, 2025, the share price was 100,94 / share. This represents an increase of 22,57% over that period.

Fondens stemningsscore
Fund Sentiment Score (fka Ownership Accumulation Score) finder de aktier, der bliver mest købt af fonde. Det er resultatet af en sofistikeret, multi-faktor kvantitativ model, der identificerer virksomheder med de højeste niveauer af institutionel akkumulering. Scoringsmodellen bruger en kombination af den samlede stigning i oplyste ejere, ændringerne i porteføljeallokeringer i disse ejere og andre målinger. Tallet går fra 0 til 100, hvor højere tal indikerer et højere niveau af akkumulering for sine jævnaldrende, og 50 er gennemsnittet.
Opdateringsfrekvens: Dagligt
Se Ownership Explorer, som giver en liste over højest rangerende virksomheder.
AI+ Ask Fintel’s AI assistant about Invesco Exchange-Traded Fund Trust - Invesco S&P SmallCap 600 Pure Value ETF.
Select a question to share a public post with an AI-crafted answer.
Thinking of good questions…
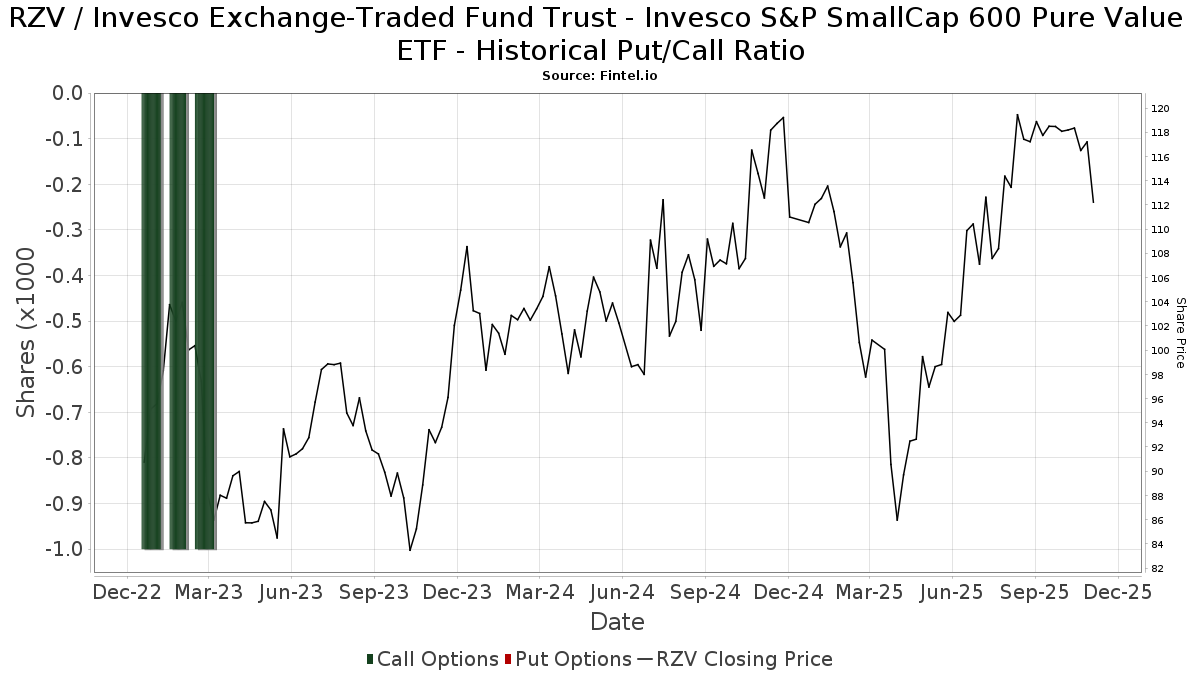
Institutionel Put/Call-forhold
Ud over at indberette standardaktie- og gældsudstedelser skal institutter med mere end 100 mill. aktiver under forvaltning også oplyse deres put- og call-optionsbeholdninger. Da salgsoptioner generelt indikerer negativ stemning, og købsoptioner indikerer positiv stemning, kan vi få en fornemmelse af den overordnede institutionelle stemning ved at plotte forholdet mellem put og kald. Diagrammet til højre viser det historiske put/call-forhold for dette instrument.
Brug af Put/Call Ratio som en indikator for investorernes stemning overvinder en af de vigtigste mangler ved at bruge totalt institutionelt ejerskab, som er, at en betydelig mængde af aktiver under forvaltning investeres passivt for at spore indekser. Passivt forvaltede fonde køber typisk ikke optioner, så indikatoren for put/call-forholdet følger mere nøje følelsen af aktivt forvaltede fonde.
13F og NPORT arkivering
Detaljer om 13F-arkivering er gratis. Detaljer om NP-ansøgninger kræver et premium-medlemskab. Grønne rækker angiver nye positioner. Røde rækker angiver lukkede positioner. Klik på linket ikon for at se den fulde transaktionshistorik.
Opgrader
for at låse premium-data op og eksportere til Excel ![]() .
.
| Fil dato | Kilde | Investor | Type | Gennemsnitlig pris (Øst) |
Aktier | Δ Aktier (%) |
Rapporteret Værdi ($1000) |
Δ Værdi (%) |
Port Alloc (%) |
|
|---|---|---|---|---|---|---|---|---|---|---|
| 2026-01-14 | 13F | Worth Asset Management, LLC | 2.302 | -25,24 | 274 | -24,79 | ||||
| 2026-01-14 | 13F | Wealthcare Advisory Partners LLC | 73.979 | 1,50 | 8.798 | 2,26 | ||||
| 2026-01-23 | 13F | Valley National Advisers Inc | 222 | 0,00 | 0 | |||||
| 2026-02-05 | 13F | Allworth Financial LP | 1.200 | 0,00 | 143 | 0,71 | ||||
| 2025-11-12 | 13F | Transce3nd, LLC | 0 | -100,00 | 0 | |||||
| 2025-11-14 | 13F | Raymond James Financial Inc | 0 | -100,00 | 0 | |||||
| 2025-11-06 | 13F | CBIZ Investment Advisory Services, LLC | 0 | -100,00 | 0 | |||||
| 2026-02-17 | 13F | IHT Wealth Management, LLC | 0 | -100,00 | 0 | |||||
| 2026-02-06 | 13F | Global Retirement Partners, LLC | 282 | 0,00 | 34 | 0,00 | ||||
| 2026-02-17 | 13F | Jones Financial Companies Lllp | 2.260 | 155,37 | 269 | 157,69 | ||||
| 2026-01-23 | 13F | Fifth Third Securities, Inc. | 5.701 | 0,00 | 678 | 0,74 | ||||
| 2026-02-06 | 13F | Fortis Group Advisors, LLC | 9.067 | 1.166 | ||||||
| 2026-02-17 | 13F | Bank Of America Corp /de/ | 33.362 | 1,83 | 3.967 | 2,59 | ||||
| 2026-03-02 | 13F | Sankala Group LLC | 3 | 0 | ||||||
| 2026-01-12 | 13F | Focus Financial Network, Inc. | 2.094 | -0,29 | 249 | 0,81 | ||||
| 2026-01-29 | 13F | IMC-Chicago, LLC | 43.326 | 5.152 | ||||||
| 2026-01-23 | 13F | Farther Finance Advisors, LLC | 191 | 158,11 | 23 | 175,00 | ||||
| 2026-02-17 | 13F | Royal Bank Of Canada | 9.663 | -0,17 | 1.149 | 0,52 | ||||
| 2026-01-23 | 13F | Armbruster Capital Management, Inc. | 65.922 | -3,96 | 7.840 | -3,25 | ||||
| 2026-02-05 | 13F | Cambridge Investment Research Advisors, Inc. | 2.847 | 0,00 | 0 | |||||
| 2026-02-12 | 13F | Steward Partners Investment Advisory, Llc | 128 | 0,00 | 15 | 0,00 | ||||
| 2026-02-17 | 13F | Advisor Group Holdings, Inc. | 5.529 | -25,74 | 658 | -25,34 | ||||
| 2026-02-06 | 13F | IFP Advisors, Inc | 3.523 | 0,00 | 419 | 0,72 | ||||
| 2026-02-11 | 13F | Janney Montgomery Scott LLC | 2.463 | 0,00 | 0 | |||||
| 2026-02-11 | 13F | Simplex Trading, Llc | 0 | -100,00 | 0 | |||||
| 2026-01-26 | 13F | Discipline Wealth Solutions, LLC | 8.071 | -7,65 | 960 | -6,98 | ||||
| 2026-01-20 | 13F | Trust Co Of Toledo Na /oh/ | 231 | 0,00 | 27 | 0,00 | ||||
| 2026-02-10 | 13F | Theory Financial Llc | 28.319 | -9,78 | 3.645 | -1,41 | ||||
| 2026-02-17 | 13F | Cetera Investment Advisers | 4.624 | -16,95 | 550 | -16,44 | ||||
| 2026-02-12 | 13F | Commonwealth Equity Services, Llc | 12.594 | 2,76 | 1.498 | 149.600,00 | ||||
| 2026-01-30 | 13F | Jackson Hole Capital Partners, LLC | 458 | 0,00 | 54 | 0,00 | ||||
| 2026-02-13 | 13F | Morgan Stanley | 18.679 | -1,70 | 2.221 | -0,98 | ||||
| 2026-01-15 | 13F | Private Advisory Group LLC | 2.709 | 0,00 | 322 | 0,94 | ||||
| 2026-01-13 | 13F | CoreCap Advisors, LLC | 176 | 21 | ||||||
| 2026-01-26 | 13F | Merit Financial Group, LLC | 14.870 | -8,41 | 1.768 | -7,72 | ||||
| 2026-02-12 | 13F | Principal Securities, Inc. | 0 | -100,00 | 0 | |||||
| 2026-01-29 | 13F | Concord Wealth Partners | 276 | 0,00 | 33 | 0,00 | ||||
| 2026-02-17 | 13F | Fmr Llc | 126 | -30,00 | 15 | -33,33 | ||||
| 2025-11-14 | 13F/A | NorthRock Partners, LLC | 0 | -100,00 | 0 | |||||
| 2026-02-10 | 13F/A | Northwestern Mutual Wealth Management Co | 4.776 | 8,35 | 568 | 9,23 | ||||
| 2026-02-11 | 13F | LPL Financial LLC | 71.170 | -24,32 | 8.464 | -23,76 | ||||
| 2026-02-17 | 13F | Captrust Financial Advisors | 10.527 | 0,00 | 1.252 | 0,72 | ||||
| 2026-02-09 | 13F | Keating Financial Advisory Services, Inc. | 277 | 33 | ||||||
| 2026-02-13 | 13F | Gts Securities Llc | 0 | -100,00 | 0 | |||||
| 2026-02-14 | 13F | Rockefeller Capital Management L.P. | 200 | 0,00 | 24 | 0,00 | ||||
| 2026-02-04 | 13F | American Institute for Advanced Investment Management, LLP | 5.760 | -1,79 | 685 | -1,16 | ||||
| 2026-01-23 | 13F | Smallwood Wealth Investment Management, LLC | 15.439 | 0,18 | 1.836 | 0,93 | ||||
| 2026-02-17 | 13F | Creative Planning | 4.370 | 0,28 | 520 | 0,97 | ||||
| 2026-01-28 | 13F | Geneos Wealth Management Inc. | 200 | 0,00 | 24 | 0,00 | ||||
| 2026-01-29 | 13F | UBS Group AG | 12.134 | -25,05 | 1.443 | -24,49 | ||||
| 2026-01-20 | 13F | Stratos Wealth Partners, LTD. | 8.492 | 2,19 | 1.010 | 2,85 | ||||
| 2026-02-17 | 13F | Susquehanna International Group, Llp | 5.587 | -53,85 | 664 | -53,50 | ||||
| 2025-11-12 | 13F | Buckingham Strategic Partners | 0 | -100,00 | 0 | |||||
| 2026-01-12 | 13F | AllSquare Wealth Management LLC | 69.049 | -0,17 | 8.150 | 12,48 | ||||
| 2026-02-09 | 13F | Choate Investment Advisors | 0 | -100,00 | 0 | |||||
| 2026-01-12 | 13F | Ayalon Holdings Ltd. | 7.023 | 0,00 | 1 | |||||
| 2026-01-23 | 13F | Lester Murray Antman dba SimplyRich | 8.521 | -0,54 | 1 | 0,00 | ||||
| 2026-02-12 | 13F | Systematic Alpha Investments, LLC | 306.488 | 0,00 | 36.449 | 0,75 | ||||
| 2026-02-17 | 13F | Aqr Capital Management Llc | 1.804 | -1,96 | 215 | -1,38 | ||||
| 2025-11-26 | 13F/A | Jpmorgan Chase & Co | 102 | 12 | ||||||
| 2026-02-17 | 13F | Cardiff Park Advisors, Llc | 0 | -100,00 | 0 | |||||
| 2026-02-06 | 13F | HighTower Advisors, LLC | 1.774 | -21,12 | 211 | -20,38 | ||||
| 2026-02-10 | 13F | Goldman Sachs Group Inc | 19.444 | 19,27 | 2.312 | 20,17 | ||||
| 2026-01-21 | 13F | Flagship Harbor Advisors, Llc | 1.437 | 171 | ||||||
| 2026-02-13 | 13F | Ubs Asset Management Americas Inc | 103 | 12 | ||||||
| 2026-02-11 | 13F | Greykasell Wealth Strategies, Inc. | 200 | 24 | ||||||
| 2026-02-13 | 13F | Wells Fargo & Company/mn | 4.202 | -4,46 | 500 | -3,85 | ||||
| 2026-01-20 | 13F | Ntv Asset Management Llc | 12.650 | -11,82 | 1.504 | -11,16 | ||||
| 2026-02-13 | 13F | Stifel Financial Corp | 9.960 | -0,06 | 1.184 | 0,68 | ||||
| 2026-01-23 | 13F | Twelve Points Wealth Management LLC | 3.830 | -8,04 | 488 | -0,61 | ||||
| 2026-02-13 | 13F | Kestra Advisory Services, LLC | 281 | 33 | ||||||
| 2026-02-17 | 13F | Citadel Advisors Llc | 4.818 | -17,88 | 573 | -17,34 | ||||
| 2026-01-23 | 13F | Ogorek Anthony Joseph /ny/ /adv | 0 | 0 | ||||||
| 2026-02-04 | 13F | Ameritas Advisory Services, LLC | 0 | -100,00 | 0 | |||||
| 2026-02-10 | 13F | Envestnet Asset Management Inc | 1.998 | -21,77 | 238 | -21,26 | ||||
| 2026-01-23 | 13F | LOM Asset Management Ltd | 2.300 | 20,73 | 274 | 21,33 | ||||
| 2026-02-13 | 13F | Mml Investors Services, Llc | 3.593 | 6,33 | 427 | 7,29 | ||||
| 2026-01-07 | 13F | Innova Wealth Partners | 7.820 | 1,18 | 930 | 1,86 | ||||
| 2026-01-26 | 13F | Cwm, Llc | 2.047 | 9,64 | 0 | |||||
| 2026-02-02 | 13F | Benjamin Edwards Inc | 0 | -100,00 | 0 | |||||
| 2026-02-17 | 13F | Two Sigma Investments, Lp | 4.800 | 571 | ||||||
| 2025-10-24 | 13F | Bristlecone Advisors, LLC | 0 | -100,00 | 0 |