Grundlæggende statistik
| Institutionelle ejere | 72 total, 71 long only, 0 short only, 1 long/short - change of 1,39% MRQ |
| Gennemsnitlig porteføljeallokering | 0.0513 % - change of 13,13% MRQ |
| Institutionelle aktier (lange) | 375.051 (ex 13D/G) - change of -0,01MM shares -2,19% MRQ |
| Institutionel værdi (lang) | $ 92.149 USD ($1000) |
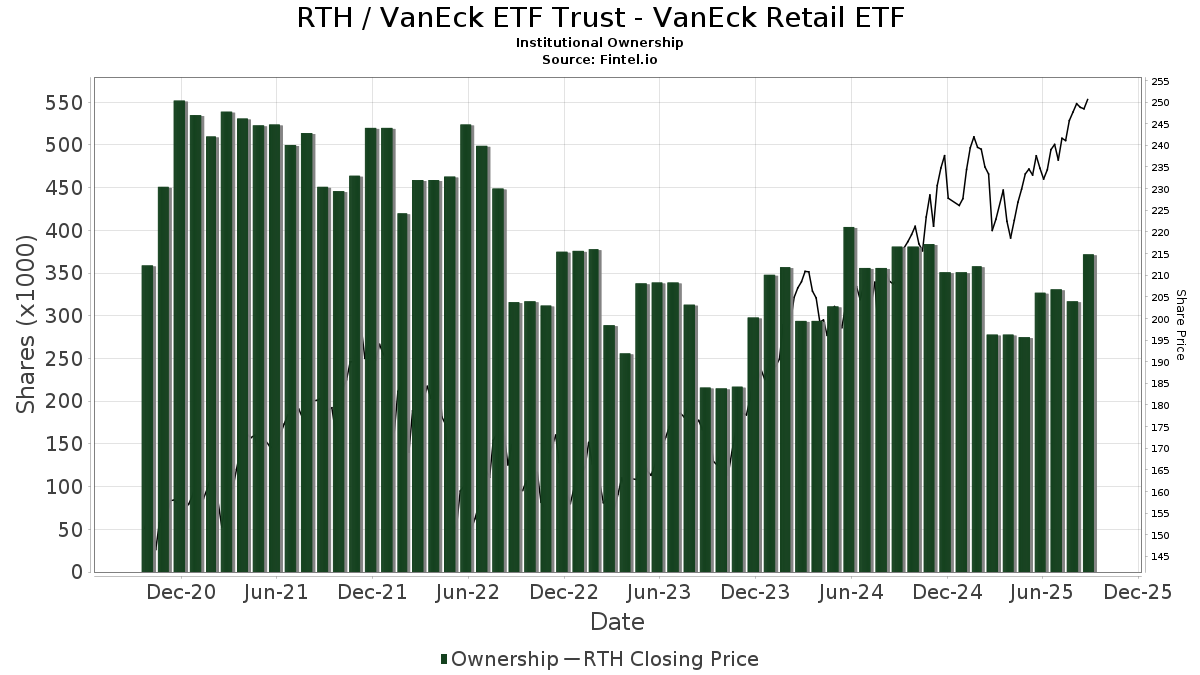
Institutionelt ejerskab og aktionærer
VanEck ETF Trust - VanEck Retail ETF (US:RTH) har 72 institutionelle ejere og aktionærer, der har indsendt 13D/G- eller 13F-formularer til Securities Exchange Commission (SEC). Disse institutioner har i alt 375,051 aktier. Største aktionærer omfatter LPL Financial LLC, Bank Of America Corp /de/, Equitable Holdings, Inc., Cetera Investment Advisers, Jpmorgan Chase & Co, Advisor Group Holdings, Inc., GWM Advisors LLC, JBR Co Financial Management Inc, Great Diamond Partners, LLC, and Northwestern Mutual Wealth Management Co .
VanEck ETF Trust - VanEck Retail ETF (NasdaqGM:RTH) institutionel ejerskabsstruktur viser aktuelle positioner i virksomheden efter institutioner og fonde, samt seneste ændringer i positionsstørrelse. Større aktionærer kan omfatte individuelle investorer, investeringsforeninger, hedgefonde eller institutioner. Skema 13D angiver, at investoren besidder (eller besidder) mere end 5 % af virksomheden og har til hensigt (eller har til hensigt at) aktivt at forfølge en ændring i forretningsstrategi. Skema 13G indikerer en passiv investering på over 5%.
The share price as of March 9, 2026 is 260,64 / share. Previously, on March 10, 2025, the share price was 225,17 / share. This represents an increase of 15,75% over that period.
Fondens stemningsscore
Fund Sentiment Score (fka Ownership Accumulation Score) finder de aktier, der bliver mest købt af fonde. Det er resultatet af en sofistikeret, multi-faktor kvantitativ model, der identificerer virksomheder med de højeste niveauer af institutionel akkumulering. Scoringsmodellen bruger en kombination af den samlede stigning i oplyste ejere, ændringerne i porteføljeallokeringer i disse ejere og andre målinger. Tallet går fra 0 til 100, hvor højere tal indikerer et højere niveau af akkumulering for sine jævnaldrende, og 50 er gennemsnittet.
Opdateringsfrekvens: Dagligt
Se Ownership Explorer, som giver en liste over højest rangerende virksomheder.
AI+ Ask Fintel’s AI assistant about VanEck ETF Trust - VanEck Retail ETF.
Select a question to share a public post with an AI-crafted answer.
Thinking of good questions…
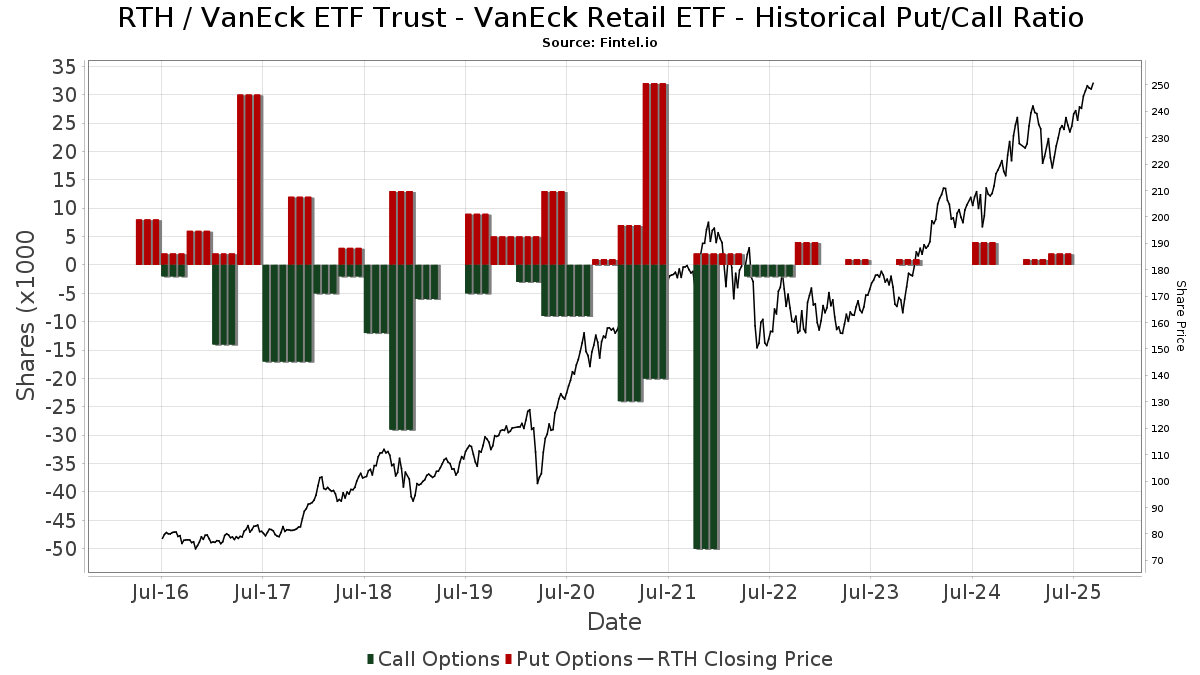
Institutionel Put/Call-forhold
Ud over at indberette standardaktie- og gældsudstedelser skal institutter med mere end 100 mill. aktiver under forvaltning også oplyse deres put- og call-optionsbeholdninger. Da salgsoptioner generelt indikerer negativ stemning, og købsoptioner indikerer positiv stemning, kan vi få en fornemmelse af den overordnede institutionelle stemning ved at plotte forholdet mellem put og kald. Diagrammet til højre viser det historiske put/call-forhold for dette instrument.
Brug af Put/Call Ratio som en indikator for investorernes stemning overvinder en af de vigtigste mangler ved at bruge totalt institutionelt ejerskab, som er, at en betydelig mængde af aktiver under forvaltning investeres passivt for at spore indekser. Passivt forvaltede fonde køber typisk ikke optioner, så indikatoren for put/call-forholdet følger mere nøje følelsen af aktivt forvaltede fonde.
13F og NPORT arkivering
Detaljer om 13F-arkivering er gratis. Detaljer om NP-ansøgninger kræver et premium-medlemskab. Grønne rækker angiver nye positioner. Røde rækker angiver lukkede positioner. Klik på linket ikon for at se den fulde transaktionshistorik.
Opgrader
for at låse premium-data op og eksportere til Excel ![]() .
.
| Fil dato | Kilde | Investor | Type | Gennemsnitlig pris (Øst) |
Aktier | Δ Aktier (%) |
Rapporteret Værdi ($1000) |
Δ Værdi (%) |
Port Alloc (%) |
|
|---|---|---|---|---|---|---|---|---|---|---|
| 2026-01-06 | 13F | JBR Co Financial Management Inc | 10.523 | 9,32 | 2.626 | 8,70 | ||||
| 2026-02-10 | 13F | Goldman Sachs Group Inc | 2.320 | -66,29 | 579 | -66,51 | ||||
| 2026-02-02 | 13F | Truist Financial Corp | 967 | -0,21 | 241 | -0,82 | ||||
| 2026-02-13 | 13F | Wells Fargo & Company/mn | 1 | 0,00 | 0 | |||||
| 2026-02-12 | 13F | Steward Partners Investment Advisory, Llc | 165 | 30,95 | 41 | 32,26 | ||||
| 2026-01-27 | 13F | Belpointe Asset Management LLC | 3.871 | 0,89 | 966 | 0,31 | ||||
| 2026-02-11 | 13F | Capital Analysts, Inc. | 10 | 0,00 | 0 | |||||
| 2026-02-12 | 13F | Principal Securities, Inc. | 0 | -100,00 | 0 | |||||
| 2026-02-14 | 13F | Rockefeller Capital Management L.P. | 100 | 25 | ||||||
| 2026-02-17 | 13F | Russell Investments Group, Ltd. | 94 | 23 | ||||||
| 2026-01-29 | 13F | Nbc Securities, Inc. | 505 | 0,00 | 126 | -0,79 | ||||
| 2026-01-29 | 13F | UBS Group AG | 1.824 | -72,42 | 455 | -72,57 | ||||
| 2026-01-08 | 13F | Maridea Wealth Management LLC | 1.663 | 65,80 | 415 | 66,27 | ||||
| 2026-02-06 | 13F | IFP Advisors, Inc | 33 | 0,00 | 8 | 0,00 | ||||
| 2025-11-14 | 13F | Jane Street Group, Llc | 0 | -100,00 | 0 | |||||
| 2026-01-06 | 13F | Investors Research Corp | 377 | 0,00 | 94 | 0,00 | ||||
| 2026-01-23 | 13F | Optima Capital Llc | 58 | -98,05 | 14 | -98,12 | ||||
| 2025-10-27 | 13F | Belvedere Trading LLC | Put | 0 | -100,00 | 0 | ||||
| 2026-02-05 | 13F | Cambridge Investment Research Advisors, Inc. | 2.448 | 7,79 | 1 | |||||
| 2026-02-11 | 13F | Janney Montgomery Scott LLC | 1.215 | 0,00 | 0 | |||||
| 2026-02-10 | 13F/A | Northwestern Mutual Wealth Management Co | 8.701 | 15,95 | 2.171 | 15,30 | ||||
| 2026-02-13 | 13F | Wbi Investments, Inc. | 7.105 | 33,28 | 1.773 | 32,54 | ||||
| 2026-01-05 | 13F | Park Avenue Securities Llc | 0 | -100,00 | 0 | |||||
| 2026-02-13 | 13F | SRS Capital Advisors, Inc. | 70 | 0,00 | 17 | 0,00 | ||||
| 2025-11-26 | 13F/A | Jpmorgan Chase & Co | 20.753 | 3,77 | 5.207 | 9,07 | ||||
| 2026-01-14 | 13F | Nova Wealth Management, Inc. | 40 | 0,00 | 10 | -10,00 | ||||
| 2026-01-26 | 13F | AE Wealth Management LLC | 1.861 | 16,39 | 464 | 15,71 | ||||
| 2026-01-07 | 13F | Central Pacific Bank - Trust Division | 9 | 0,00 | 2 | 0,00 | ||||
| 2025-11-14 | 13F | Old Mission Capital Llc | 0 | -100,00 | 0 | -100,00 | ||||
| 2026-02-13 | 13F | Luminist Capital LLC | 3 | 0,00 | 1 | |||||
| 2026-02-17 | 13F | Susquehanna International Group, Llp | Put | 1.100 | 274 | |||||
| 2026-02-09 | 13F | Harbour Investments, Inc. | 877 | 0,11 | 219 | -0,46 | ||||
| 2026-02-12 | 13F | Investor's Fiduciary Advisor Network, LLC | 910 | 0,00 | 0 | |||||
| 2026-02-13 | 13F | Kestra Advisory Services, LLC | 593 | 148 | ||||||
| 2026-02-13 | 13F | Mml Investors Services, Llc | 5.196 | 19,78 | 1.296 | 19,12 | ||||
| 2026-02-13 | 13F | Golden State Wealth Management, LLC | 6 | 0,00 | 1 | 0,00 | ||||
| 2026-01-21 | 13F | Sound Income Strategies, LLC | 39 | 10 | ||||||
| 2026-02-11 | 13F | Simplex Trading, Llc | 0 | -100,00 | 0 | |||||
| 2026-02-13 | 13F | Morgan Stanley | 4.024 | -1,32 | 1.004 | -1,86 | ||||
| 2026-02-17 | 13F | Asset One Wealth Management LLC | 838 | 222 | ||||||
| 2026-02-13 | 13F | Ausdal Financial Partners, Inc. | 0 | -100,00 | 0 | |||||
| 2026-02-17 | 13F | Susquehanna International Group, Llp | 1.960 | -30,00 | 489 | -30,34 | ||||
| 2026-02-17 | 13F | Susquehanna International Group, Llp | Call | 0 | -100,00 | 0 | ||||
| 2026-02-12 | 13F | Beacon Capital Management, Inc. | 0 | -100,00 | 0 | |||||
| 2026-02-06 | 13F | Global Retirement Partners, LLC | 30 | 0,00 | 8 | 0,00 | ||||
| 2026-02-02 | 13F | CX Institutional | 1.178 | -2,81 | 0 | |||||
| 2026-02-10 | 13F | CIBC World Markets Inc. | 3.886 | 970 | ||||||
| 2026-02-09 | 13F | Kingsview Wealth Management, LLC | 1.726 | 0,00 | 431 | -0,69 | ||||
| 2026-02-09 | 13F | Integrity Alliance, Llc. | 3.119 | 12,28 | 778 | 11,78 | ||||
| 2026-02-17 | 13F | Modern Wealth Management, LLC | 1.625 | -31,87 | 405 | -32,27 | ||||
| 2026-01-26 | 13F | Keystone Wealth Services, LLC | 3.648 | 13,57 | 910 | 13,04 | ||||
| 2026-02-06 | 13F | HighTower Advisors, LLC | 1.170 | -1,27 | 292 | -1,68 | ||||
| 2026-02-06 | 13F | Pnc Financial Services Group, Inc. | 262 | 0,00 | 65 | 0,00 | ||||
| 2026-02-03 | 13F | SBI Securities Co., Ltd. | 2 | 0,00 | 0 | |||||
| 2026-02-17 | 13F | Citadel Advisors Llc | 6.208 | -24,26 | 1.549 | -24,71 | ||||
| 2026-02-17 | 13F | Qube Research & Technologies Ltd | 23 | 0,00 | 6 | 0,00 | ||||
| 2025-11-04 | 13F | Guerra Advisors Inc | 6.030 | 1.513 | ||||||
| 2026-02-04 | 13F | Ameritas Advisory Services, LLC | 0 | -100,00 | 0 | |||||
| 2026-02-17 | 13F | Fmr Llc | 1.538 | -7,18 | 384 | -7,71 | ||||
| 2026-02-17 | 13F | Cetera Investment Advisers | 21.029 | 14,53 | 5.247 | 13,89 | ||||
| 2026-02-11 | 13F | LPL Financial LLC | 90.100 | -5,08 | 22.480 | -5,61 | ||||
| 2026-02-11 | 13F | Sunrise Financial Services, LLC | 158 | 39 | ||||||
| 2026-02-17 | 13F | Creative Planning | 5.682 | -23,12 | 1.418 | -23,57 | ||||
| 2026-02-18 | 13F | GWM Advisors LLC | 14.622 | 10,46 | 3.648 | 9,85 | ||||
| 2026-02-17 | 13F | Jones Financial Companies Lllp | 1.452 | 5,45 | 362 | 5,54 | ||||
| 2026-02-23 | 13F | Monetary Solutions, Ltd | 1.495 | 373 | ||||||
| 2026-02-17 | 13F | Bank Of America Corp /de/ | 56.028 | 24,34 | 13.979 | 23,64 | ||||
| 2026-02-17 | 13F | Royal Bank Of Canada | 1.493 | -71,62 | 372 | -71,82 | ||||
| 2026-01-26 | 13F | Cwm, Llc | 24 | 0,00 | 0 | |||||
| 2026-02-17 | 13F | Raymond James Financial Inc | 1.993 | 5,39 | 497 | 4,85 | ||||
| 2026-02-17 | 13F | Equitable Holdings, Inc. | 28.472 | 4,27 | 7.104 | 3,69 | ||||
| 2026-02-17 | 13F | Private Advisor Group, LLC | 1.786 | 33,78 | 446 | 33,23 | ||||
| 2026-02-09 | 13F | Huntington National Bank | 0 | |||||||
| 2026-03-06 | 13F | Union Savings Bank | 200 | 0,00 | 50 | 2,08 | ||||
| 2026-02-10 | 13F | Envestnet Asset Management Inc | 5.702 | 6,26 | 1.423 | 5,65 | ||||
| 2026-01-23 | 13F | Assetmark, Inc | 14 | 0,00 | 3 | 0,00 | ||||
| 2026-01-29 | 13F | Kestra Private Wealth Services, Llc | 3.035 | 6,27 | 757 | 5,73 | ||||
| 2026-02-17 | 13F | Advisor Group Holdings, Inc. | 16.726 | -10,29 | 4.174 | -9,91 | ||||
| 2026-02-12 | 13F | Bank Of Montreal /can/ | 25 | 6 | ||||||
| 2026-02-13 | 13F | Stifel Financial Corp | 2.384 | -1,16 | 595 | -1,82 | ||||
| 2025-11-12 | 13F | Bright Futures Wealth Management, LLC. | 0 | -100,00 | 0 | |||||
| 2026-02-04 | 13F | Money Concepts Capital Corp | 3.156 | 0,99 | 787 | 0,38 | ||||
| 2026-02-17 | 13F | Strive Financial Group ,LLC | 320 | 80 | ||||||
| 2026-02-06 | 13F | Great Diamond Partners, LLC | 9.546 | 1,67 | 2.382 | 1,10 | ||||
| 2026-02-06 | 13F | Larson Financial Group LLC | 5 | 0,00 | 1 | 0,00 | ||||
| 2026-02-13 | 13F | Bay Colony Advisory Group, Inc d/b/a Bay Colony Advisors | 0 | -100,00 | 0 | -100,00 | ||||
| 2026-02-17 | 13F | Tower Research Capital LLC (TRC) | 0 | -100,00 | 0 |