Grundlæggende statistik
| Institutionelle ejere | 55 total, 55 long only, 0 short only, 0 long/short - change of 27,91% MRQ |
| Gennemsnitlig porteføljeallokering | 0.2276 % - change of -20,89% MRQ |
| Institutionelle aktier (lange) | 2.503.954 (ex 13D/G) - change of 0,67MM shares 36,61% MRQ |
| Institutionel værdi (lang) | $ 76.367 USD ($1000) |
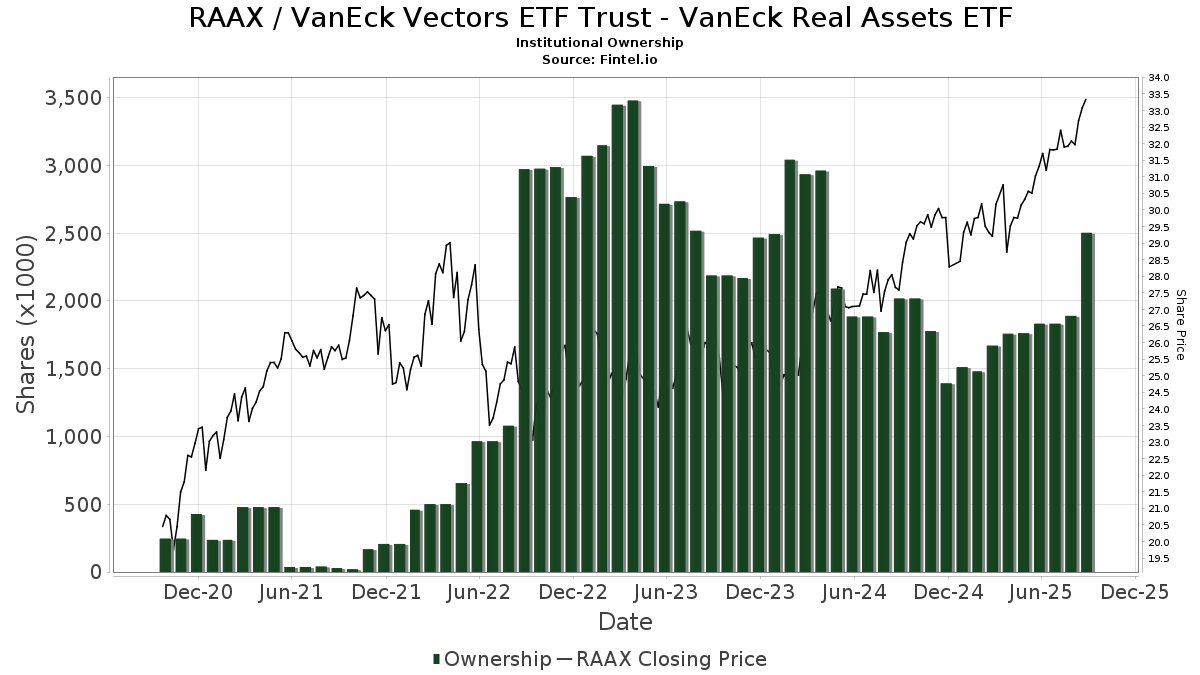
Institutionelt ejerskab og aktionærer
VanEck Vectors ETF Trust - VanEck Real Assets ETF (US:RAAX) har 55 institutionelle ejere og aktionærer, der har indsendt 13D/G- eller 13F-formularer til Securities Exchange Commission (SEC). Disse institutioner har i alt 2,503,954 aktier. Største aktionærer omfatter LPL Financial LLC, BEAM Asset Management, LLC, Copley Financial Group, Inc., David R. Rahn & Associates Inc., Miracle Mile Advisors, LLC, Austin Wealth Management, LLC, Essex Financial Services, Inc., Avantax Advisory Services, Inc., Magnus Financial Group LLC, and Jane Street Group, Llc .
VanEck Vectors ETF Trust - VanEck Real Assets ETF (ARCA:RAAX) institutionel ejerskabsstruktur viser aktuelle positioner i virksomheden efter institutioner og fonde, samt seneste ændringer i positionsstørrelse. Større aktionærer kan omfatte individuelle investorer, investeringsforeninger, hedgefonde eller institutioner. Skema 13D angiver, at investoren besidder (eller besidder) mere end 5 % af virksomheden og har til hensigt (eller har til hensigt at) aktivt at forfølge en ændring i forretningsstrategi. Skema 13G indikerer en passiv investering på over 5%.
The share price as of September 16, 2025 is 33,63 / share. Previously, on September 17, 2024, the share price was 28,39 / share. This represents an increase of 18,46% over that period.
Fondens stemningsscore
Fund Sentiment Score (fka Ownership Accumulation Score) finder de aktier, der bliver mest købt af fonde. Det er resultatet af en sofistikeret, multi-faktor kvantitativ model, der identificerer virksomheder med de højeste niveauer af institutionel akkumulering. Scoringsmodellen bruger en kombination af den samlede stigning i oplyste ejere, ændringerne i porteføljeallokeringer i disse ejere og andre målinger. Tallet går fra 0 til 100, hvor højere tal indikerer et højere niveau af akkumulering for sine jævnaldrende, og 50 er gennemsnittet.
Opdateringsfrekvens: Dagligt
Se Ownership Explorer, som giver en liste over højest rangerende virksomheder.
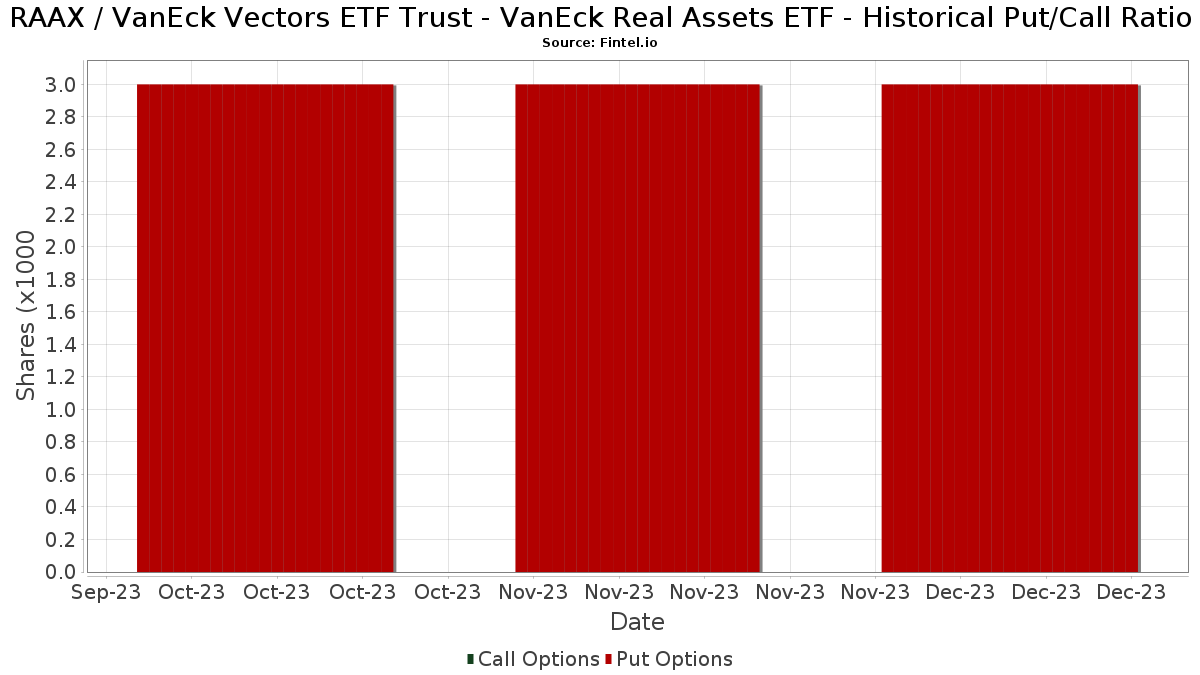
Institutionel Put/Call-forhold
Ud over at indberette standardaktie- og gældsudstedelser skal institutter med mere end 100 mill. aktiver under forvaltning også oplyse deres put- og call-optionsbeholdninger. Da salgsoptioner generelt indikerer negativ stemning, og købsoptioner indikerer positiv stemning, kan vi få en fornemmelse af den overordnede institutionelle stemning ved at plotte forholdet mellem put og kald. Diagrammet til højre viser det historiske put/call-forhold for dette instrument.
Brug af Put/Call Ratio som en indikator for investorernes stemning overvinder en af de vigtigste mangler ved at bruge totalt institutionelt ejerskab, som er, at en betydelig mængde af aktiver under forvaltning investeres passivt for at spore indekser. Passivt forvaltede fonde køber typisk ikke optioner, så indikatoren for put/call-forholdet følger mere nøje følelsen af aktivt forvaltede fonde.
13F og NPORT arkivering
Detaljer om 13F-arkivering er gratis. Detaljer om NP-ansøgninger kræver et premium-medlemskab. Grønne rækker angiver nye positioner. Røde rækker angiver lukkede positioner. Klik på linket ikon for at se den fulde transaktionshistorik.
Opgrader
for at låse premium-data op og eksportere til Excel ![]() .
.
| Fil dato | Kilde | Investor | Type | Gennemsnitlig pris (Øst) |
Aktier | Δ Aktier (%) |
Rapporteret Værdi ($1000) |
Δ Værdi (%) |
Port Alloc (%) |
|
|---|---|---|---|---|---|---|---|---|---|---|
| 2025-08-04 | 13F | Assetmark, Inc | 1.020 | 32 | ||||||
| 2025-08-12 | 13F | Cornerstone Wealth Management, LLC | 27.031 | 839 | ||||||
| 2025-08-12 | 13F | TCTC Holdings, LLC | 13 | 0,00 | 0 | |||||
| 2025-08-12 | 13F | LPL Financial LLC | 776.334 | 67,35 | 24.105 | 70,79 | ||||
| 2025-08-08 | 13F | Austin Wealth Management, LLC | 64.864 | 5,42 | 2.062 | 11,22 | ||||
| 2025-07-28 | 13F | Kiker Wealth Management, LLC | 30 | 0,00 | 1 | |||||
| 2025-08-01 | 13F | Brinker Capital Investments, LLC | 0 | -100,00 | 0 | -100,00 | ||||
| 2025-08-14 | 13F | Mariner, LLC | 20.815 | -0,01 | 646 | 2,05 | ||||
| 2025-08-06 | 13F | Entrewealth, Llc | 25.815 | 11,28 | 802 | 13,62 | ||||
| 2025-04-22 | 13F/A | NorthRock Partners, LLC | 0 | -100,00 | 0 | -100,00 | ||||
| 2025-08-12 | 13F | Steward Partners Investment Advisory, Llc | 500 | 16 | ||||||
| 2025-08-12 | 13F | Virtu Financial LLC | 13.077 | 0 | ||||||
| 2025-08-14 | 13F | Harvest Investment Services, LLC | 0 | -100,00 | 0 | |||||
| 2025-08-08 | 13F | Cetera Investment Advisers | 7.969 | 0,00 | 247 | 2,07 | ||||
| 2025-07-14 | 13F | Sentinel Pension Advisors Inc | 11.794 | -31,37 | 366 | -29,89 | ||||
| 2025-08-13 | 13F | Northwestern Mutual Wealth Management Co | 0 | -100,00 | 0 | |||||
| 2025-08-11 | 13F | Private Advisor Group, LLC | 17.603 | 547 | ||||||
| 2025-07-16 | 13F | Tassel Capital Management, Inc. | 28.753 | 893 | ||||||
| 2025-08-08 | 13F | Capital Investment Advisory Services, LLC | 262 | 8 | ||||||
| 2025-08-14 | 13F | Financial Advisory Service, Inc. | 6.787 | 0,00 | 211 | 1,94 | ||||
| 2025-08-15 | 13F | Equitable Holdings, Inc. | 10.207 | 34,48 | 317 | 37,39 | ||||
| 2025-08-08 | 13F | Avantax Advisory Services, Inc. | 46.602 | 40,06 | 1.447 | 42,89 | ||||
| 2025-08-15 | 13F | Kestra Advisory Services, LLC | 7.543 | 234 | ||||||
| 2025-08-12 | 13F | Journey Strategic Wealth Llc | 23.475 | 11,31 | 729 | 13,57 | ||||
| 2025-07-16 | 13F | Magnus Financial Group LLC | 44.340 | 12,03 | 1.377 | 14,29 | ||||
| 2025-09-04 | 13F/A | Advisor Group Holdings, Inc. | 2.354 | 332,72 | 73 | 356,25 | ||||
| 2025-08-15 | 13F | Prevail Innovative Wealth Advisors, Llc | 25.796 | 27,24 | 801 | 29,87 | ||||
| 2025-08-13 | 13F | Brentview Investment Management LLC | 1.000 | 0,00 | 31 | 3,33 | ||||
| 2025-08-06 | 13F | AE Wealth Management LLC | 17 | 1 | ||||||
| 2025-08-14 | 13F | UBS Group AG | 15.606 | 485 | ||||||
| 2025-07-29 | 13F | Private Trust Co Na | 763 | 0,00 | 24 | 0,00 | ||||
| 2025-08-14 | 13F | Citadel Advisors Llc | 14.081 | 437 | ||||||
| 2025-07-31 | 13F | Cambridge Investment Research Advisors, Inc. | 14.984 | 4,29 | 0 | |||||
| 2025-08-14 | 13F | Van Eck Associates Corp | 849 | 0,00 | 0 | |||||
| 2025-08-14 | 13F | Comerica Bank | 0 | -100,00 | 0 | |||||
| 2025-07-22 | 13F | Miracle Mile Advisors, LLC | 80.807 | -2,21 | 2.509 | -0,20 | ||||
| 2025-07-29 | 13F | Stratos Wealth Partners, LTD. | 11.602 | 13,43 | 360 | 15,76 | ||||
| 2025-07-25 | 13F | Atria Wealth Solutions, Inc. | 29.095 | -12,00 | 903 | -10,15 | ||||
| 2025-08-14 | 13F | Susquehanna International Group, Llp | 13.979 | 434 | ||||||
| 2025-07-10 | 13F | Worth Asset Management, LLC | 11.742 | 365 | ||||||
| 2025-08-13 | 13F | Copley Financial Group, Inc. | 193.787 | -10,48 | 6.017 | -8,64 | ||||
| 2025-08-13 | 13F | Flow Traders U.s. Llc | 16.451 | 1 | ||||||
| 2025-08-05 | 13F | Simplex Trading, Llc | 0 | -100,00 | 0 | |||||
| 2025-08-07 | 13F | David R. Rahn & Associates Inc. | 82.607 | 7,17 | 2.565 | 9,34 | ||||
| 2025-08-14 | 13F | Raymond James Financial Inc | 8.439 | 262 | ||||||
| 2025-08-14 | 13F | Mercer Global Advisors Inc /adv | 8.518 | -2,09 | 264 | 0,00 | ||||
| 2025-07-15 | 13F | Financial Management Professionals, Inc. | 100 | 0,00 | 3 | 0,00 | ||||
| 2025-07-28 | 13F | Harbour Investments, Inc. | 4.776 | -0,83 | 148 | 1,37 | ||||
| 2025-07-16 | 13F | ORG Partners LLC | 12.144 | -2,08 | 383 | 1,06 | ||||
| 2025-08-05 | 13F | BEAM Asset Management, LLC | 657.734 | 24,51 | 20.423 | 27,07 | ||||
| 2025-07-16 | 13F | Essex Financial Services, Inc. | 62.079 | -0,19 | 1.928 | 1,85 | ||||
| 2025-08-11 | 13F | Principal Securities, Inc. | 108 | -67,57 | 3 | -66,67 | ||||
| 2025-07-15 | 13F | Accurate Wealth Management, LLC | 28.913 | 108,97 | 921 | 130,25 | ||||
| 2025-08-14 | 13F | Jane Street Group, Llc | 37.456 | 1.163 | ||||||
| 2025-05-14 | 13F | Orion Portfolio Solutions, LLC | 9.941 | 0,00 | 280 | 0,00 | ||||
| 2025-07-22 | 13F | Inlight Wealth Management, LLC | 200 | 0,00 | 6 | 0,00 | ||||
| 2025-08-15 | 13F | Morgan Stanley | 1 | 0 | ||||||
| 2025-08-12 | 13F | Proequities, Inc. | 0 | 0 | ||||||
| 2025-08-14 | 13F | Wells Fargo & Company/mn | 1 | 0 | ||||||
| 2025-07-17 | 13F/A | Capital Investment Advisors, LLC | 22.932 | 0,45 | 712 | 2,59 | ||||
| 2025-08-14 | 13F | GWM Advisors LLC | 208 | 6 | ||||||
| 2025-08-14 | 13F | CoreCap Advisors, LLC | 50 | 0,00 | 2 | 0,00 | ||||
| 2025-08-08 | 13F | Larson Financial Group LLC | 0 | -100,00 | 0 |
Other Listings
| PE:RAAX |