Grundlæggende statistik
| Institutionelle ejere | 114 total, 113 long only, 0 short only, 1 long/short - change of -6,56% MRQ |
| Gennemsnitlig porteføljeallokering | 0.1338 % - change of -27,97% MRQ |
| Institutionelle aktier (lange) | 23.791.013 (ex 13D/G) - change of 4,01MM shares 20,28% MRQ |
| Institutionel værdi (lang) | $ 551.442 USD ($1000) |
Institutionelt ejerskab og aktionærer
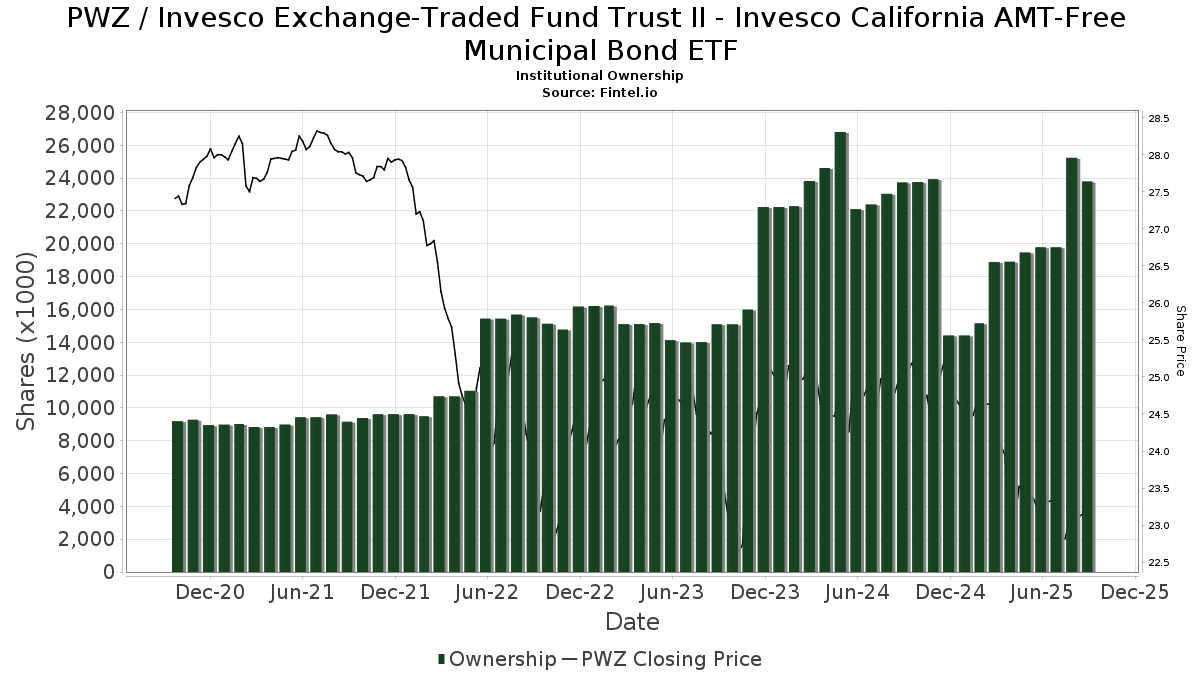
Invesco Exchange-Traded Fund Trust II - Invesco California AMT-Free Municipal Bond ETF (US:PWZ) har 114 institutionelle ejere og aktionærer, der har indsendt 13D/G- eller 13F-formularer til Securities Exchange Commission (SEC). Disse institutioner har i alt 23,791,013 aktier. Største aktionærer omfatter Wealthfront Advisers Llc, Miracle Mile Advisors, LLC, Stratos Wealth Partners, LTD., Mercer Global Advisors Inc /adv, Envestnet Asset Management Inc, Syon Capital Llc, Gerber Kawasaki Wealth & Investment Management, First Foundation Advisors, EP Wealth Advisors, Inc., and Bank Of America Corp /de/ .
Invesco Exchange-Traded Fund Trust II - Invesco California AMT-Free Municipal Bond ETF (ARCA:PWZ) institutionel ejerskabsstruktur viser aktuelle positioner i virksomheden efter institutioner og fonde, samt seneste ændringer i positionsstørrelse. Større aktionærer kan omfatte individuelle investorer, investeringsforeninger, hedgefonde eller institutioner. Skema 13D angiver, at investoren besidder (eller besidder) mere end 5 % af virksomheden og har til hensigt (eller har til hensigt at) aktivt at forfølge en ændring i forretningsstrategi. Skema 13G indikerer en passiv investering på over 5%.
The share price as of September 8, 2025 is 23,70 / share. Previously, on September 9, 2024, the share price was 25,11 / share. This represents a decline of 5,60% over that period.
Fondens stemningsscore
Fund Sentiment Score (fka Ownership Accumulation Score) finder de aktier, der bliver mest købt af fonde. Det er resultatet af en sofistikeret, multi-faktor kvantitativ model, der identificerer virksomheder med de højeste niveauer af institutionel akkumulering. Scoringsmodellen bruger en kombination af den samlede stigning i oplyste ejere, ændringerne i porteføljeallokeringer i disse ejere og andre målinger. Tallet går fra 0 til 100, hvor højere tal indikerer et højere niveau af akkumulering for sine jævnaldrende, og 50 er gennemsnittet.
Opdateringsfrekvens: Dagligt
Se Ownership Explorer, som giver en liste over højest rangerende virksomheder.
Institutionel Put/Call-forhold
Ud over at indberette standardaktie- og gældsudstedelser skal institutter med mere end 100 mill. aktiver under forvaltning også oplyse deres put- og call-optionsbeholdninger. Da salgsoptioner generelt indikerer negativ stemning, og købsoptioner indikerer positiv stemning, kan vi få en fornemmelse af den overordnede institutionelle stemning ved at plotte forholdet mellem put og kald. Diagrammet til højre viser det historiske put/call-forhold for dette instrument.
Brug af Put/Call Ratio som en indikator for investorernes stemning overvinder en af de vigtigste mangler ved at bruge totalt institutionelt ejerskab, som er, at en betydelig mængde af aktiver under forvaltning investeres passivt for at spore indekser. Passivt forvaltede fonde køber typisk ikke optioner, så indikatoren for put/call-forholdet følger mere nøje følelsen af aktivt forvaltede fonde.

13F og NPORT arkivering
Detaljer om 13F-arkivering er gratis. Detaljer om NP-ansøgninger kræver et premium-medlemskab. Grønne rækker angiver nye positioner. Røde rækker angiver lukkede positioner. Klik på linket ikon for at se den fulde transaktionshistorik.
Opgrader
for at låse premium-data op og eksportere til Excel ![]() .
.
| Fil dato | Kilde | Investor | Type | Gennemsnitlig pris (Øst) |
Aktier | Δ Aktier (%) |
Rapporteret Værdi ($1000) |
Δ Værdi (%) |
Port Alloc (%) |
|
|---|---|---|---|---|---|---|---|---|---|---|
| 2025-07-18 | 13F | Warren Street Wealth Advisors, LLC | 19.907 | -3,23 | 465 | -5,31 | ||||
| 2025-07-18 | 13F | Bartlett & Co. Wealth Management Llc | 3.747 | 162,03 | 87 | 155,88 | ||||
| 2025-08-12 | 13F | Jpmorgan Chase & Co | 165.571 | -58,64 | 3.864 | -59,53 | ||||
| 2025-08-13 | 13F | Dynamic Wealth Strategies, LLC | 9.717 | -71,64 | 227 | -72,34 | ||||
| 2025-05-15 | 13F/A | Orion Portfolio Solutions, LLC | 92.720 | -3,16 | 2.211 | -6,47 | ||||
| 2025-08-08 | 13F | Creative Planning | 18.359 | -20,33 | 428 | -22,04 | ||||
| 2025-08-08 | 13F | Crossmark Global Holdings, Inc. | 26.448 | -3,32 | 617 | -6,10 | ||||
| 2025-08-11 | 13F | Avantax Planning Partners, Inc. | 15.296 | -39,18 | 357 | -40,40 | ||||
| 2025-08-07 | 13F | Resources Investment Advisors, LLC. | 45.580 | -60,50 | 1.064 | -61,36 | ||||
| 2025-08-12 | 13F | Steward Partners Investment Advisory, Llc | 10.250 | -1,51 | 239 | -3,63 | ||||
| 2025-08-14 | 13F | BCS Private Wealth Management, Inc. | 20.000 | 0 | ||||||
| 2025-07-18 | 13F | SimpliFi, Inc. | 62.431 | 5,02 | 1.457 | 2,82 | ||||
| 2025-08-06 | 13F | Prospera Financial Services Inc | 43.213 | -3,92 | 1.009 | -5,97 | ||||
| 2025-07-28 | 13F | Elmwood Wealth Management, Inc. | 25.075 | 2,66 | 585 | 0,52 | ||||
| 2025-07-08 | 13F | Zrc Wealth Management, Llc | 3.018 | 0,87 | 70 | -1,41 | ||||
| 2025-08-14 | 13F | Hrt Financial Lp | 0 | -100,00 | 0 | |||||
| 2025-07-28 | 13F | Harbour Investments, Inc. | 407 | 0,00 | 9 | 0,00 | ||||
| 2025-08-01 | 13F | Rossby Financial, LCC | 10.000 | 0,00 | 233 | 0,00 | ||||
| 2025-08-12 | 13F | Global Retirement Partners, LLC | 12.545 | -40,61 | 293 | -43,95 | ||||
| 2025-08-14 | 13F | First Foundation Advisors | 952.878 | -14,55 | 22.240 | -16,37 | ||||
| 2025-08-14 | 13F | Dimension Capital Management Llc | 26.232 | 0,00 | 612 | -2,08 | ||||
| 2025-08-04 | 13F | Bristlecone Advisors, LLC | 0 | -100,00 | 0 | |||||
| 2025-08-14 | 13F | Royal Bank Of Canada | 10.178 | -45,60 | 238 | -46,64 | ||||
| 2025-08-14 | 13F | UBS Group AG | 102.562 | 13,76 | 2.394 | 11,30 | ||||
| 2025-08-01 | 13F | Envestnet Asset Management Inc | 1.666.448 | 16,82 | 38.895 | 14,32 | ||||
| 2025-07-14 | 13F | Parkshore Wealth Management, Inc. | 11.170 | -45,59 | 261 | -46,83 | ||||
| 2025-08-15 | 13F | CI Private Wealth, LLC | 9.729 | 227 | ||||||
| 2025-04-25 | 13F | Avidian Wealth Solutions, LLC | 0 | -100,00 | 0 | |||||
| 2025-07-23 | 13F | Steel Peak Wealth Management LLC | 120.397 | 6,84 | 2.810 | 4,58 | ||||
| 2025-08-14 | 13F | Fmr Llc | 69.951 | -65,84 | 1.633 | -66,58 | ||||
| 2025-07-14 | 13F | Sweeney & Michel, Llc | 20.000 | -9,09 | 464 | -7,21 | ||||
| 2025-07-11 | 13F | Farther Finance Advisors, LLC | 8.100 | 0,00 | 189 | -2,58 | ||||
| 2025-08-11 | 13F | GKV Capital Management Co., Inc. | 0 | -100,00 | 0 | -100,00 | ||||
| 2025-08-14 | 13F | Abound Financial, Llc | 0 | -100,00 | 0 | |||||
| 2025-07-09 | 13F | FOCUS Wealth Advisors, LLC | 39.404 | 5,73 | 920 | 3,49 | ||||
| 2025-07-25 | 13F | Lodestar Private Asset Management Llc | 62.801 | -21,35 | 1.466 | -23,06 | ||||
| 2025-08-12 | 13F | LPL Financial LLC | 582.260 | 0,72 | 13.590 | -1,44 | ||||
| 2025-07-29 | 13F | Werba Rubin Papier Wealth Management | 0 | -100,00 | 0 | |||||
| 2025-07-24 | 13F | Williams & Novak, LLC | 39.800 | 5,57 | 929 | 2,54 | ||||
| 2025-07-22 | 13F | McNaughton Wealth Management, LLC | 84.576 | 26,34 | 1.974 | 23,68 | ||||
| 2025-08-08 | 13F | Larson Financial Group LLC | 2.650 | 0,00 | 62 | -3,17 | ||||
| 2025-08-12 | 13F | Waddell & Associates, Llc | 14.125 | 0,00 | 330 | -2,08 | ||||
| 2025-07-11 | 13F | Myecfo, Llc | 0 | -100,00 | 0 | |||||
| 2025-07-09 | 13F | Affinity Capital Advisors, LLC | 53.170 | -71,99 | 1.241 | -71,48 | ||||
| 2025-07-31 | 13F | Wealthfront Advisers Llc | 5.171.896 | 3.414,50 | 120.712 | 3.340,07 | ||||
| 2025-07-31 | 13F | Cambridge Investment Research Advisors, Inc. | 47.378 | -9,32 | 1 | 0,00 | ||||
| 2025-08-04 | 13F | Keybank National Association/oh | 117.570 | 4,75 | 2.744 | 2,54 | ||||
| 2025-08-11 | 13F | Root Financial Partners, LLC | 10.240 | 239 | ||||||
| 2025-08-14 | 13F | Mercer Global Advisors Inc /adv | 1.667.055 | 15,82 | 38.909 | 13,34 | ||||
| 2025-08-08 | 13F | Omega Financial Group, LLC | 25.044 | 0,56 | 585 | -1,52 | ||||
| 2025-06-23 | NP | SRCMX - California Municipal Fund Class A | 500 | 0,00 | 12 | -8,33 | ||||
| 2025-09-04 | 13F/A | Advisor Group Holdings, Inc. | 60.698 | 382,73 | 1.417 | 373,58 | ||||
| 2025-08-05 | 13F | Tme Financial, Inc. | 12.375 | -35,77 | 289 | -37,25 | ||||
| 2025-08-07 | 13F | Allworth Financial LP | 134.636 | -27,65 | 3.142 | -27,62 | ||||
| 2025-08-26 | 13F | Nautilus Advisors LLC | 37.520 | 0,00 | 876 | -2,13 | ||||
| 2025-08-07 | 13F | Hennion & Walsh Asset Management, Inc. | 40.803 | 21,58 | 952 | 19,00 | ||||
| 2025-08-13 | 13F | Kayne Anderson Rudnick Investment Management Llc | 11.405 | 266 | ||||||
| 2025-04-17 | 13F | Cliftonlarsonallen Wealth Advisors, Llc | 0 | -100,00 | 0 | |||||
| 2025-05-15 | 13F | Tower Research Capital LLC (TRC) | 0 | -100,00 | 0 | |||||
| 2025-08-08 | 13F | Laurel Wealth Planning LLC | 9.749 | -5,24 | 228 | -7,35 | ||||
| 2025-07-21 | 13F | Impact Investors, Inc | 81.431 | -8,58 | 1.901 | -10,55 | ||||
| 2025-08-13 | 13F | EverSource Wealth Advisors, LLC | 1.238 | 0,90 | 29 | -3,45 | ||||
| 2025-08-11 | 13F | First American Trust, Fsb | 262.226 | -19,25 | 6.120 | -20,98 | ||||
| 2025-08-13 | 13F | Fisher Asset Management, LLC | 26.000 | 0,00 | 607 | -2,26 | ||||
| 2025-05-15 | 13F | GWM Advisors LLC | 0 | -100,00 | 0 | -100,00 | ||||
| 2025-08-12 | 13F | Journey Strategic Wealth Llc | 24.275 | -67,73 | 567 | -68,45 | ||||
| 2025-07-21 | 13F | Ameriflex Group, Inc. | 1.499 | 0,00 | 35 | -2,86 | ||||
| 2025-08-07 | 13F | Shared Vision Wealth Group LLC | 18.309 | 419 | ||||||
| 2025-08-06 | 13F | Atlas Legacy Advisors, LLC | 17.663 | -96,03 | 412 | -96,13 | ||||
| 2025-08-14 | 13F | Raymond James Financial Inc | 17.903 | -29,33 | 418 | -30,96 | ||||
| 2025-08-13 | 13F | Townsquare Capital Llc | 0 | -100,00 | 0 | |||||
| 2025-08-14 | 13F | Syon Capital Llc | 1.351.618 | 28,95 | 31.547 | 26,19 | ||||
| 2025-07-31 | 13F | Brighton Jones Llc | 0 | -100,00 | 0 | |||||
| 2025-08-15 | 13F | Morgan Stanley | 616.353 | -3,67 | 14.386 | -5,73 | ||||
| 2025-07-24 | 13F | IFP Advisors, Inc | 287 | 0,00 | 7 | 0,00 | ||||
| 2025-07-08 | 13F | Parallel Advisors, LLC | 40 | 0,00 | 1 | |||||
| 2025-08-06 | 13F | Climber Capital SA | 16.395 | 0,00 | 381 | 13,10 | ||||
| 2025-08-13 | 13F | Jones Financial Companies Lllp | 42.338 | 212,27 | 985 | 205,90 | ||||
| 2025-08-14 | 13F | Stifel Financial Corp | 17.416 | -23,82 | 406 | -25,50 | ||||
| 2025-08-13 | 13F | Guggenheim Capital Llc | 282.428 | 66,74 | 6.592 | 63,18 | ||||
| 2025-08-13 | 13F | WCG Wealth Advisors LLC | 11.204 | 262 | ||||||
| 2025-08-14 | 13F | Destination Wealth Management | 35.256 | 0,00 | 823 | -2,14 | ||||
| 2025-08-14 | 13F | Jane Street Group, Llc | 489.526 | 82,27 | 11.426 | 78,38 | ||||
| 2025-07-22 | 13F | Miracle Mile Advisors, LLC | 2.569.651 | 1,94 | 59.976 | -0,24 | ||||
| 2025-08-13 | 13F | Flow Traders U.s. Llc | 0 | -100,00 | 0 | |||||
| 2025-07-28 | 13F | WealthPlan Investment Management, LLC | 23.996 | 560 | ||||||
| 2025-08-14 | 13F | EP Wealth Advisors, Inc. | 834.086 | -3,84 | 19.468 | -5,90 | ||||
| 2025-08-14 | 13F | Smartleaf Asset Management LLC | 1 | 0,00 | 0 | |||||
| 2025-07-21 | 13F | Ameritas Advisory Services, LLC | 0 | -100,00 | 0 | |||||
| 2025-07-30 | 13F | Clifford Swan Investment Counsel Llc | 10.300 | 0,00 | 240 | -2,04 | ||||
| 2025-08-14 | 13F | Integrated Wealth Concepts LLC | 38.594 | 6,26 | 901 | 3,93 | ||||
| 2025-08-14 | 13F | Mariner, LLC | 151.990 | 17,58 | 3.547 | 15,09 | ||||
| 2025-08-08 | 13F | Avantax Advisory Services, Inc. | 16.332 | -1,72 | 381 | -3,79 | ||||
| 2025-08-14 | 13F | Ameriprise Financial Inc | 75.445 | -80,99 | 1.761 | -81,44 | ||||
| 2025-08-14 | 13F | Susquehanna International Group, Llp | 10.164 | -97,04 | 237 | -97,10 | ||||
| 2025-08-14 | 13F | C M Bidwell & Associates Ltd | 22.132 | 0,00 | 517 | -2,09 | ||||
| 2025-08-14 | 13F | Citadel Advisors Llc | Call | 44.500 | 244,96 | 1.039 | 238,11 | |||
| 2025-08-11 | 13F | Amara Financial, Llc. | 0 | -100,00 | 0 | |||||
| 2025-08-14 | 13F | Citadel Advisors Llc | 51.652 | -22,15 | 1.206 | -23,83 | ||||
| 2025-08-14 | 13F | Atomi Financial Group, Inc. | 64.646 | 47,76 | 1.509 | 44,58 | ||||
| 2025-08-14 | 13F | Citadel Advisors Llc | Put | 18.600 | 434 | |||||
| 2025-07-17 | 13F | Keystone Global Partners, LLC | 0 | -100,00 | 0 | |||||
| 2025-08-11 | 13F | Tidemark, LLC | 0 | -100,00 | 0 | |||||
| 2025-08-13 | 13F | Twin Peaks Wealth Advisors, LLC | 10.106 | 0,00 | 234 | -0,85 | ||||
| 2025-08-14 | 13F | Gerber Kawasaki Wealth & Investment Management | 1.219.896 | -7,08 | 28.472 | -9,07 | ||||
| 2025-07-24 | 13F | Robertson Stephens Wealth Management, LLC | 23.848 | 0,00 | 557 | -2,11 | ||||
| 2025-08-14 | 13F | Foronjy Financial Llc | 9.851 | 230 | ||||||
| 2025-08-04 | 13F | Creative Financial Designs Inc /adv | 3.000 | 0,00 | 70 | -1,41 | ||||
| 2025-08-14 | 13F | Quantinno Capital Management LP | 28.144 | 657 | ||||||
| 2025-07-29 | 13F | Stratos Wealth Partners, LTD. | 1.830.367 | 2,08 | 42.721 | -0,10 | ||||
| 2025-07-14 | 13F | GAMMA Investing LLC | 12.129 | -38,47 | 283 | -39,79 | ||||
| 2025-08-12 | 13F | Ameritas Investment Partners, Inc. | 3.241 | 0,46 | 76 | -1,32 | ||||
| 2025-08-14 | 13F | Comerica Bank | 8.395 | 0,00 | 196 | -2,50 | ||||
| 2025-07-14 | 13F | S.A. Mason LLC | 1.300 | 0,00 | 30 | -3,23 | ||||
| 2025-08-06 | 13F | Commonwealth Equity Services, Llc | 91.809 | 67,72 | 2 | 100,00 | ||||
| 2025-07-18 | 13F | Pure Financial Advisors, Inc. | 304.528 | 402,70 | 7.108 | 392,17 | ||||
| 2025-08-14 | 13F | Warren Averett Asset Management, LLC | 0 | -100,00 | 0 | |||||
| 2025-08-27 | 13F/A | Brinker Capital Investments, LLC | 86.562 | -6,64 | 2.020 | -8,64 | ||||
| 2025-08-11 | 13F | FSA Wealth Management LLC | 592 | 14 | ||||||
| 2025-07-24 | 13F | Us Bancorp \de\ | 2.055 | 0,00 | 48 | -4,08 | ||||
| 2025-08-12 | 13F | Main Management LLC | 4.705 | -0,84 | 0 | |||||
| 2025-07-07 | 13F | Versant Capital Management, Inc | 370 | 0,00 | 9 | 0,00 | ||||
| 2025-05-15 | 13F | Old Mission Capital Llc | 0 | -100,00 | 0 | -100,00 | ||||
| 2025-07-22 | 13F | Hill Island Financial Llc | 8.858 | 0,29 | 207 | -1,90 | ||||
| 2025-08-13 | 13F | Cerity Partners LLC | 0 | -100,00 | 0 | |||||
| 2025-08-11 | 13F | Elequin Capital Lp | 0 | -100,00 | 0 | |||||
| 2025-08-15 | 13F | Equitable Holdings, Inc. | 20.851 | -33,76 | 487 | -35,20 | ||||
| 2025-07-21 | 13F | Mattern Capital Management, Llc | 29.340 | 4,26 | 685 | 1,94 | ||||
| 2025-07-14 | 13F | Southland Equity Partners LLC | 9.950 | 0,00 | 232 | -2,11 | ||||
| 2025-08-06 | 13F | Golden State Wealth Management, LLC | 1.821 | 0,00 | 43 | -2,33 | ||||
| 2025-07-22 | 13F | Verus Wealth Management, Llc | 0 | -100,00 | 0 | |||||
| 2025-08-11 | 13F | HighTower Advisors, LLC | 63.159 | 1,89 | 1.474 | -0,27 | ||||
| 2025-08-14 | 13F | Bank Of America Corp /de/ | 698.813 | -18,66 | 16.310 | -20,40 | ||||
| 2025-08-12 | 13F | NWF Advisory Services Inc. | 23.151 | -43,06 | 552 | -45,02 | ||||
| 2025-08-08 | 13F | Cetera Investment Advisers | 20.568 | 5,30 | 480 | 3,23 | ||||
| 2025-07-22 | 13F | Wealthcare Advisory Partners LLC | 0 | -100,00 | 0 | |||||
| 2025-08-11 | 13F | Greykasell Wealth Strategies, Inc. | 43.108 | 0,99 | 1.006 | -1,18 | ||||
| 2025-04-22 | 13F | Spinnaker Investment Group, LLC | 0 | -100,00 | 0 | |||||
| 2025-08-11 | 13F | NewEdge Wealth, LLC | 0 | -100,00 | 0 | |||||
| 2025-08-12 | 13F | Charles Schwab Investment Management Inc | 0 | -100,00 | 0 | |||||
| 2025-07-24 | 13F | Certus Wealth Management, LLC | 17.309 | 404 | ||||||
| 2025-08-12 | 13F | Proequities, Inc. | 0 | 0 | ||||||
| 2025-08-14 | 13F | Wells Fargo & Company/mn | 223.209 | -31,58 | 5.210 | -33,05 |