Grundlæggende statistik
| Institutionelle ejere | 48 total, 48 long only, 0 short only, 0 long/short - change of -20,00% MRQ |
| Gennemsnitlig porteføljeallokering | 0.0176 % - change of -31,53% MRQ |
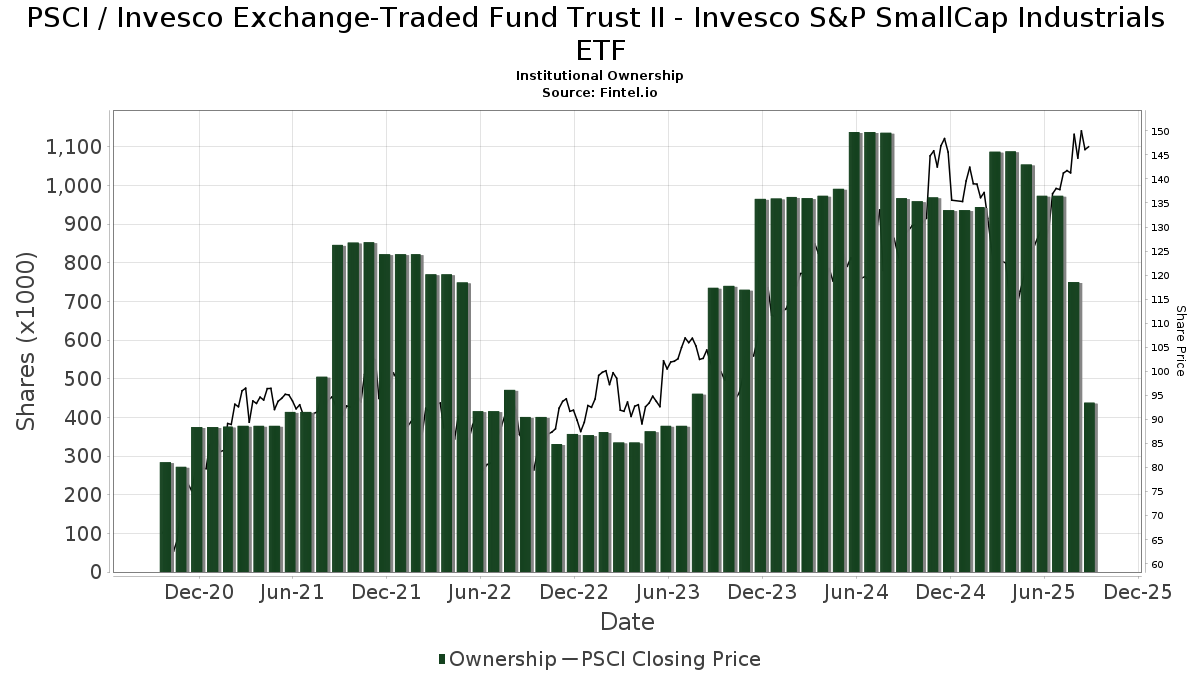
| Institutionelle aktier (lange) | 438.796 (ex 13D/G) - change of -0,53MM shares -54,94% MRQ |
| Institutionel værdi (lang) | $ 55.586 USD ($1000) |
Institutionelt ejerskab og aktionærer
Invesco Exchange-Traded Fund Trust II - Invesco S&P SmallCap Industrials ETF (US:PSCI) har 48 institutionelle ejere og aktionærer, der har indsendt 13D/G- eller 13F-formularer til Securities Exchange Commission (SEC). Disse institutioner har i alt 438,796 aktier. Største aktionærer omfatter Bank Of America Corp /de/, Stratos Wealth Partners, LTD., UBS Group AG, Salem Investment Counselors Inc, Modern Wealth Management, LLC, LPL Financial LLC, Advisor Group Holdings, Inc., Morgan Stanley, Wells Fargo & Company/mn, and Citadel Advisors Llc .
Invesco Exchange-Traded Fund Trust II - Invesco S&P SmallCap Industrials ETF (NasdaqGM:PSCI) institutionel ejerskabsstruktur viser aktuelle positioner i virksomheden efter institutioner og fonde, samt seneste ændringer i positionsstørrelse. Større aktionærer kan omfatte individuelle investorer, investeringsforeninger, hedgefonde eller institutioner. Skema 13D angiver, at investoren besidder (eller besidder) mere end 5 % af virksomheden og har til hensigt (eller har til hensigt at) aktivt at forfølge en ændring i forretningsstrategi. Skema 13G indikerer en passiv investering på over 5%.
The share price as of September 10, 2025 is 146,74 / share. Previously, on September 11, 2024, the share price was 121,88 / share. This represents an increase of 20,40% over that period.
Fondens stemningsscore
Fund Sentiment Score (fka Ownership Accumulation Score) finder de aktier, der bliver mest købt af fonde. Det er resultatet af en sofistikeret, multi-faktor kvantitativ model, der identificerer virksomheder med de højeste niveauer af institutionel akkumulering. Scoringsmodellen bruger en kombination af den samlede stigning i oplyste ejere, ændringerne i porteføljeallokeringer i disse ejere og andre målinger. Tallet går fra 0 til 100, hvor højere tal indikerer et højere niveau af akkumulering for sine jævnaldrende, og 50 er gennemsnittet.
Opdateringsfrekvens: Dagligt
Se Ownership Explorer, som giver en liste over højest rangerende virksomheder.
Institutionel Put/Call-forhold
Ud over at indberette standardaktie- og gældsudstedelser skal institutter med mere end 100 mill. aktiver under forvaltning også oplyse deres put- og call-optionsbeholdninger. Da salgsoptioner generelt indikerer negativ stemning, og købsoptioner indikerer positiv stemning, kan vi få en fornemmelse af den overordnede institutionelle stemning ved at plotte forholdet mellem put og kald. Diagrammet til højre viser det historiske put/call-forhold for dette instrument.
Brug af Put/Call Ratio som en indikator for investorernes stemning overvinder en af de vigtigste mangler ved at bruge totalt institutionelt ejerskab, som er, at en betydelig mængde af aktiver under forvaltning investeres passivt for at spore indekser. Passivt forvaltede fonde køber typisk ikke optioner, så indikatoren for put/call-forholdet følger mere nøje følelsen af aktivt forvaltede fonde.
13F og NPORT arkivering
Detaljer om 13F-arkivering er gratis. Detaljer om NP-ansøgninger kræver et premium-medlemskab. Grønne rækker angiver nye positioner. Røde rækker angiver lukkede positioner. Klik på linket ikon for at se den fulde transaktionshistorik.
Opgrader
for at låse premium-data op og eksportere til Excel ![]() .
.
| Fil dato | Kilde | Investor | Type | Gennemsnitlig pris (Øst) |
Aktier | Δ Aktier (%) |
Rapporteret Værdi ($1000) |
Δ Værdi (%) |
Port Alloc (%) |
|
|---|---|---|---|---|---|---|---|---|---|---|
| 2025-08-12 | 13F | RiverFront Investment Group, LLC | 0 | -100,00 | 0 | |||||
| 2025-07-25 | 13F | Cwm, Llc | 0 | -100,00 | 0 | |||||
| 2025-07-29 | 13F | Stratos Wealth Partners, LTD. | 53.954 | 6,91 | 7.233 | 20,65 | ||||
| 2025-08-12 | 13F | Financial Advocates Investment Management | 2.538 | 20,86 | 340 | 36,55 | ||||
| 2025-08-12 | 13F | Jpmorgan Chase & Co | 1.936 | -65,10 | 260 | -60,70 | ||||
| 2025-07-08 | 13F/A | Salem Investment Counselors Inc | 24.793 | -0,06 | 3.324 | 12,76 | ||||
| 2025-08-12 | 13F | Proequities, Inc. | 0 | 0 | ||||||
| 2025-08-12 | 13F | LPL Financial LLC | 22.555 | -55,22 | 3.024 | -49,47 | ||||
| 2025-08-14 | 13F | Federation des caisses Desjardins du Quebec | 40 | 0,00 | 5 | 25,00 | ||||
| 2025-04-14 | 13F | Harbor Capital Advisors, Inc. | 0 | -100,00 | 0 | |||||
| 2025-08-12 | 13F | Steward Partners Investment Advisory, Llc | 128 | 0,00 | 17 | 13,33 | ||||
| 2025-08-14 | 13F | GWM Advisors LLC | 6 | 0,00 | 1 | |||||
| 2025-08-14 | 13F | Citadel Advisors Llc | 8.727 | 36,59 | 1.170 | 54,02 | ||||
| 2025-08-14 | 13F | Susquehanna International Group, Llp | 4.856 | -42,57 | 651 | -35,26 | ||||
| 2025-08-15 | 13F | Tower Research Capital LLC (TRC) | 4.145 | -31,19 | 556 | -22,38 | ||||
| 2025-08-14 | 13F | Wells Fargo & Company/mn | 8.954 | -4,82 | 1.200 | 7,43 | ||||
| 2025-07-18 | 13F | Truist Financial Corp | 0 | -100,00 | 0 | |||||
| 2025-07-29 | 13F | Private Trust Co Na | 1.094 | 0,00 | 147 | 13,18 | ||||
| 2025-04-21 | 13F | Nelson, Van Denburg & Campbell Wealth Management Group, LLC | 0 | -100,00 | 0 | |||||
| 2025-03-28 | NP | HAPS - Harbor Corporate Culture Small Cap ETF | 2.257 | 270,61 | 315 | 287,65 | ||||
| 2025-08-14 | 13F | Mml Investors Services, Llc | 4.403 | -12,67 | 1 | |||||
| 2025-07-22 | 13F | Valley National Advisers Inc | 921 | -65,63 | 0 | |||||
| 2025-08-14 | 13F | Royal Bank Of Canada | 2.009 | -93,99 | 269 | -93,23 | ||||
| 2025-08-05 | 13F | Key FInancial Inc | 106 | 0,00 | 14 | 16,67 | ||||
| 2025-08-12 | 13F | Virtu Financial LLC | 6.387 | 1 | ||||||
| 2025-05-08 | 13F | Savant Capital, LLC | 0 | -100,00 | 0 | |||||
| 2025-07-31 | 13F | Cambridge Investment Research Advisors, Inc. | 0 | -100,00 | 0 | |||||
| 2025-08-14 | 13F | Jane Street Group, Llc | 0 | -100,00 | 0 | |||||
| 2025-08-14 | 13F | Fmr Llc | 278 | 29,30 | 37 | 48,00 | ||||
| 2025-05-08 | 13F | Geneos Wealth Management Inc. | 0 | -100,00 | 0 | |||||
| 2025-08-14 | 13F | Stifel Financial Corp | 0 | -100,00 | 0 | |||||
| 2025-04-24 | 13F | Jaffetilchin Investment Partners, LLC | 0 | -100,00 | 0 | -100,00 | ||||
| 2025-08-04 | 13F | Spire Wealth Management | 0 | -100,00 | 0 | |||||
| 2025-08-05 | 13F | Cassaday & Co Wealth Management LLC | 7.500 | 347 | ||||||
| 2025-08-14 | 13F | Raymond James Financial Inc | 4.832 | -93,21 | 648 | -92,35 | ||||
| 2025-05-15 | 13F | Amundi | 0 | -100,00 | 0 | |||||
| 2025-08-11 | 13F | HighTower Advisors, LLC | 2.054 | 0,00 | 275 | 12,70 | ||||
| 2025-05-09 | 13F | GeoWealth Management, LLC | 0 | -100,00 | 0 | |||||
| 2025-08-07 | 13F | Allworth Financial LP | 3 | 0,00 | 0 | |||||
| 2025-08-08 | 13F | Cetera Investment Advisers | 2.082 | -22,34 | 279 | -12,26 | ||||
| 2025-05-15 | 13F | Gladstone Institutional Advisory LLC | 0 | -100,00 | 0 | |||||
| 2025-07-16 | 13F | Signaturefd, Llc | 0 | -100,00 | 0 | |||||
| 2025-04-02 | 13F | Marcum Wealth, LLC | 0 | -100,00 | 0 | |||||
| 2025-08-11 | 13F | Aptus Capital Advisors, LLC | 8 | -83,33 | 1 | -80,00 | ||||
| 2025-05-06 | 13F | Wedbush Securities Inc | 0 | -100,00 | 0 | |||||
| 2025-08-12 | 13F | AlphaCore Capital LLC | 25 | 66,67 | 3 | 200,00 | ||||
| 2025-08-14 | 13F | Bank Of America Corp /de/ | 150.274 | -2,33 | 20.146 | 10,22 | ||||
| 2025-08-08 | 13F | Pnc Financial Services Group, Inc. | 37 | -50,67 | 5 | -37,50 | ||||
| 2025-05-09 | 13F | Commonwealth Equity Services, Llc | 0 | -100,00 | 0 | |||||
| 2025-07-24 | 13F | Us Bancorp \de\ | 2.000 | -0,70 | 268 | 12,13 | ||||
| 2025-08-01 | 13F | Envestnet Asset Management Inc | 0 | -100,00 | 0 | |||||
| 2025-07-29 | 13F | Harbor Asset Planning, Inc. | 107 | 14 | ||||||
| 2025-07-28 | 13F | Harbour Investments, Inc. | 12 | 0,00 | 2 | 0,00 | ||||
| 2025-04-08 | 13F | Parallel Advisors, LLC | 0 | -100,00 | 0 | |||||
| 2025-08-14 | 13F | Comerica Bank | 30 | -96,86 | 4 | -96,46 | ||||
| 2025-08-11 | 13F | Private Advisor Group, LLC | 5.349 | 1,56 | 717 | 14,72 | ||||
| 2025-08-05 | 13F | Carolinas Wealth Consulting Llc | 0 | -100,00 | 0 | -100,00 | ||||
| 2025-04-29 | 13F | Td Private Client Wealth Llc | 0 | -100,00 | 0 | |||||
| 2025-07-14 | 13F | GAMMA Investing LLC | 98 | 0,00 | 13 | 18,18 | ||||
| 2025-07-23 | 13F | Elm3 Financial Group, LLC | 0 | -100,00 | 0 | |||||
| 2025-07-22 | 13F | Kessler Investment Group, LLC | 608 | 4,11 | 82 | 17,39 | ||||
| 2025-08-06 | 13F | AE Wealth Management LLC | 0 | -100,00 | 0 | |||||
| 2025-08-14 | 13F | UBS Group AG | 52.481 | -1,61 | 7.036 | 11,03 | ||||
| 2025-09-04 | 13F/A | Advisor Group Holdings, Inc. | 13.928 | 39,27 | 1.868 | 57,15 | ||||
| 2025-07-17 | 13F | Janney Montgomery Scott LLC | 0 | -100,00 | 0 | |||||
| 2025-07-31 | 13F/A | Avion Wealth | 500 | 0,00 | 0 | |||||
| 2025-04-01 | 13F | Massmutual Trust Co Fsb/adv | 0 | -100,00 | 0 | |||||
| 2025-05-15 | 13F | Novak & Powell Financial Services, Inc. | 0 | -100,00 | 0 | |||||
| 2025-08-12 | 13F | Global Retirement Partners, LLC | 2.274 | 86,09 | 305 | 85,37 | ||||
| 2025-05-05 | 13F | IFP Advisors, Inc | 0 | -100,00 | 0 | |||||
| 2025-07-21 | 13F | TFG Advisers LLC | 1.853 | -5,02 | 248 | 7,36 | ||||
| 2025-08-01 | 13F | Bessemer Group Inc | 0 | -100,00 | 0 | |||||
| 2025-08-13 | 13F | Flow Traders U.s. Llc | 4.196 | 1 | ||||||
| 2025-05-13 | 13F | Cookson Peirce & Co Inc | 0 | -100,00 | 0 | |||||
| 2025-08-12 | 13F | MAI Capital Management | 256 | -93,47 | 34 | -92,69 | ||||
| 2025-07-30 | 13F | Bogart Wealth, LLC | 0 | -100,00 | 0 | |||||
| 2025-07-29 | 13F | Koshinski Asset Management, Inc. | 2.058 | -21,00 | 276 | -11,00 | ||||
| 2025-05-15 | 13F | Modern Wealth Management, LLC | 24.415 | 0,02 | 2.900 | -11,56 | ||||
| 2025-08-13 | 13F | Jones Financial Companies Lllp | 327 | 27,24 | 44 | 43,33 | ||||
| 2025-07-28 | 13F | Copia Wealth Management | 36 | 0,00 | 5 | 0,00 | ||||
| 2025-08-15 | 13F | Morgan Stanley | 11.366 | -18,90 | 1.524 | -8,47 |