Grundlæggende statistik
| Institutionelle ejere | 67 total, 67 long only, 0 short only, 0 long/short - change of -5,56% MRQ |
| Gennemsnitlig porteføljeallokering | 0.0411 % - change of -17,97% MRQ |
| Institutionelle aktier (lange) | 711.964 (ex 13D/G) - change of -0,07MM shares -9,12% MRQ |
| Institutionel værdi (lang) | $ 26.704 USD ($1000) |
Institutionelt ejerskab og aktionærer
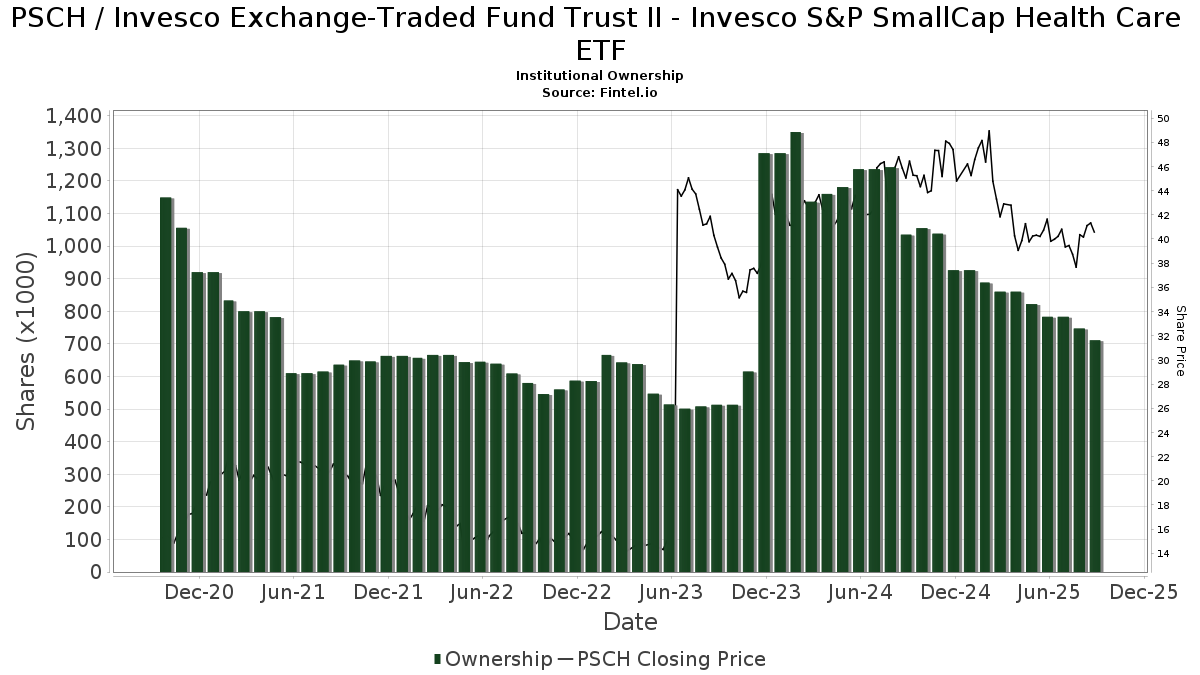
Invesco Exchange-Traded Fund Trust II - Invesco S&P SmallCap Health Care ETF (US:PSCH) har 67 institutionelle ejere og aktionærer, der har indsendt 13D/G- eller 13F-formularer til Securities Exchange Commission (SEC). Disse institutioner har i alt 711,964 aktier. Største aktionærer omfatter Morgan Stanley, Wells Fargo & Company/mn, LPL Financial LLC, Wbi Investments, Inc., Pacific Sun Financial Corp, UBS Group AG, Virtu Financial LLC, Bank Of America Corp /de/, MGB Wealth Management, LLC, and IHT Wealth Management, LLC .
Invesco Exchange-Traded Fund Trust II - Invesco S&P SmallCap Health Care ETF (NasdaqGM:PSCH) institutionel ejerskabsstruktur viser aktuelle positioner i virksomheden efter institutioner og fonde, samt seneste ændringer i positionsstørrelse. Større aktionærer kan omfatte individuelle investorer, investeringsforeninger, hedgefonde eller institutioner. Skema 13D angiver, at investoren besidder (eller besidder) mere end 5 % af virksomheden og har til hensigt (eller har til hensigt at) aktivt at forfølge en ændring i forretningsstrategi. Skema 13G indikerer en passiv investering på over 5%.
The share price as of September 12, 2025 is 40,76 / share. Previously, on September 16, 2024, the share price was 46,50 / share. This represents a decline of 12,34% over that period.
Fondens stemningsscore
Fund Sentiment Score (fka Ownership Accumulation Score) finder de aktier, der bliver mest købt af fonde. Det er resultatet af en sofistikeret, multi-faktor kvantitativ model, der identificerer virksomheder med de højeste niveauer af institutionel akkumulering. Scoringsmodellen bruger en kombination af den samlede stigning i oplyste ejere, ændringerne i porteføljeallokeringer i disse ejere og andre målinger. Tallet går fra 0 til 100, hvor højere tal indikerer et højere niveau af akkumulering for sine jævnaldrende, og 50 er gennemsnittet.
Opdateringsfrekvens: Dagligt
Se Ownership Explorer, som giver en liste over højest rangerende virksomheder.
Institutionel Put/Call-forhold
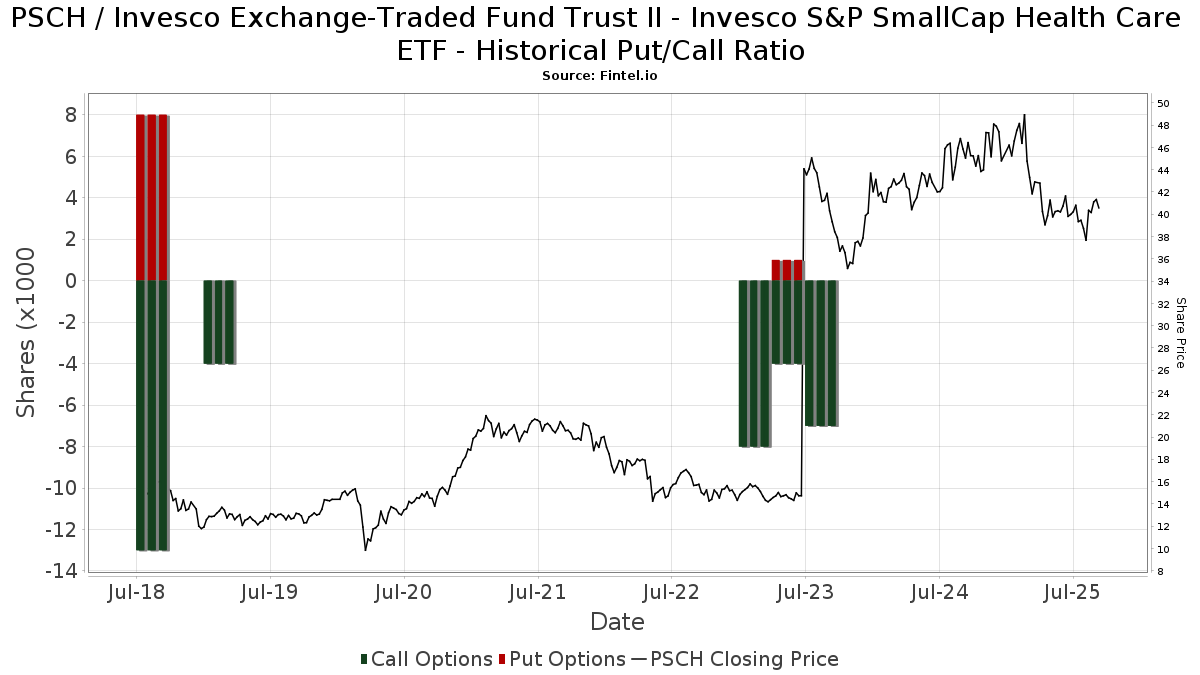
Ud over at indberette standardaktie- og gældsudstedelser skal institutter med mere end 100 mill. aktiver under forvaltning også oplyse deres put- og call-optionsbeholdninger. Da salgsoptioner generelt indikerer negativ stemning, og købsoptioner indikerer positiv stemning, kan vi få en fornemmelse af den overordnede institutionelle stemning ved at plotte forholdet mellem put og kald. Diagrammet til højre viser det historiske put/call-forhold for dette instrument.
Brug af Put/Call Ratio som en indikator for investorernes stemning overvinder en af de vigtigste mangler ved at bruge totalt institutionelt ejerskab, som er, at en betydelig mængde af aktiver under forvaltning investeres passivt for at spore indekser. Passivt forvaltede fonde køber typisk ikke optioner, så indikatoren for put/call-forholdet følger mere nøje følelsen af aktivt forvaltede fonde.
13F og NPORT arkivering
Detaljer om 13F-arkivering er gratis. Detaljer om NP-ansøgninger kræver et premium-medlemskab. Grønne rækker angiver nye positioner. Røde rækker angiver lukkede positioner. Klik på linket ikon for at se den fulde transaktionshistorik.
Opgrader
for at låse premium-data op og eksportere til Excel ![]() .
.
| Fil dato | Kilde | Investor | Type | Gennemsnitlig pris (Øst) |
Aktier | Δ Aktier (%) |
Rapporteret Værdi ($1000) |
Δ Værdi (%) |
Port Alloc (%) |
|
|---|---|---|---|---|---|---|---|---|---|---|
| 2025-08-14 | 13F | IHT Wealth Management, LLC | 24.569 | 72,37 | 984 | 59,74 | ||||
| 2025-08-14 | 13F | Stifel Financial Corp | 5.521 | 221 | ||||||
| 2025-07-11 | 13F | Seacrest Wealth Management, Llc | 0 | -100,00 | 0 | |||||
| 2025-08-12 | 13F | Global Retirement Partners, LLC | 915 | 0,00 | 37 | -10,00 | ||||
| 2025-08-05 | 13F | GPS Wealth Strategies Group, LLC | 45 | 0,00 | 2 | 0,00 | ||||
| 2025-08-12 | 13F | Proequities, Inc. | 0 | 0 | ||||||
| 2025-04-01 | 13F | Massmutual Trust Co Fsb/adv | 0 | -100,00 | 0 | |||||
| 2025-08-12 | 13F | Jpmorgan Chase & Co | 60 | -94,27 | 2 | -95,56 | ||||
| 2025-08-12 | 13F | LPL Financial LLC | 53.334 | -0,59 | 2.137 | -7,97 | ||||
| 2025-08-13 | 13F | Transce3nd, LLC | 17 | -5,56 | 1 | |||||
| 2025-07-28 | 13F | Mission Hills Financial Advisory, LLC | 9.162 | -0,21 | 367 | -7,56 | ||||
| 2025-08-12 | 13F | Steward Partners Investment Advisory, Llc | 2.944 | 0,00 | 118 | -7,87 | ||||
| 2025-08-14 | 13F | Riggs Asset Managment Co. Inc. | 1.140 | 0,00 | 46 | -8,16 | ||||
| 2025-08-14 | 13F | GWM Advisors LLC | 721 | 0,00 | 29 | -9,68 | ||||
| 2025-04-28 | 13F | Fedenia Advisers LLC | 0 | -100,00 | 0 | |||||
| 2025-07-22 | 13F | Sava Infond d.o.o. | 6.100 | 0,00 | 244 | -7,58 | ||||
| 2025-08-14 | 13F | Ameriprise Financial Inc | 23.084 | -37,93 | 925 | -42,57 | ||||
| 2025-08-14 | 13F | Wells Fargo & Company/mn | 58.033 | -16,75 | 2.325 | -22,94 | ||||
| 2025-08-15 | 13F | Tower Research Capital LLC (TRC) | 13.871 | -34,72 | 556 | -39,61 | ||||
| 2025-07-07 | 13F | Somerset Trust Co | 7.797 | 0,00 | 312 | -7,42 | ||||
| 2025-07-25 | 13F | Cwm, Llc | 646 | -13,40 | 0 | |||||
| 2025-08-13 | 13F | Northwestern Mutual Wealth Management Co | 2.083 | -20,25 | 83 | -26,55 | ||||
| 2025-04-21 | 13F | Nelson, Van Denburg & Campbell Wealth Management Group, LLC | 0 | -100,00 | 0 | |||||
| 2025-08-08 | 13F | Pnc Financial Services Group, Inc. | 783 | 0,00 | 31 | -6,06 | ||||
| 2025-08-13 | 13F/A | StoneX Group Inc. | 7.151 | 269 | ||||||
| 2025-08-06 | 13F | New Millennium Group LLC | 148 | -50,67 | 6 | -58,33 | ||||
| 2025-08-13 | 13F | Flow Traders U.s. Llc | 7.797 | 0 | ||||||
| 2025-07-16 | 13F | Register Financial Advisors LLC | 0 | -100,00 | 0 | |||||
| 2025-08-05 | 13F | Key FInancial Inc | 141 | 0,00 | 6 | -16,67 | ||||
| 2025-08-12 | 13F | Virtu Financial LLC | 27.773 | -23,76 | 1 | 0,00 | ||||
| 2025-08-13 | 13F | Beacon Pointe Advisors, LLC | 5.409 | 0,00 | 217 | -7,69 | ||||
| 2025-08-19 | 13F | Newbridge Financial Services Group, Inc. | 57 | 0,00 | 2 | 0,00 | ||||
| 2025-04-17 | 13F | Montecito Bank & Trust | 22.338 | -10,20 | 967 | -12,26 | ||||
| 2025-08-15 | 13F | Morgan Stanley | 59.580 | -29,12 | 2.387 | -34,39 | ||||
| 2025-08-08 | 13F | Wiser Advisor Group LLC | 0 | -100,00 | 0 | |||||
| 2025-05-14 | 13F | Jane Street Group, Llc | 0 | -100,00 | 0 | |||||
| 2025-08-06 | 13F | Commonwealth Equity Services, Llc | 9.766 | -7,91 | 0 | |||||
| 2025-08-14 | 13F | Royal Bank Of Canada | 23.714 | -3,86 | 951 | -10,87 | ||||
| 2025-08-14 | 13F | Citadel Advisors Llc | 19.241 | 185,47 | 771 | 164,60 | ||||
| 2025-08-06 | 13F | Aspect Partners, LLC | 375 | 15 | ||||||
| 2025-07-14 | 13F | GAMMA Investing LLC | 120 | 0,00 | 5 | -20,00 | ||||
| 2025-08-11 | 13F | Citigroup Inc | 600 | 0,00 | 24 | -4,00 | ||||
| 2025-07-30 | 13F | Pacific Sun Financial Corp | 45.842 | -5,84 | 1.837 | -12,86 | ||||
| 2025-08-11 | 13F | Greykasell Wealth Strategies, Inc. | 582 | 0,00 | 23 | -8,00 | ||||
| 2025-07-21 | 13F | Ameritas Advisory Services, LLC | 600 | 24 | ||||||
| 2025-07-29 | 13F | Chicago Partners Investment Group LLC | 7.898 | -34,17 | 312 | -34,80 | ||||
| 2025-08-14 | 13F | Raymond James Financial Inc | 14.755 | -11,68 | 591 | -18,26 | ||||
| 2025-05-12 | 13F | Simplex Trading, Llc | 0 | -100,00 | 0 | |||||
| 2025-05-14 | 13F | Susquehanna International Group, Llp | 0 | -100,00 | 0 | |||||
| 2025-07-23 | 13F | Clear Creek Financial Management, LLC | 0 | -100,00 | 0 | |||||
| 2025-08-14 | 13F | Fmr Llc | 1.045 | -46,36 | 42 | -51,19 | ||||
| 2025-05-15 | 13F | Creative Planning | 0 | -100,00 | 0 | |||||
| 2025-08-11 | 13F | HighTower Advisors, LLC | 5.086 | 0,41 | 204 | -7,31 | ||||
| 2025-08-18 | 13F | Goodman Advisory Group, LLC | 0 | -100,00 | 0 | |||||
| 2025-07-28 | 13F | Alpine Woods Capital Investors, Llc | 7.500 | 0,00 | 301 | -7,41 | ||||
| 2025-08-08 | 13F | Cetera Investment Advisers | 10.216 | -11,43 | 409 | -18,04 | ||||
| 2025-07-18 | 13F | McGuire Investment Group, LLC | 14.670 | -15,19 | 588 | -21,52 | ||||
| 2025-04-25 | 13F | Richardson Capital Management LLC | 0 | -100,00 | 0 | |||||
| 2025-05-15 | 13F | Gladstone Institutional Advisory LLC | 0 | -100,00 | 0 | |||||
| 2025-07-24 | 13F | Us Bancorp \de\ | 99 | 0,00 | 4 | -25,00 | ||||
| 2025-08-12 | 13F | CIBC Private Wealth Group, LLC | 0 | -100,00 | 0 | |||||
| 2025-08-08 | 13F | Capital Investment Advisory Services, LLC | 150 | 0,00 | 6 | 0,00 | ||||
| 2025-05-13 | 13F | Bank Of Montreal /can/ | 0 | -100,00 | 0 | |||||
| 2025-07-10 | 13F | Focus Financial Network, Inc. | 0 | -100,00 | 0 | |||||
| 2025-08-11 | 13F | Aptus Capital Advisors, LLC | 396 | 0,00 | 16 | -11,76 | ||||
| 2025-08-14 | 13F | Comerica Bank | 0 | -100,00 | 0 | |||||
| 2025-08-07 | 13F | Cascade Financial Partners, LLC | 14.409 | -1,04 | 577 | -8,41 | ||||
| 2025-08-14 | 13F | Bank Of America Corp /de/ | 24.826 | 0,15 | 995 | -7,28 | ||||
| 2025-08-01 | 13F | Ashton Thomas Private Wealth, LLC | 0 | -100,00 | 0 | |||||
| 2025-05-12 | 13F | Founders Financial Alliance, LLC | 0 | -100,00 | 0 | |||||
| 2025-07-21 | 13F | Ntv Asset Management Llc | 7.575 | 0,00 | 304 | -7,34 | ||||
| 2025-08-12 | 13F | O'shaughnessy Asset Management, Llc | 376 | 0,00 | 15 | -6,25 | ||||
| 2025-07-07 | 13F | Thurston, Springer, Miller, Herd & Titak, Inc. | 778 | 0,13 | 31 | -6,06 | ||||
| 2025-08-13 | 13F | Baird Financial Group, Inc. | 8.194 | 0,00 | 328 | -7,34 | ||||
| 2025-08-01 | 13F | Envestnet Asset Management Inc | 17.382 | 0,29 | 697 | -7,20 | ||||
| 2025-09-04 | 13F/A | Advisor Group Holdings, Inc. | 5.368 | -19,48 | 215 | -25,35 | ||||
| 2025-08-05 | 13F | Huntington National Bank | 0 | |||||||
| 2025-07-22 | 13F | Kessler Investment Group, LLC | 2.793 | 1,45 | 112 | -6,72 | ||||
| 2025-08-14 | 13F | UBS Group AG | 36.950 | 14,66 | 1.481 | 6,17 | ||||
| 2025-04-22 | 13F | Cambridge Investment Research Advisors, Inc. | 0 | -100,00 | 0 | |||||
| 2025-08-04 | 13F | Spire Wealth Management | 187 | 0,00 | 7 | -12,50 | ||||
| 2025-08-07 | 13F | Addison Advisors LLC | 567 | 0,00 | 23 | -8,33 | ||||
| 2025-08-11 | 13F | Wbi Investments, Inc. | 51.056 | -3,26 | 2.046 | -10,46 | ||||
| 2025-07-25 | 13F | Northwest Capital Management Inc | 0 | -100,00 | 0 | |||||
| 2025-08-12 | 13F | MAI Capital Management | 2.475 | 0,00 | 99 | -7,48 | ||||
| 2025-08-14 | 13F | Dagco, Inc. | 1.950 | 78 | ||||||
| 2025-07-18 | 13F | SOA Wealth Advisors, LLC. | 240 | -43,66 | 10 | -50,00 | ||||
| 2025-08-14 | 13F | MGB Wealth Management, LLC | 24.775 | 0,00 | 993 | -7,46 | ||||
| 2025-07-17 | 13F | Wagner Wealth Management, Llc | 39 | 0,00 | 2 | 0,00 | ||||
| 2025-08-14 | 13F | Qube Research & Technologies Ltd | 579 | 0,00 | 23 | -8,00 | ||||
| 2025-08-13 | 13F | Jones Financial Companies Lllp | 7.571 | -37,45 | 304 | -40,12 |