Grundlæggende statistik
| Institutionelle ejere | 93 total, 93 long only, 0 short only, 0 long/short - change of -5,10% MRQ |
| Gennemsnitlig porteføljeallokering | 0.0470 % - change of -7,75% MRQ |
| Institutionelle aktier (lange) | 648.321 (ex 13D/G) - change of -0,04MM shares -5,62% MRQ |
| Institutionel værdi (lang) | $ 49.859 USD ($1000) |
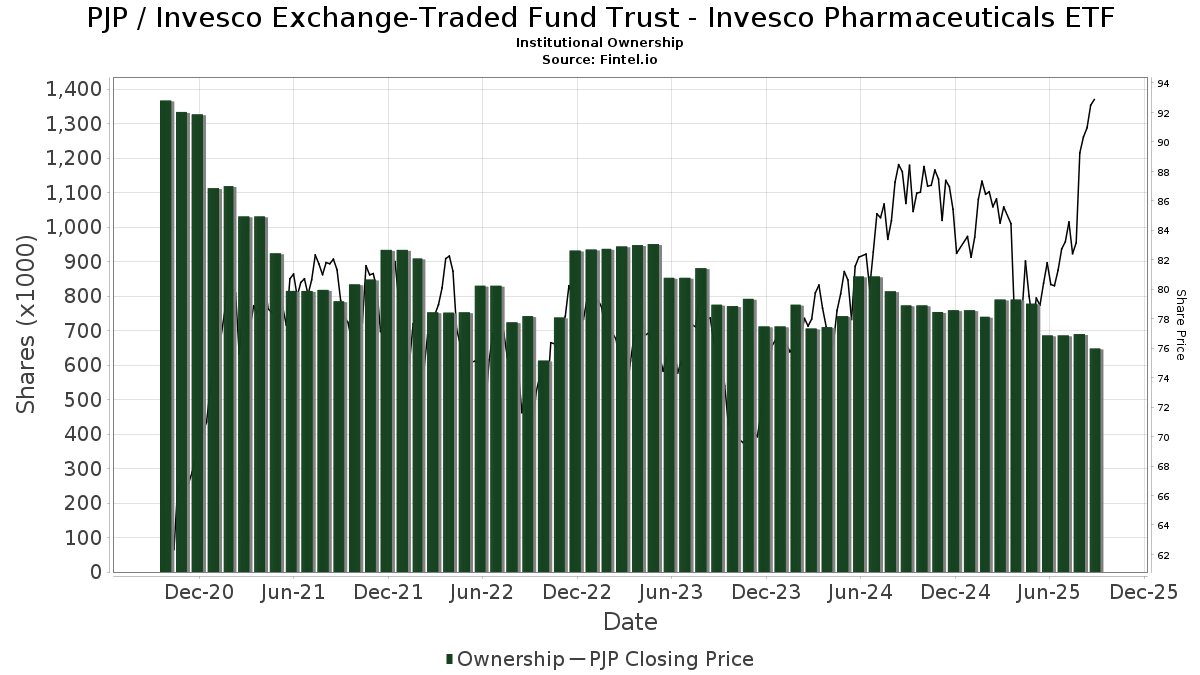
Institutionelt ejerskab og aktionærer
Invesco Exchange-Traded Fund Trust - Invesco Pharmaceuticals ETF (US:PJP) har 93 institutionelle ejere og aktionærer, der har indsendt 13D/G- eller 13F-formularer til Securities Exchange Commission (SEC). Disse institutioner har i alt 648,321 aktier. Største aktionærer omfatter Peak Asset Management, LLC, LPL Financial LLC, UBS Group AG, Morgan Stanley, Wells Fargo & Company/mn, Royal Bank Of Canada, Bank Of America Corp /de/, Joseph Group Capital Management, MGB Wealth Management, LLC, and Envestnet Asset Management Inc .
Invesco Exchange-Traded Fund Trust - Invesco Pharmaceuticals ETF (ARCA:PJP) institutionel ejerskabsstruktur viser aktuelle positioner i virksomheden efter institutioner og fonde, samt seneste ændringer i positionsstørrelse. Større aktionærer kan omfatte individuelle investorer, investeringsforeninger, hedgefonde eller institutioner. Skema 13D angiver, at investoren besidder (eller besidder) mere end 5 % af virksomheden og har til hensigt (eller har til hensigt at) aktivt at forfølge en ændring i forretningsstrategi. Skema 13G indikerer en passiv investering på over 5%.
The share price as of September 12, 2025 is 92,00 / share. Previously, on September 16, 2024, the share price was 88,04 / share. This represents an increase of 4,50% over that period.
Fondens stemningsscore
Fund Sentiment Score (fka Ownership Accumulation Score) finder de aktier, der bliver mest købt af fonde. Det er resultatet af en sofistikeret, multi-faktor kvantitativ model, der identificerer virksomheder med de højeste niveauer af institutionel akkumulering. Scoringsmodellen bruger en kombination af den samlede stigning i oplyste ejere, ændringerne i porteføljeallokeringer i disse ejere og andre målinger. Tallet går fra 0 til 100, hvor højere tal indikerer et højere niveau af akkumulering for sine jævnaldrende, og 50 er gennemsnittet.
Opdateringsfrekvens: Dagligt
Se Ownership Explorer, som giver en liste over højest rangerende virksomheder.
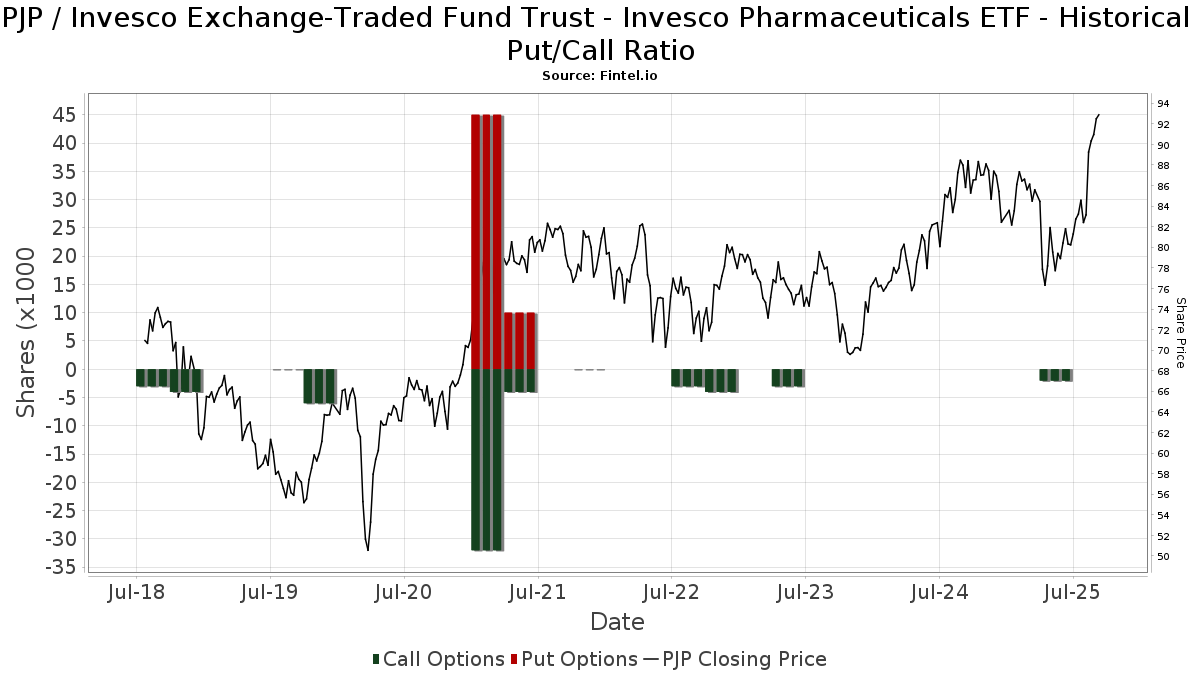
Institutionel Put/Call-forhold
Ud over at indberette standardaktie- og gældsudstedelser skal institutter med mere end 100 mill. aktiver under forvaltning også oplyse deres put- og call-optionsbeholdninger. Da salgsoptioner generelt indikerer negativ stemning, og købsoptioner indikerer positiv stemning, kan vi få en fornemmelse af den overordnede institutionelle stemning ved at plotte forholdet mellem put og kald. Diagrammet til højre viser det historiske put/call-forhold for dette instrument.
Brug af Put/Call Ratio som en indikator for investorernes stemning overvinder en af de vigtigste mangler ved at bruge totalt institutionelt ejerskab, som er, at en betydelig mængde af aktiver under forvaltning investeres passivt for at spore indekser. Passivt forvaltede fonde køber typisk ikke optioner, så indikatoren for put/call-forholdet følger mere nøje følelsen af aktivt forvaltede fonde.
13F og NPORT arkivering
Detaljer om 13F-arkivering er gratis. Detaljer om NP-ansøgninger kræver et premium-medlemskab. Grønne rækker angiver nye positioner. Røde rækker angiver lukkede positioner. Klik på linket ikon for at se den fulde transaktionshistorik.
Opgrader
for at låse premium-data op og eksportere til Excel ![]() .
.
| Fil dato | Kilde | Investor | Type | Gennemsnitlig pris (Øst) |
Aktier | Δ Aktier (%) |
Rapporteret Værdi ($1000) |
Δ Værdi (%) |
Port Alloc (%) |
|
|---|---|---|---|---|---|---|---|---|---|---|
| 2025-08-08 | 13F | Capital Investment Advisory Services, LLC | 4.416 | 0,34 | 353 | -7,61 | ||||
| 2025-08-08 | 13F | Cetera Investment Advisers | 5.968 | -4,36 | 477 | -11,85 | ||||
| 2025-08-14 | 13F | Bnp Paribas Arbitrage, Sa | 10.000 | 799 | ||||||
| 2025-07-15 | 13F | North Star Investment Management Corp. | 600 | 0,00 | 48 | -7,84 | ||||
| 2025-08-14 | 13F | Bank Of America Corp /de/ | 23.154 | -46,24 | 1.849 | -50,43 | ||||
| 2025-08-14 | 13F | Federation des caisses Desjardins du Quebec | 129 | -99,54 | 10 | -99,59 | ||||
| 2025-08-14 | 13F | Comerica Bank | 190 | 0,00 | 15 | -6,25 | ||||
| 2025-07-10 | 13F | Wealth Enhancement Advisory Services, Llc | 7.462 | -6,69 | 607 | -12,28 | ||||
| 2025-08-11 | 13F | Pin Oak Investment Advisors Inc | 0 | -100,00 | 0 | |||||
| 2025-07-18 | 13F | Bartlett & Co. Wealth Management Llc | 574 | 0,00 | 46 | -8,16 | ||||
| 2025-05-12 | 13F | Sandy Spring Bank | 17 | 0,00 | 1 | 0,00 | ||||
| 2025-08-04 | 13F | Flagship Harbor Advisors, Llc | 5.944 | 0,00 | 475 | -7,78 | ||||
| 2025-08-11 | 13F | HighTower Advisors, LLC | 2.713 | 0,11 | 217 | -7,69 | ||||
| 2025-07-16 | 13F | Diversified Enterprises, LLC | 4.059 | 0,05 | 324 | -7,69 | ||||
| 2025-08-14 | 13F | Susquehanna International Group, Llp | Call | 2.800 | 224 | |||||
| 2025-08-14 | 13F | Susquehanna International Group, Llp | 6.825 | -35,07 | 545 | -40,11 | ||||
| 2025-08-18 | 13F | Geneos Wealth Management Inc. | 1.387 | 0,00 | 111 | -8,33 | ||||
| 2025-07-09 | 13F | Intelligence Driven Advisers, LLC | 5.400 | 431 | ||||||
| 2025-04-24 | 13F | Kraft, Davis & Associates, LLC | 0 | -100,00 | 0 | |||||
| 2025-07-25 | 13F | Means Investment Co., Inc. | 3.273 | 0,18 | 261 | -7,45 | ||||
| 2025-08-14 | 13F | Goldman Sachs Group Inc | 15.974 | 83,50 | 1.276 | 69,32 | ||||
| 2025-07-25 | 13F | Cwm, Llc | 0 | -100,00 | 0 | |||||
| 2025-08-12 | 13F | Steward Partners Investment Advisory, Llc | 1.141 | 0,00 | 91 | -7,14 | ||||
| 2025-08-14 | 13F | Wiley Bros.-aintree Capital, Llc | 3.555 | -0,11 | 284 | -5,35 | ||||
| 2025-08-18 | 13F | Hollencrest Capital Management | 101 | 0,00 | 8 | 0,00 | ||||
| 2025-08-14 | 13F | Wells Fargo & Company/mn | 26.629 | -1,89 | 2.127 | -9,53 | ||||
| 2025-08-15 | 13F | Equitable Holdings, Inc. | 3.455 | 276 | ||||||
| 2025-08-18 | 13F | N.E.W. Advisory Services LLC | 456 | -47,47 | 36 | -52,00 | ||||
| 2025-08-15 | 13F | Kestra Advisory Services, LLC | 0 | -100,00 | 0 | |||||
| 2025-08-12 | 13F | LPL Financial LLC | 50.382 | 2,53 | 4.024 | -5,47 | ||||
| 2025-08-14 | 13F | Qube Research & Technologies Ltd | 55 | 0,00 | 4 | 0,00 | ||||
| 2025-07-14 | 13F | Bank & Trust Co | 60 | 0,00 | 5 | -20,00 | ||||
| 2025-07-30 | 13F | Whittier Trust Co | 19 | 0,00 | 2 | 0,00 | ||||
| 2025-09-11 | 13F | Silicon Valley Capital Partners | 104 | 8 | ||||||
| 2025-07-31 | 13F | Cambridge Investment Research Advisors, Inc. | 9.344 | -3,55 | 1 | |||||
| 2025-07-24 | 13F | IFP Advisors, Inc | 335 | 0,00 | 27 | -10,34 | ||||
| 2025-08-14 | 13F | Murphy & Mullick Capital Management Corp | 115 | 0,00 | 9 | 0,00 | ||||
| 2025-08-14 | 13F | Royal Bank Of Canada | 25.352 | 117,73 | 2.025 | 100,89 | ||||
| 2025-04-24 | 13F | Decker Retirement Planning Inc. | 0 | -100,00 | 0 | |||||
| 2025-08-13 | 13F | Financial Freedom, LLC | 385 | 0,52 | 31 | -9,09 | ||||
| 2025-08-14 | 13F | Mariner, LLC | 2.741 | -15,77 | 219 | -22,42 | ||||
| 2025-08-12 | 13F | J.w. Cole Advisors, Inc. | 2.893 | -0,79 | 231 | -8,33 | ||||
| 2025-07-24 | 13F | Blair William & Co/il | 60 | 0,00 | 5 | -20,00 | ||||
| 2025-08-06 | 13F | Commonwealth Equity Services, Llc | 11.944 | -30,77 | 1 | -100,00 | ||||
| 2025-08-08 | 13F | Fortis Group Advisors, LLC | 100 | 0,00 | 8 | -12,50 | ||||
| 2025-07-21 | 13F | Crews Bank & Trust | 100 | 0,00 | 8 | -12,50 | ||||
| 2025-08-13 | 13F | Northwestern Mutual Wealth Management Co | 2.641 | -18,89 | 211 | -25,53 | ||||
| 2025-08-13 | 13F | Summit Wealth Group Llc / Co | 4.582 | 366 | ||||||
| 2025-07-30 | 13F | Whittier Trust Co Of Nevada Inc | 4.130 | 0,00 | 330 | -7,84 | ||||
| 2025-08-14 | 13F | MGB Wealth Management, LLC | 21.110 | -0,15 | 1.686 | -7,92 | ||||
| 2025-05-06 | 13F | Assetmark, Inc | 0 | -100,00 | 0 | |||||
| 2025-05-06 | 13F | Venturi Wealth Management, LLC | 0 | -100,00 | 0 | |||||
| 2025-08-01 | 13F | Envestnet Asset Management Inc | 19.547 | 5,62 | 1.561 | -2,56 | ||||
| 2025-09-04 | 13F/A | Advisor Group Holdings, Inc. | 6.819 | -14,42 | 547 | -20,72 | ||||
| 2025-08-15 | 13F | Tower Research Capital LLC (TRC) | 4.680 | 102,95 | 374 | 87,44 | ||||
| 2025-07-18 | 13F | Institute for Wealth Management, LLC. | 12.769 | -0,77 | 1.020 | -8,53 | ||||
| 2025-08-07 | 13F | Commerce Bank | 0 | -100,00 | 0 | |||||
| 2025-07-22 | 13F | Valley National Advisers Inc | 2.179 | -7,75 | 0 | |||||
| 2025-08-01 | 13F | Rossby Financial, LCC | 161 | 0,00 | 13 | 0,00 | ||||
| 2025-05-09 | 13F | Commonwealth Retirement Investments LLC | 0 | -100,00 | 0 | |||||
| 2025-07-29 | 13F | Dumont & Blake Investment Advisors Llc | 19.167 | -0,38 | 1.531 | -8,16 | ||||
| 2025-08-11 | 13F | Aptus Capital Advisors, LLC | 204 | 0,49 | 16 | -5,88 | ||||
| 2025-08-12 | 13F | CIBC Private Wealth Group, LLC | 2.200 | 0,00 | 176 | 6,06 | ||||
| 2025-08-18 | 13F/A | National Bank Of Canada /fi/ | 71 | 0,00 | 6 | -16,67 | ||||
| 2025-08-14 | 13F | Raymond James Financial Inc | 10.014 | -2,83 | 800 | -10,43 | ||||
| 2025-08-11 | 13F | Principal Securities, Inc. | 0 | -100,00 | 0 | |||||
| 2025-08-05 | 13F | Obermeyer Wood Investment Counsel, Lllp | 3.700 | 0,00 | 296 | -7,81 | ||||
| 2025-07-30 | 13F | Pacific Sun Financial Corp | 0 | -100,00 | 0 | |||||
| 2025-08-05 | 13F | Bank Of Montreal /can/ | 619 | 0,00 | 49 | -7,55 | ||||
| 2025-08-14 | 13F | Ameriprise Financial Inc | 3.892 | -69,48 | 311 | -72,12 | ||||
| 2025-07-23 | 13F | 1 North Wealth Services Llc | 31 | 0,00 | 2 | 0,00 | ||||
| 2025-07-08 | 13F | Parallel Advisors, LLC | 16 | 0,00 | 1 | 0,00 | ||||
| 2025-07-14 | 13F | Armstrong Advisory Group, Inc | 60 | 0,00 | 5 | 0,00 | ||||
| 2025-08-11 | 13F | Delta Asset Management Llc/tn | 25 | 0,00 | 2 | -50,00 | ||||
| 2025-08-12 | 13F | Park Square Financial Group, LLC | 1.050 | 5,00 | 84 | -3,49 | ||||
| 2025-08-15 | 13F | Captrust Financial Advisors | 2.534 | 0,00 | 202 | -7,76 | ||||
| 2025-08-04 | 13F | Spire Wealth Management | 52 | -93,99 | 4 | -94,59 | ||||
| 2025-08-12 | 13F | Jpmorgan Chase & Co | 1.186 | -72,43 | 95 | -74,73 | ||||
| 2025-08-07 | 13F | Allworth Financial LP | 2.731 | -0,26 | 218 | 0,46 | ||||
| 2025-08-06 | 13F | Nicholas Hoffman & Company, LLC. | 3.475 | 0,00 | 278 | -7,67 | ||||
| 2025-08-11 | 13F | Ritter Daniher Financial Advisory LLC / DE | 250 | 0,00 | 20 | -9,52 | ||||
| 2025-08-14 | 13F | Colony Group, LLC | 5.907 | 0,00 | 472 | -7,83 | ||||
| 2025-08-14 | 13F | UBS Group AG | 40.203 | 11,09 | 3.211 | 2,46 | ||||
| 2025-07-22 | 13F | Apexium Financial, Lp | 3.146 | 0,00 | 251 | -7,72 | ||||
| 2025-08-12 | 13F | Proequities, Inc. | 0 | 0 | ||||||
| 2025-08-08 | 13F | Pnc Financial Services Group, Inc. | 1.025 | 0,00 | 82 | -7,95 | ||||
| 2025-07-21 | 13F | Ashton Thomas Securities, Llc | 55 | 0,00 | 4 | 0,00 | ||||
| 2025-08-14 | 13F | Fmr Llc | 899 | -53,18 | 72 | -57,23 | ||||
| 2025-07-01 | 13F | Harbor Investment Advisory, Llc | 150 | 0,00 | 12 | -8,33 | ||||
| 2025-08-07 | 13F/A | Joseph Group Capital Management | 21.242 | 9,86 | 1.697 | 1,31 | ||||
| 2025-08-14 | 13F | Two Sigma Investments, Lp | 0 | -100,00 | 0 | |||||
| 2025-07-24 | 13F | Horizon Bancorp Inc /in/ | 148 | 0,00 | 0 | |||||
| 2025-07-28 | 13F | Harbour Investments, Inc. | 429 | -56,18 | 34 | -59,52 | ||||
| 2025-08-12 | 13F | MAI Capital Management | 198 | 0,00 | 16 | -11,76 | ||||
| 2025-08-14 | 13F | Citadel Advisors Llc | 0 | -100,00 | 0 | |||||
| 2025-07-18 | 13F | Trilogy Capital Inc. | 16.655 | 3.659,59 | 1.330 | 3.930,30 | ||||
| 2025-08-15 | 13F | Morgan Stanley | 39.267 | -14,74 | 3.136 | -21,38 | ||||
| 2025-07-31 | 13F | Buckingham Strategic Partners | 0 | -100,00 | 0 | |||||
| 2025-08-19 | 13F | Asset Dedication, LLC | 13 | 0,00 | 1 | 0,00 | ||||
| 2025-05-08 | 13F | Us Bancorp \de\ | 0 | -100,00 | 0 | |||||
| 2025-08-06 | 13F | AE Wealth Management LLC | 717 | 21,53 | 57 | 11,76 | ||||
| 2025-08-11 | 13F | FSA Wealth Management LLC | 62 | 0,00 | 5 | -20,00 | ||||
| 2025-07-23 | 13F | Element Wealth, LLC | 4.425 | -0,72 | 353 | -8,55 | ||||
| 2025-07-21 | 13F | DHJJ Financial Advisors, Ltd. | 346 | 28 | ||||||
| 2025-08-06 | 13F | Atlantic Union Bankshares Corp | 17 | 1 | ||||||
| 2025-08-14 | 13F | Peak Asset Management, LLC | 136.156 | 2,51 | 10.875 | -5,47 | ||||
| 2025-08-13 | 13F | Jones Financial Companies Lllp | 2.983 | 14,29 | 238 | 8,22 | ||||
| 2025-08-01 | 13F | Gwn Securities Inc. | 0 | -100,00 | 0 | |||||
| 2025-07-22 | 13F | Grimes & Company, Inc. | 0 | -100,00 | 0 | |||||
| 2025-08-06 | 13F | Stonebridge Financial Planning Group, LLC | 3.784 | 0,05 | 302 | -7,65 | ||||
| 2025-08-08 | 13F | Creative Planning | 2.760 | 0,07 | 220 | -7,56 | ||||
| 2025-07-14 | 13F | GAMMA Investing LLC | 428 | 0,00 | 34 | -8,11 |