Grundlæggende statistik
| Institutionelle ejere | 72 total, 72 long only, 0 short only, 0 long/short - change of -7,69% MRQ |
| Gennemsnitlig porteføljeallokering | 0.0278 % - change of 0,76% MRQ |
| Institutionelle aktier (lange) | 3.098.931 (ex 13D/G) - change of -0,26MM shares -7,86% MRQ |
| Institutionel værdi (lang) | $ 72.653 USD ($1000) |
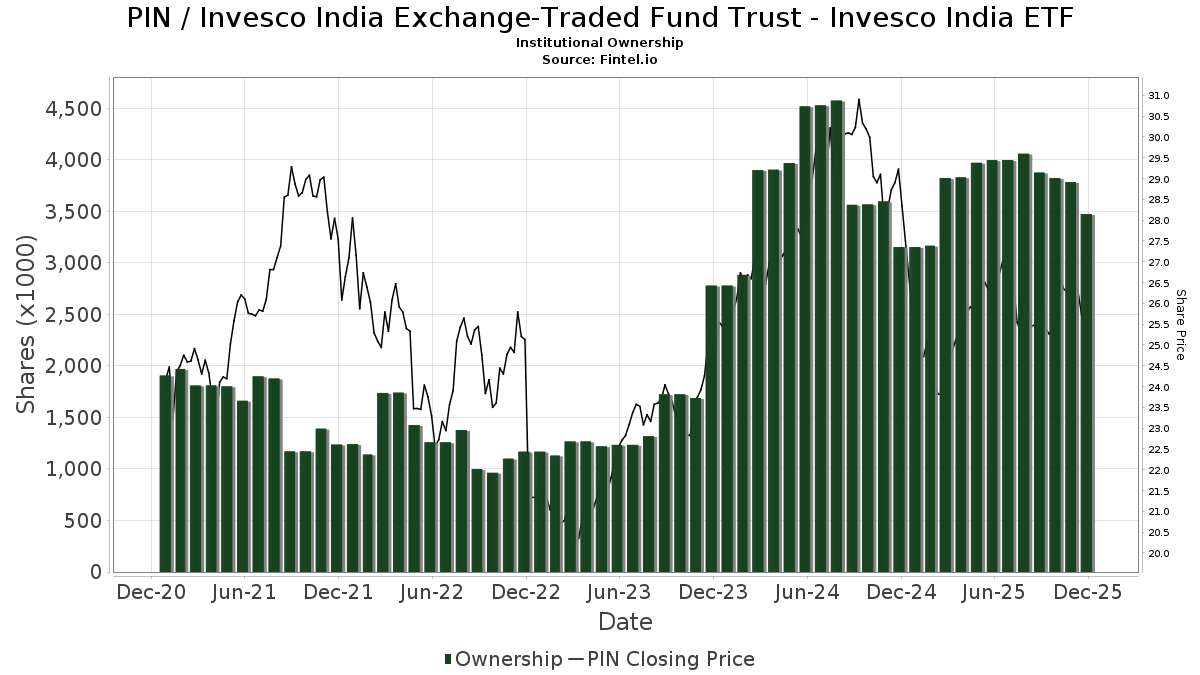
Institutionelt ejerskab og aktionærer
Invesco India Exchange-Traded Fund Trust - Invesco India ETF (US:PIN) har 72 institutionelle ejere og aktionærer, der har indsendt 13D/G- eller 13F-formularer til Securities Exchange Commission (SEC). Disse institutioner har i alt 3,098,931 aktier. Største aktionærer omfatter Bank Of America Corp /de/, McAdam, LLC, Morgan Stanley, Ameriprise Financial Inc, Arvest Investments, Inc., Wells Fargo & Company/mn, LPL Financial LLC, Jane Street Group, Llc, Brinker Capital Investments, LLC, and Sei Investments Co .
Invesco India Exchange-Traded Fund Trust - Invesco India ETF (ARCA:PIN) institutionel ejerskabsstruktur viser aktuelle positioner i virksomheden efter institutioner og fonde, samt seneste ændringer i positionsstørrelse. Større aktionærer kan omfatte individuelle investorer, investeringsforeninger, hedgefonde eller institutioner. Skema 13D angiver, at investoren besidder (eller besidder) mere end 5 % af virksomheden og har til hensigt (eller har til hensigt at) aktivt at forfølge en ændring i forretningsstrategi. Skema 13G indikerer en passiv investering på over 5%.
The share price as of February 20, 2026 is 23,98 / share. Previously, on April 21, 2025, the share price was 25,73 / share. This represents a decline of 6,80% over that period.
Fondens stemningsscore
Fund Sentiment Score (fka Ownership Accumulation Score) finder de aktier, der bliver mest købt af fonde. Det er resultatet af en sofistikeret, multi-faktor kvantitativ model, der identificerer virksomheder med de højeste niveauer af institutionel akkumulering. Scoringsmodellen bruger en kombination af den samlede stigning i oplyste ejere, ændringerne i porteføljeallokeringer i disse ejere og andre målinger. Tallet går fra 0 til 100, hvor højere tal indikerer et højere niveau af akkumulering for sine jævnaldrende, og 50 er gennemsnittet.
Opdateringsfrekvens: Dagligt
Se Ownership Explorer, som giver en liste over højest rangerende virksomheder.
AI+ Ask Fintel’s AI assistant about Invesco India Exchange-Traded Fund Trust - Invesco India ETF.
Select a question to share a public post with an AI-crafted answer.
Thinking of good questions…
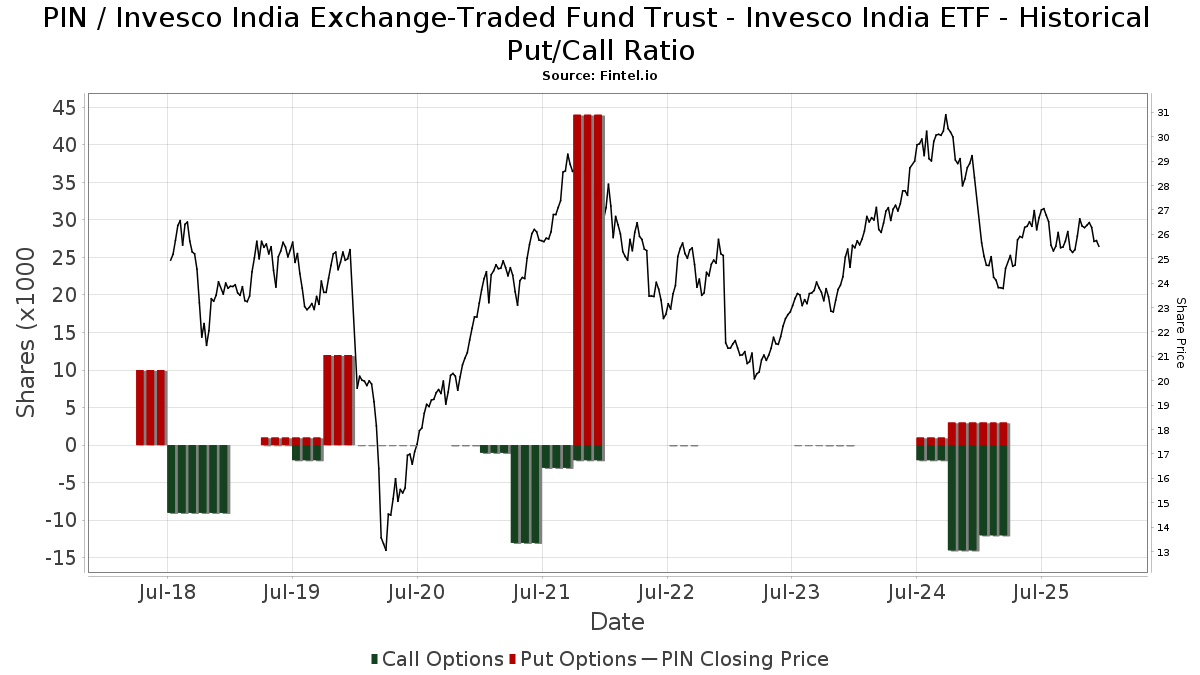
Institutionel Put/Call-forhold
Ud over at indberette standardaktie- og gældsudstedelser skal institutter med mere end 100 mill. aktiver under forvaltning også oplyse deres put- og call-optionsbeholdninger. Da salgsoptioner generelt indikerer negativ stemning, og købsoptioner indikerer positiv stemning, kan vi få en fornemmelse af den overordnede institutionelle stemning ved at plotte forholdet mellem put og kald. Diagrammet til højre viser det historiske put/call-forhold for dette instrument.
Brug af Put/Call Ratio som en indikator for investorernes stemning overvinder en af de vigtigste mangler ved at bruge totalt institutionelt ejerskab, som er, at en betydelig mængde af aktiver under forvaltning investeres passivt for at spore indekser. Passivt forvaltede fonde køber typisk ikke optioner, så indikatoren for put/call-forholdet følger mere nøje følelsen af aktivt forvaltede fonde.
13F og NPORT arkivering
Detaljer om 13F-arkivering er gratis. Detaljer om NP-ansøgninger kræver et premium-medlemskab. Grønne rækker angiver nye positioner. Røde rækker angiver lukkede positioner. Klik på linket ikon for at se den fulde transaktionshistorik.
Opgrader
for at låse premium-data op og eksportere til Excel ![]() .
.
| Fil dato | Kilde | Investor | Type | Gennemsnitlig pris (Øst) |
Aktier | Δ Aktier (%) |
Rapporteret Værdi ($1000) |
Δ Værdi (%) |
Port Alloc (%) |
|
|---|---|---|---|---|---|---|---|---|---|---|
| 2025-11-14 | 13F | Binnacle Investments Inc | 701 | 0,00 | 18 | -5,56 | ||||
| 2025-10-29 | 13F | Nordwand Advisors, LLC | 0 | -100,00 | 0 | |||||
| 2025-11-12 | 13F | Simplex Trading, Llc | 0 | -100,00 | 0 | |||||
| 2026-02-05 | 13F | Cambridge Investment Research Advisors, Inc. | 10.418 | -2,97 | 0 | |||||
| 2026-02-12 | 13F | Federation des caisses Desjardins du Quebec | 1.150 | 0,00 | 28 | -3,57 | ||||
| 2026-04-06 | 13F | GAMMA Investing LLC | 0 | -100,00 | 0 | |||||
| 2026-02-12 | 13F | Principal Securities, Inc. | 0 | -100,00 | 0 | |||||
| 2026-02-13 | 13F | Morgan Stanley | 232.830 | 0,48 | 5.660 | -2,56 | ||||
| 2026-01-27 | 13F | Checchi Capital Advisers, LLC | 18.975 | -24,05 | 461 | -26,36 | ||||
| 2026-02-06 | 13F | HighTower Advisors, LLC | 0 | -100,00 | 0 | |||||
| 2026-02-13 | 13F | Neuberger Berman Group LLC | 67.148 | 0,21 | 1.632 | -2,80 | ||||
| 2026-02-17 | 13F | Russell Investments Group, Ltd. | 146 | 0,00 | 4 | 0,00 | ||||
| 2025-11-14 | 13F | Equitable Holdings, Inc. | 0 | -100,00 | 0 | |||||
| 2026-02-13 | 13F | Sei Investments Co | 72.042 | -3,34 | 1.751 | -6,26 | ||||
| 2025-11-13 | 13F | Riggs Asset Managment Co. Inc. | 0 | -100,00 | 0 | |||||
| 2026-02-13 | 13F | Golden State Wealth Management, LLC | 264 | 6,02 | 6 | 0,00 | ||||
| 2026-02-13 | 13F | Resources Investment Advisors, LLC. | 15.695 | -10,32 | 382 | -13,01 | ||||
| 2026-02-12 | 13F | Sepio Capital, LP | 44.851 | 7,39 | 1.090 | 4,11 | ||||
| 2025-11-12 | 13F | Stifel Financial Corp | 0 | -100,00 | 0 | |||||
| 2026-04-13 | 13F | IFP Advisors, Inc | 100 | 0,00 | 2 | 0,00 | ||||
| 2026-01-23 | 13F | Westside Investment Management, Inc. | 116 | 3 | ||||||
| 2026-02-17 | 13F | Old Mission Capital Llc | 16.659 | 405 | ||||||
| 2026-04-03 | 13F | Adirondack Trust Co | 0 | -100,00 | 0 | -100,00 | ||||
| 2026-04-08 | 13F | Sharper & Granite LLC | 10.380 | -17,72 | 213 | -30,39 | ||||
| 2026-04-14 | 13F | Nbc Securities, Inc. | 104 | 0,00 | 2 | 0,00 | ||||
| 2026-02-12 | 13F | Brinker Capital Investments, LLC | 77.804 | -6,20 | 1.891 | -9,04 | ||||
| 2026-02-10 | 13F | IAG Wealth Partners, LLC | 1.195 | 7,46 | 29 | 7,41 | ||||
| 2026-02-17 | 13F | Raymond James Financial Inc | 22.739 | -2,95 | 553 | -5,96 | ||||
| 2026-02-17 | 13F | Citadel Advisors Llc | 45.921 | -4,69 | 1.116 | -7,54 | ||||
| 2026-01-05 | 13F | Union Bancaire Privee, UBP SA | 0 | -100,00 | 0 | |||||
| 2026-02-12 | 13F | Collier Financial | 0 | -100,00 | 0 | |||||
| 2026-02-05 | 13F | Bessemer Group Inc | 124 | 0,00 | 0 | |||||
| 2025-11-03 | 13F | Truist Financial Corp | 0 | -100,00 | 0 | |||||
| 2026-01-26 | 13F | Yoffe Investment Management, LLC | 16.402 | 0,00 | 399 | -3,16 | ||||
| 2026-02-12 | 13F | Steward Partners Investment Advisory, Llc | 1.923 | 491,69 | 47 | 475,00 | ||||
| 2026-02-13 | 13F | Kestra Advisory Services, LLC | 0 | -100,00 | 0 | |||||
| 2026-02-10 | 13F | Envestnet Asset Management Inc | 17.834 | 1,86 | 434 | -1,14 | ||||
| 2026-02-13 | 13F | McAdam, LLC | 292.967 | 24,43 | 7.122 | 20,67 | ||||
| 2026-02-11 | 13F | LPL Financial LLC | 126.348 | -39,81 | 3.072 | -41,64 | ||||
| 2026-02-17 | 13F | Wiley Bros.-aintree Capital, Llc | 59.057 | 1,44 | 1.436 | -1,64 | ||||
| 2026-02-13 | 13F | Citigroup Inc | 1.614 | -82,86 | 39 | -83,47 | ||||
| 2026-01-26 | 13F | Cwm, Llc | 69 | -26,60 | 0 | |||||
| 2026-02-13 | 13F | Flow Traders U.s. Llc | 60.131 | -33,53 | 1 | -50,00 | ||||
| 2026-02-10 | 13F/A | Northwestern Mutual Wealth Management Co | 3.503 | 1,48 | 85 | -1,16 | ||||
| 2026-02-17 | 13F | Consultiva Wealth Management, Corp. | 115 | 0,00 | 3 | 0,00 | ||||
| 2026-02-11 | 13F | Strategic Advocates LLC | 1 | 0 | ||||||
| 2026-02-17 | 13F | Royal Bank Of Canada | 35.359 | -11,32 | 859 | -14,01 | ||||
| 2026-01-27 | 13F | TD Waterhouse Canada Inc. | 88 | -87,21 | 2 | -88,24 | ||||
| 2026-02-12 | 13F | Commonwealth Equity Services, Llc | 32.830 | 9,48 | 798 | |||||
| 2026-02-17 | 13F | Ameriprise Financial Inc | 227.751 | 2,80 | 5.537 | -0,34 | ||||
| 2026-01-26 | 13F | Whittier Trust Co Of Nevada Inc | 63 | 0,00 | 2 | 0,00 | ||||
| 2026-02-13 | 13F | National Bank Of Canada /fi/ | 1.375 | 0,00 | 33 | -2,94 | ||||
| 2026-02-14 | 13F | Rockefeller Capital Management L.P. | 200 | -34,64 | 5 | -42,86 | ||||
| 2025-11-12 | 13F | Clare Market Investments LLC | 13.242 | 64,66 | 332 | 53,24 | ||||
| 2026-04-08 | 13F | Wealth Enhancement Advisory Services, Llc | 0 | -100,00 | 0 | |||||
| 2026-04-07 | 13F | Farther Finance Advisors, LLC | 1.521 | -40,35 | 31 | -49,18 | ||||
| 2025-10-22 | 13F | Daymark Wealth Partners, Llc | 0 | -100,00 | 0 | |||||
| 2026-02-09 | 13F | Harbour Investments, Inc. | 2 | 0 | ||||||
| 2026-02-09 | 13F | Hartland & Co., LLC | 86 | 7,50 | 2 | 0,00 | ||||
| 2026-02-13 | 13F | Smartleaf Asset Management LLC | 203 | 5 | ||||||
| 2026-02-06 | 13F | GPS Wealth Strategies Group, LLC | 0 | -100,00 | 0 | |||||
| 2026-02-17 | 13F | National Asset Management, Inc. | 50.615 | 1.230 | ||||||
| 2025-10-22 | 13F | Geneos Wealth Management Inc. | 0 | -100,00 | 0 | -100,00 | ||||
| 2026-01-26 | 13F | Washington Growth Strategies Llc | 11.163 | 0,00 | 271 | -2,87 | ||||
| 2026-02-11 | 13F | Parallel Advisors, LLC | 10 | 0,00 | 0 | |||||
| 2026-04-08 | 13F | Birchbrook, Inc. | 227 | 0,00 | 5 | -20,00 | ||||
| 2026-02-13 | 13F | Pinnacle Wealth Planning Services, Inc. | 150 | 4 | ||||||
| 2026-02-17 | 13F | Advisor Group Holdings, Inc. | 12.452 | -24,84 | 303 | -27,23 | ||||
| 2026-02-13 | 13F | Wells Fargo & Company/mn | 153.936 | -2,70 | 3.742 | -5,65 | ||||
| 2026-01-30 | 13F | Bogart Wealth, LLC | 38 | 0,00 | 1 | |||||
| 2026-02-12 | 13F | Jane Street Group, Llc | 121.787 | -26,92 | 2.961 | -29,15 | ||||
| 2026-02-13 | 13F | Integrated Wealth Concepts LLC | 59.863 | 4,44 | 1.455 | 1,32 | ||||
| 2026-02-17 | 13F | Jones Financial Companies Lllp | 24.194 | -10,25 | 588 | -13,27 | ||||
| 2026-02-17 | 13F | Cetera Investment Advisers | 68.000 | 8,05 | 1.653 | 4,82 | ||||
| 2026-02-17 | 13F | Private Advisor Group, LLC | 30.422 | 84,89 | 740 | 79,37 | ||||
| 2026-02-05 | 13F | Allworth Financial LP | 1 | -99,93 | 0 | -100,00 | ||||
| 2026-01-16 | 13F | Ronald Blue Trust, Inc. | 32.855 | -6,16 | 799 | -9,01 | ||||
| 2026-02-13 | 13F | MAI Capital Management | 58 | 0,00 | 1 | 0,00 | ||||
| 2026-04-14 | 13F | Arvest Investments, Inc. | 197.842 | 41,87 | 4.062 | 19,79 | ||||
| 2025-11-14 | 13F | Mpwm Advisory Solutions, Llc | 0 | -100,00 | 0 | |||||
| 2026-02-17 | 13F | Bank Of America Corp /de/ | 695.041 | -1,14 | 16.896 | -4,14 | ||||
| 2026-02-13 | 13F | Ieq Capital, Llc | 29.525 | 0,00 | 718 | -3,11 | ||||
| 2026-01-27 | 13F | Krilogy Financial LLC | 0 | -100,00 | 0 | |||||
| 2026-02-13 | 13F | Barclays Plc | 0 | -100,00 | 0 | |||||
| 2026-02-06 | 13F | Global Retirement Partners, LLC | 13.003 | 147,68 | 316 | 141,22 | ||||
| 2026-02-13 | 13F | Mml Investors Services, Llc | 21.820 | -93,63 | 530 | -93,83 | ||||
| 2025-11-07 | 13F | Fifth Third Bancorp | 0 | -100,00 | 0 | -100,00 | ||||
| 2026-04-13 | 13F | Creative Financial Designs Inc /adv | 169 | 0,00 | 3 | -25,00 | ||||
| 2026-02-17 | 13F | Fmr Llc | 2.286 | -1,00 | 56 | -3,51 | ||||
| 2026-04-15 | 13F | Weatherly Asset Management L. P. | 38.866 | 17,77 | 798 | -0,62 | ||||
| 2026-01-29 | 13F | Comerica Bank | 1.088 | -1,54 | 26 | -3,70 | ||||
| 2026-02-18 | 13F | GWM Advisors LLC | 571 | 6,13 | 14 | 0,00 | ||||
| 2026-02-19 | 13F | Invesco Ltd. | 0 | -100,00 | 0 | |||||
| 2026-01-29 | 13F | UBS Group AG | 903 | -67,33 | 22 | -69,57 | ||||
| 2025-11-20 | 13F | Centaurus Financial, Inc. | 0 | -100,00 | 0 | |||||
| 2025-11-06 | 13F | Ameritas Advisory Services, LLC | 0 | -100,00 | 0 | |||||
| 2026-02-17 | 13F | Advisory Services Network, LLC | 0 | -100,00 | 0 |
Other Listings
| US:IMVP | 22,46 $ |