Grundlæggende statistik
| Institutionelle ejere | 65 total, 65 long only, 0 short only, 0 long/short - change of 1,54% MRQ |
| Gennemsnitlig porteføljeallokering | 0.4384 % - change of 3,71% MRQ |
| Institutionelle aktier (lange) | 14.449.720 (ex 13D/G) - change of -0,19MM shares -1,29% MRQ |
| Institutionel værdi (lang) | $ 272.332 USD ($1000) |
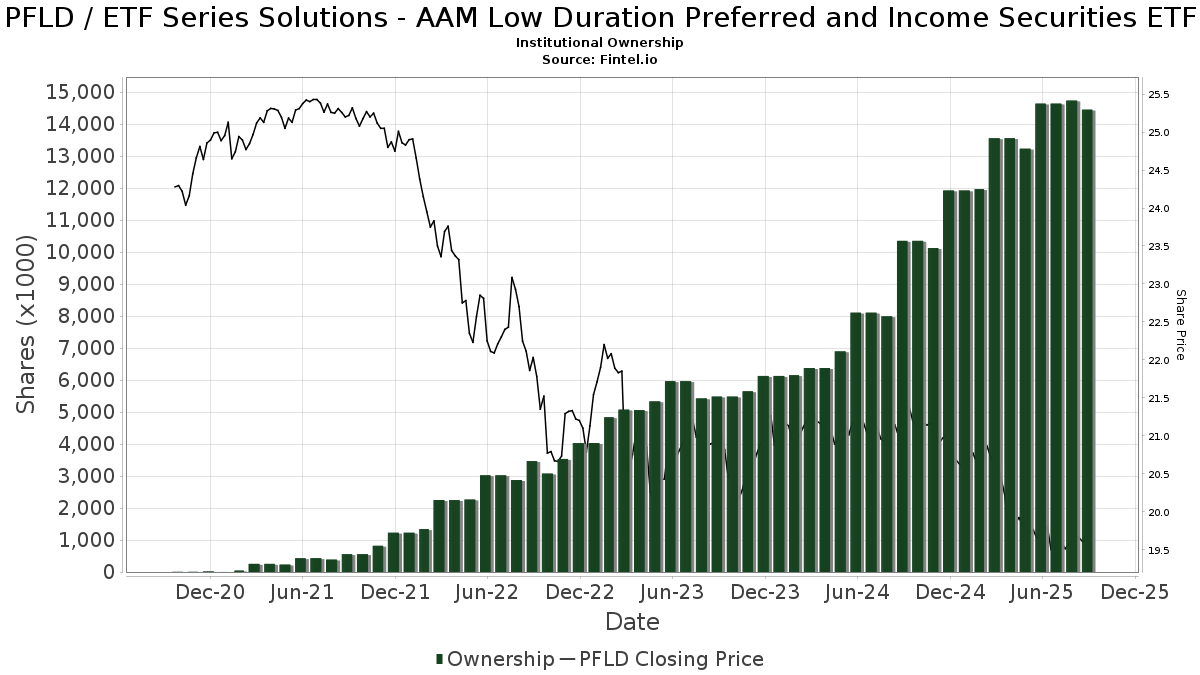
Institutionelt ejerskab og aktionærer
ETF Series Solutions - AAM Low Duration Preferred and Income Securities ETF (US:PFLD) har 65 institutionelle ejere og aktionærer, der har indsendt 13D/G- eller 13F-formularer til Securities Exchange Commission (SEC). Disse institutioner har i alt 14,449,720 aktier. Største aktionærer omfatter Morgan Stanley, Wells Fargo & Company/mn, LPL Financial LLC, Rainey & Randall Investment Management Inc., Raymond James Financial Inc, Advisor Group Holdings, Inc., Royal Bank Of Canada, Cambridge Investment Research Advisors, Inc., YFYA - Yields for You Income Strategy A ETF, and Sound Income Strategies, LLC .
ETF Series Solutions - AAM Low Duration Preferred and Income Securities ETF (ARCA:PFLD) institutionel ejerskabsstruktur viser aktuelle positioner i virksomheden efter institutioner og fonde, samt seneste ændringer i positionsstørrelse. Større aktionærer kan omfatte individuelle investorer, investeringsforeninger, hedgefonde eller institutioner. Skema 13D angiver, at investoren besidder (eller besidder) mere end 5 % af virksomheden og har til hensigt (eller har til hensigt at) aktivt at forfølge en ændring i forretningsstrategi. Skema 13G indikerer en passiv investering på over 5%.
The share price as of September 11, 2025 is 19,71 / share. Previously, on September 12, 2024, the share price was 21,23 / share. This represents a decline of 7,16% over that period.
Fondens stemningsscore
Fund Sentiment Score (fka Ownership Accumulation Score) finder de aktier, der bliver mest købt af fonde. Det er resultatet af en sofistikeret, multi-faktor kvantitativ model, der identificerer virksomheder med de højeste niveauer af institutionel akkumulering. Scoringsmodellen bruger en kombination af den samlede stigning i oplyste ejere, ændringerne i porteføljeallokeringer i disse ejere og andre målinger. Tallet går fra 0 til 100, hvor højere tal indikerer et højere niveau af akkumulering for sine jævnaldrende, og 50 er gennemsnittet.
Opdateringsfrekvens: Dagligt
Se Ownership Explorer, som giver en liste over højest rangerende virksomheder.
Institutionel Put/Call-forhold
Ud over at indberette standardaktie- og gældsudstedelser skal institutter med mere end 100 mill. aktiver under forvaltning også oplyse deres put- og call-optionsbeholdninger. Da salgsoptioner generelt indikerer negativ stemning, og købsoptioner indikerer positiv stemning, kan vi få en fornemmelse af den overordnede institutionelle stemning ved at plotte forholdet mellem put og kald. Diagrammet til højre viser det historiske put/call-forhold for dette instrument.
Brug af Put/Call Ratio som en indikator for investorernes stemning overvinder en af de vigtigste mangler ved at bruge totalt institutionelt ejerskab, som er, at en betydelig mængde af aktiver under forvaltning investeres passivt for at spore indekser. Passivt forvaltede fonde køber typisk ikke optioner, så indikatoren for put/call-forholdet følger mere nøje følelsen af aktivt forvaltede fonde.
13F og NPORT arkivering
Detaljer om 13F-arkivering er gratis. Detaljer om NP-ansøgninger kræver et premium-medlemskab. Grønne rækker angiver nye positioner. Røde rækker angiver lukkede positioner. Klik på linket ikon for at se den fulde transaktionshistorik.
Opgrader
for at låse premium-data op og eksportere til Excel ![]() .
.
| Fil dato | Kilde | Investor | Type | Gennemsnitlig pris (Øst) |
Aktier | Δ Aktier (%) |
Rapporteret Værdi ($1000) |
Δ Værdi (%) |
Port Alloc (%) |
|
|---|---|---|---|---|---|---|---|---|---|---|
| 2025-08-14 | 13F | GWM Advisors LLC | 449 | 0,00 | 9 | -11,11 | ||||
| 2025-09-04 | 13F/A | Advisor Group Holdings, Inc. | 406.147 | 23,95 | 7.965 | 20,32 | ||||
| 2025-07-24 | 13F | IFP Advisors, Inc | 48.686 | 0,83 | 955 | -2,15 | ||||
| 2025-08-28 | NP | YFYA - Yields for You Income Strategy A ETF | 267.749 | 3,01 | 5.251 | 0,00 | ||||
| 2025-08-12 | 13F | Gladstone Institutional Advisory LLC | 15.981 | -69,91 | 313 | -70,80 | ||||
| 2025-08-12 | 13F | Global Retirement Partners, LLC | 133 | 3 | ||||||
| 2025-08-12 | 13F | Proequities, Inc. | 0 | 0 | ||||||
| 2025-08-11 | 13F | Principal Securities, Inc. | 20.867 | 44,31 | 409 | 37,71 | ||||
| 2025-07-30 | 13F | Bleakley Financial Group, LLC | 122.398 | 17,77 | 2.400 | 14,34 | ||||
| 2025-05-12 | 13F | Fmr Llc | 0 | -100,00 | 0 | |||||
| 2025-05-14 | 13F | Mml Investors Services, Llc | 0 | -100,00 | 0 | |||||
| 2025-07-17 | 13F | HB Wealth Management, LLC | 0 | -100,00 | 0 | |||||
| 2025-08-08 | 13F | Rockefeller Capital Management L.P. | 0 | -100,00 | 0 | |||||
| 2025-08-08 | 13F | Foundations Investment Advisors, LLC | 11.253 | 221 | ||||||
| 2025-05-06 | 13F | AE Wealth Management LLC | 0 | -100,00 | 0 | |||||
| 2025-08-01 | 13F | Envestnet Asset Management Inc | 77.173 | 16,04 | 1.513 | 12,66 | ||||
| 2025-08-19 | 13F | Advisory Services Network, LLC | 0 | -100,00 | 0 | |||||
| 2025-08-08 | 13F | Creative Planning | 16.800 | 0,00 | 329 | -2,95 | ||||
| 2025-08-11 | 13F | Hexagon Capital Partners LLC | 0 | -100,00 | 0 | |||||
| 2025-08-07 | 13F | Allworth Financial LP | 533 | 0,00 | 10 | 0,00 | ||||
| 2025-08-12 | 13F | Blueprint Investment Partners LLC | 0 | -100,00 | 0 | |||||
| 2025-08-14 | 13F | Gotham Asset Management, LLC | 113.924 | 89,60 | 2.234 | 84,17 | ||||
| 2025-08-14 | 13F | CoreCap Advisors, LLC | 100 | 0,00 | 2 | -50,00 | ||||
| 2025-07-25 | 13F | Cwm, Llc | 50 | 0 | ||||||
| 2025-07-07 | 13F | Thurston, Springer, Miller, Herd & Titak, Inc. | 8.292 | 0,00 | 163 | -2,99 | ||||
| 2025-08-12 | 13F | Cornerstone Wealth Management, LLC | 12.250 | -10,94 | 240 | -13,36 | ||||
| 2025-08-12 | 13F | Steward Partners Investment Advisory, Llc | 15.404 | -2,39 | 302 | -5,03 | ||||
| 2025-07-17 | 13F | Janney Montgomery Scott LLC | 89.316 | 4,59 | 2 | 0,00 | ||||
| 2025-08-07 | 13F | CSM Advisors, LLC | 25.000 | 0,00 | 0 | |||||
| 2025-08-14 | 13F | Royal Bank Of Canada | 354.838 | -17,22 | 6.959 | -19,63 | ||||
| 2025-07-25 | 13F | Atria Wealth Solutions, Inc. | 15.903 | -12,96 | 314 | -15,63 | ||||
| 2025-09-09 | 13F | NWF Advisory Services Inc. | 0 | -100,00 | 0 | |||||
| 2025-08-07 | 13F | Curtis Advisory Group, LLC | 134.624 | 0,00 | 2.640 | -2,94 | ||||
| 2025-05-05 | 13F | Transce3nd, LLC | 0 | -100,00 | 0 | |||||
| 2025-08-14 | 13F | Goldman Sachs Group Inc | 20.808 | 408 | ||||||
| 2025-07-15 | 13F | Oregon Pacific Wealth Management, LLC | 18.985 | -3,46 | 372 | -6,30 | ||||
| 2025-07-09 | 13F | Massmutual Trust Co Fsb/adv | 2.097 | 41 | ||||||
| 2025-08-14 | 13F | Susquehanna International Group, Llp | 0 | -100,00 | 0 | |||||
| 2025-07-17 | 13F | Sound Income Strategies, LLC | 258.113 | -0,93 | 5.062 | -3,82 | ||||
| 2025-05-15 | 13F | National Wealth Management Group, LLC | 37.373 | 15,98 | 755 | 13,90 | ||||
| 2025-08-15 | 13F | Morgan Stanley | 5.158.182 | -9,20 | 101.152 | -11,86 | ||||
| 2025-08-06 | 13F | Wedbush Securities Inc | 39.575 | 11,71 | 1 | |||||
| 2025-08-14 | 13F | Citadel Advisors Llc | 27.813 | 545 | ||||||
| 2025-08-14 | 13F | Stifel Financial Corp | 170.215 | -40,29 | 3.338 | -42,05 | ||||
| 2025-07-21 | 13F | Ameritas Advisory Services, LLC | 26.883 | 18,62 | 527 | 13,33 | ||||
| 2025-04-10 | 13F | Key Client Fiduciary Advisors, LLC | 0 | -100,00 | 0 | |||||
| 2025-08-08 | 13F | Kingsview Wealth Management, LLC | 10.564 | -3,74 | 207 | -6,33 | ||||
| 2025-07-31 | 13F | Cambridge Investment Research Advisors, Inc. | 287.444 | -4,40 | 6 | -16,67 | ||||
| 2025-08-05 | 13F | Bank Of Montreal /can/ | 10.000 | 0,00 | 196 | -2,97 | ||||
| 2025-08-14 | 13F | Raymond James Financial Inc | 585.692 | -0,05 | 11.485 | -2,97 | ||||
| 2025-08-15 | 13F | Prevail Innovative Wealth Advisors, Llc | 83.901 | 0,14 | 1.645 | -2,78 | ||||
| 2025-08-14 | 13F | Warren Averett Asset Management, LLC | 0 | -100,00 | 0 | |||||
| 2025-08-14 | 13F | Comerica Bank | 14.901 | -17,38 | 292 | -19,78 | ||||
| 2025-08-14 | 13F | UBS Group AG | 48.041 | 942 | ||||||
| 2025-08-20 | 13F/A | Coppell Advisory Solutions LLC | 54.875 | -27,58 | 1.076 | -28,81 | ||||
| 2025-08-14 | 13F | Integrated Wealth Concepts LLC | 14.124 | 0,89 | 277 | -2,13 | ||||
| 2025-07-10 | 13F | Wealth Enhancement Advisory Services, Llc | 164.770 | 79,82 | 3.223 | 74,16 | ||||
| 2025-08-14 | 13F | Wells Fargo & Company/mn | 2.651.784 | 16,81 | 52.001 | 13,40 | ||||
| 2025-08-14 | 13F | Hilltop Holdings Inc. | 11.752 | 1,21 | 230 | -1,71 | ||||
| 2025-08-08 | 13F | Avantax Advisory Services, Inc. | 116.691 | -7,57 | 2.288 | -10,27 | ||||
| 2025-07-08 | 13F | Webster Bank, N. A. | 735 | 0,00 | 14 | 0,00 | ||||
| 2025-08-07 | 13F | Kestra Private Wealth Services, Llc | 43.307 | 57,63 | 849 | 53,25 | ||||
| 2025-08-14 | 13F | AllSquare Wealth Management LLC | 193.375 | -1,54 | 3.792 | -4,41 | ||||
| 2025-07-25 | 13F | Apollon Wealth Management, LLC | 36.224 | 2,28 | 710 | -0,70 | ||||
| 2025-07-10 | 13F | Global Financial Private Client, LLC | 22.212 | 436 | ||||||
| 2025-07-30 | 13F | Cullen/frost Bankers, Inc. | 7.410 | 145 | ||||||
| 2025-08-06 | 13F | Commonwealth Equity Services, Llc | 124.848 | 7,95 | 2 | 0,00 | ||||
| 2025-08-12 | 13F | LPL Financial LLC | 1.195.922 | -3,71 | 23.452 | -6,52 | ||||
| 2025-07-29 | 13F | Private Trust Co Na | 13.369 | 3,89 | 262 | 1,16 | ||||
| 2025-07-17 | 13F | Fiduciary Advisors, Inc. | 2.751 | 1,85 | 54 | -1,85 | ||||
| 2025-07-21 | 13F | Rainey & Randall Investment Management Inc. | 671.076 | 0,13 | 13.240 | -2,78 | ||||
| 2025-08-14 | 13F | Mariner, LLC | 103.553 | 12,01 | 2.031 | 8,73 | ||||
| 2025-08-08 | 13F | Cetera Investment Advisers | 158.268 | -8,55 | 3.104 | -11,22 | ||||
| 2025-08-14 | 13F | TCG Advisory Services, LLC | 24.012 | 0,60 | 471 | -2,49 | ||||
| 2025-08-12 | 13F | J.w. Cole Advisors, Inc. | 24.038 | -6,01 | 471 | -8,72 | ||||
| 2025-08-15 | 13F | Captrust Financial Advisors | 166.055 | 0,62 | 3.256 | -2,31 | ||||
| 2025-07-17 | 13F | Alpine Bank Wealth Management | 5.185 | 102 | ||||||
| 2025-08-11 | 13F | Private Advisor Group, LLC | 11.061 | -34,49 | 217 | -36,66 | ||||
| 2025-04-28 | 13F | Strategic Financial Concepts, LLC | 0 | -100,00 | 0 | -100,00 | ||||
| 2025-08-15 | 13F | Kestra Advisory Services, LLC | 73.866 | 23,03 | 1.449 | 19,47 | ||||
| 2025-08-12 | 13F | Jpmorgan Chase & Co | 0 | 0 |