Grundlæggende statistik
| Institutionelle ejere | 99 total, 99 long only, 0 short only, 0 long/short - change of -3,85% MRQ |
| Gennemsnitlig porteføljeallokering | 0.0649 % - change of 5,74% MRQ |
| Institutionelle aktier (lange) | 5.359.226 (ex 13D/G) - change of -2,63MM shares -32,95% MRQ |
| Institutionel værdi (lang) | $ 206.021 USD ($1000) |
Institutionelt ejerskab og aktionærer
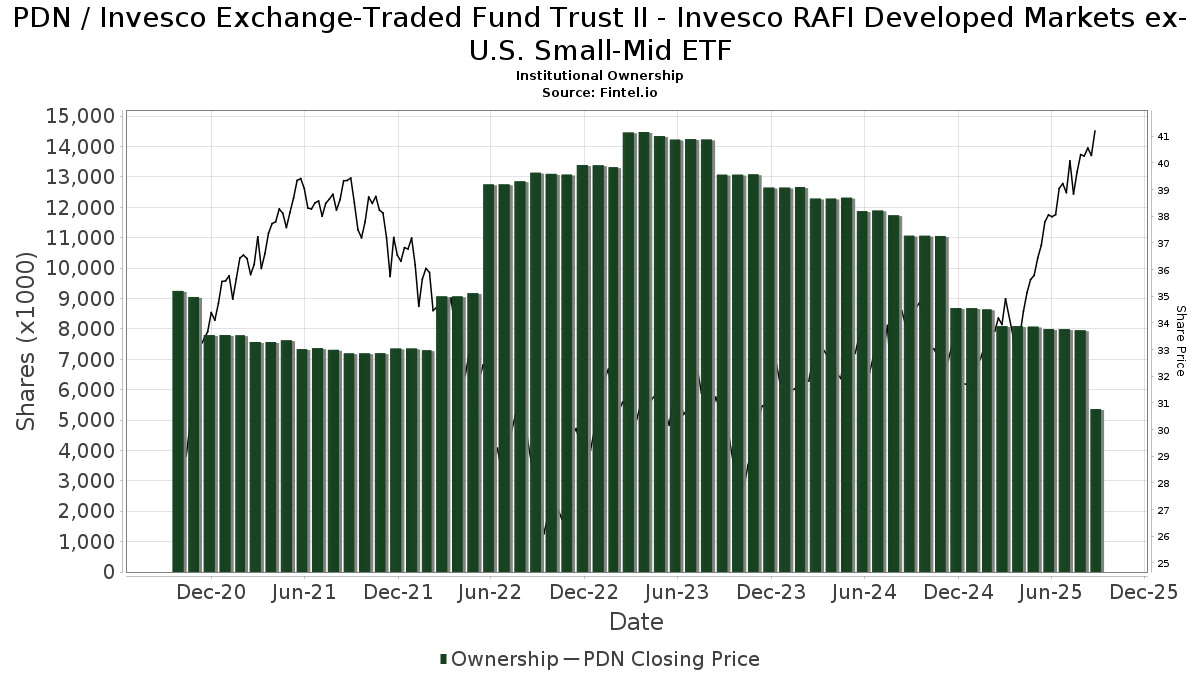
Invesco Exchange-Traded Fund Trust II - Invesco RAFI Developed Markets ex-U.S. Small-Mid ETF (US:PDN) har 99 institutionelle ejere og aktionærer, der har indsendt 13D/G- eller 13F-formularer til Securities Exchange Commission (SEC). Disse institutioner har i alt 5,359,226 aktier. Største aktionærer omfatter Charles Schwab Investment Management Inc, Invesco Ltd., Opes Wealth Management LLC, Colony Group, LLC, LPL Financial LLC, HighTower Advisors, LLC, Citadel Advisors Llc, Cutler Investment Counsel Llc, Captrust Financial Advisors, and Droms Strauss Advisors Inc /mo/ /adv .
Invesco Exchange-Traded Fund Trust II - Invesco RAFI Developed Markets ex-U.S. Small-Mid ETF (ARCA:PDN) institutionel ejerskabsstruktur viser aktuelle positioner i virksomheden efter institutioner og fonde, samt seneste ændringer i positionsstørrelse. Større aktionærer kan omfatte individuelle investorer, investeringsforeninger, hedgefonde eller institutioner. Skema 13D angiver, at investoren besidder (eller besidder) mere end 5 % af virksomheden og har til hensigt (eller har til hensigt at) aktivt at forfølge en ændring i forretningsstrategi. Skema 13G indikerer en passiv investering på over 5%.
The share price as of September 16, 2025 is 41,83 / share. Previously, on September 17, 2024, the share price was 34,58 / share. This represents an increase of 20,97% over that period.
Fondens stemningsscore
Fund Sentiment Score (fka Ownership Accumulation Score) finder de aktier, der bliver mest købt af fonde. Det er resultatet af en sofistikeret, multi-faktor kvantitativ model, der identificerer virksomheder med de højeste niveauer af institutionel akkumulering. Scoringsmodellen bruger en kombination af den samlede stigning i oplyste ejere, ændringerne i porteføljeallokeringer i disse ejere og andre målinger. Tallet går fra 0 til 100, hvor højere tal indikerer et højere niveau af akkumulering for sine jævnaldrende, og 50 er gennemsnittet.
Opdateringsfrekvens: Dagligt
Se Ownership Explorer, som giver en liste over højest rangerende virksomheder.
Institutionel Put/Call-forhold
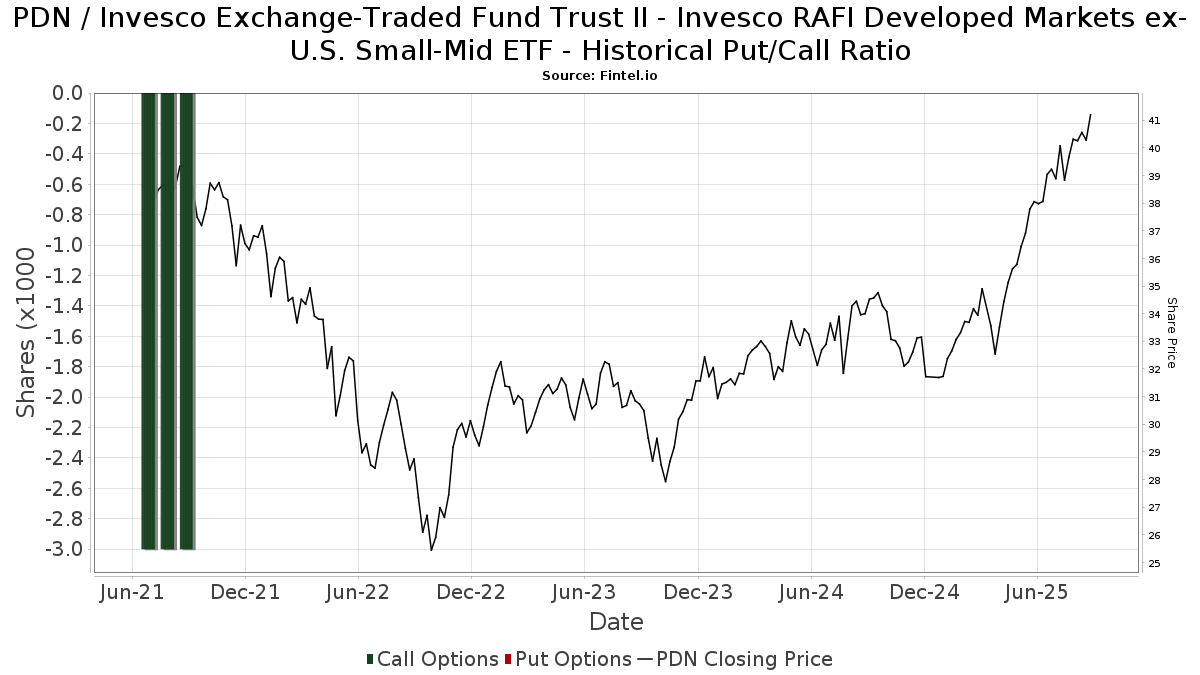
Ud over at indberette standardaktie- og gældsudstedelser skal institutter med mere end 100 mill. aktiver under forvaltning også oplyse deres put- og call-optionsbeholdninger. Da salgsoptioner generelt indikerer negativ stemning, og købsoptioner indikerer positiv stemning, kan vi få en fornemmelse af den overordnede institutionelle stemning ved at plotte forholdet mellem put og kald. Diagrammet til højre viser det historiske put/call-forhold for dette instrument.
Brug af Put/Call Ratio som en indikator for investorernes stemning overvinder en af de vigtigste mangler ved at bruge totalt institutionelt ejerskab, som er, at en betydelig mængde af aktiver under forvaltning investeres passivt for at spore indekser. Passivt forvaltede fonde køber typisk ikke optioner, så indikatoren for put/call-forholdet følger mere nøje følelsen af aktivt forvaltede fonde.
13F og NPORT arkivering
Detaljer om 13F-arkivering er gratis. Detaljer om NP-ansøgninger kræver et premium-medlemskab. Grønne rækker angiver nye positioner. Røde rækker angiver lukkede positioner. Klik på linket ikon for at se den fulde transaktionshistorik.
Opgrader
for at låse premium-data op og eksportere til Excel ![]() .
.
| Fil dato | Kilde | Investor | Type | Gennemsnitlig pris (Øst) |
Aktier | Δ Aktier (%) |
Rapporteret Værdi ($1000) |
Δ Værdi (%) |
Port Alloc (%) |
|
|---|---|---|---|---|---|---|---|---|---|---|
| 2025-08-06 | 13F | Aspect Partners, LLC | 21 | 0,00 | 1 | |||||
| 2025-07-24 | 13F | Blair William & Co/il | 338 | 0,00 | 13 | 18,18 | ||||
| 2025-08-14 | 13F | Qube Research & Technologies Ltd | 256 | -43,86 | 10 | -40,00 | ||||
| 2025-07-25 | 13F | LRI Investments, LLC | 527 | 0,00 | 21 | 17,65 | ||||
| 2025-07-15 | 13F | Bfsg, Llc | 146 | 0,00 | 6 | 25,00 | ||||
| 2025-08-08 | 13F | Creative Planning | 27.747 | -10,37 | 1.080 | 4,15 | ||||
| 2025-07-07 | 13F | Versant Capital Management, Inc | 580 | 0,00 | 23 | 15,79 | ||||
| 2025-08-14 | 13F | Raymond James Financial Inc | 7.121 | 0,11 | 277 | 16,39 | ||||
| 2025-07-25 | 13F | NorthRock Partners, LLC | 34 | 0,00 | 1 | 0,00 | ||||
| 2025-07-21 | 13F | Ameritas Advisory Services, LLC | 693 | 27 | ||||||
| 2025-07-14 | 13F | Farmers & Merchants Investments Inc | 0 | -100,00 | 0 | |||||
| 2025-08-01 | 13F | Bessemer Group Inc | 0 | -100,00 | 0 | |||||
| 2025-08-08 | 13F | CFO4Life Group, LLC | 6.510 | 0,91 | 253 | 17,67 | ||||
| 2025-05-09 | 13F | Wade Financial Advisory, Inc | 45.889 | -3,82 | 1.536 | 1,86 | ||||
| 2025-08-01 | 13F | Envestnet Asset Management Inc | 15.346 | -9,48 | 597 | 5,29 | ||||
| 2025-07-28 | 13F | Cutler Investment Counsel Llc | 115.253 | -15,26 | 4.485 | -1,47 | ||||
| 2025-07-15 | 13F | Mather Group, Llc. | 0 | -100,00 | 0 | |||||
| 2025-07-24 | 13F | Jfs Wealth Advisors, Llc | 8.752 | -3,14 | 341 | 12,58 | ||||
| 2025-07-30 | 13F | Studio Investment Management Llc | 32.575 | -1,72 | 1.268 | 14,25 | ||||
| 2025-08-08 | 13F | Larson Financial Group LLC | 2.256 | 88 | ||||||
| 2025-08-19 | 13F | Asset Dedication, LLC | 14.348 | -3,80 | 558 | 11,82 | ||||
| 2025-08-05 | 13F | Dunhill Financial, LLC | 359 | 0,00 | 14 | 8,33 | ||||
| 2025-07-28 | 13F | Harbour Investments, Inc. | 332 | 13 | ||||||
| 2025-08-14 | 13F | Modern Wealth Management, LLC | 39.687 | -11,78 | 1.545 | 2,52 | ||||
| 2025-05-15 | 13F | Glenmede Trust Co Na | 321 | 0,00 | 11 | 0,00 | ||||
| 2025-08-08 | 13F | Capital Investment Advisory Services, LLC | 151 | 0,00 | 6 | 0,00 | ||||
| 2025-08-06 | 13F | Commonwealth Equity Services, Llc | 18.539 | -7,31 | 1 | |||||
| 2025-08-11 | 13F | Aptus Capital Advisors, LLC | 1.960 | 0,05 | 76 | 16,92 | ||||
| 2025-07-14 | 13F | Abound Wealth Management | 120 | 5 | ||||||
| 2025-07-24 | 13F | Williams & Novak, LLC | 13.090 | -8,59 | 509 | 6,26 | ||||
| 2025-07-09 | 13F | Efficient Frontier Advisors LLC | 9.228 | 0,94 | 359 | 17,32 | ||||
| 2025-07-16 | 13F | Moisand Fitzgerald Tamayo, LLC | 206 | 0,00 | 8 | 33,33 | ||||
| 2025-08-11 | 13F | CFS Investment Advisory Services, LLC | 7.839 | -4,53 | 0 | |||||
| 2025-08-14 | 13F | CoreCap Advisors, LLC | 11.947 | 3,09 | 465 | 19,90 | ||||
| 2025-08-12 | 13F | AlphaCore Capital LLC | 17.176 | 5.722,37 | 668 | 7.322,22 | ||||
| 2025-09-04 | 13F/A | Advisor Group Holdings, Inc. | 4.264 | -25,91 | 166 | -14,06 | ||||
| 2025-07-11 | 13F | Farther Finance Advisors, LLC | 210 | 195,77 | 8 | 300,00 | ||||
| 2025-08-14 | 13F | Mercer Global Advisors Inc /adv | 17.323 | -4,34 | 674 | 11,22 | ||||
| 2025-08-15 | 13F | Morgan Stanley | 47.117 | 8,42 | 1.834 | 26,07 | ||||
| 2025-07-15 | 13F | Droms Strauss Advisors Inc /mo/ /adv | 108.654 | -1,55 | 4.228 | 14,46 | ||||
| 2025-08-05 | 13F | Sensible Money, LLC | 12.252 | 0,29 | 477 | 16,67 | ||||
| 2025-03-17 | 13F/A | Wealth Enhancement Advisory Services, Llc | 0 | -100,00 | 0 | |||||
| 2025-08-07 | 13F | Allworth Financial LP | 3.390 | 1,50 | 132 | 12,93 | ||||
| 2025-07-25 | 13F | Index Fund Advisors, Inc. | 9.506 | 0,00 | 370 | 16,04 | ||||
| 2025-07-17 | 13F | Charles Schwab Trust Co | 30.654 | -3,34 | 1.193 | 12,35 | ||||
| 2025-07-17 | 13F | KWB Wealth | 51.289 | -9,09 | 1.717 | -3,76 | ||||
| 2025-08-13 | 13F | Capital Analysts, Inc. | 519 | 0,00 | 0 | |||||
| 2025-08-08 | 13F | Hartland & Co., LLC | 536 | 56,73 | 26 | 127,27 | ||||
| 2025-08-11 | 13F | Bell Investment Advisors, Inc | 2.323 | 69,81 | 90 | 100,00 | ||||
| 2025-07-24 | 13F | IFP Advisors, Inc | 3.963 | 19,80 | 154 | 40,00 | ||||
| 2025-07-31 | 13F | Opes Wealth Management LLC | 199.641 | -0,02 | 7.769 | 16,23 | ||||
| 2025-08-14 | 13F | EP Wealth Advisors, Inc. | 5.737 | -4,92 | 223 | 10,95 | ||||
| 2025-08-08 | 13F | L & S Advisors Inc | 27.977 | 10,18 | 1.089 | 28,00 | ||||
| 2025-08-13 | 13F | Smith, Moore & Co. | 21.367 | -0,63 | 832 | 15,58 | ||||
| 2025-08-04 | 13F | Bristlecone Advisors, LLC | 0 | -100,00 | 0 | |||||
| 2025-08-14 | 13F | Goldman Sachs Group Inc | 102.092 | 3.973 | ||||||
| 2025-08-12 | 13F | Jpmorgan Chase & Co | 687 | -86,01 | 27 | -84,15 | ||||
| 2025-08-13 | 13F | Cerity Partners LLC | 7.782 | 0,75 | 303 | 17,05 | ||||
| 2025-08-14 | 13F | Citadel Advisors Llc | 148.570 | 36,37 | 5.782 | 58,51 | ||||
| 2025-08-12 | 13F | MAI Capital Management | 2.568 | -47,29 | 100 | -39,26 | ||||
| 2025-08-14 | 13F | Mariner, LLC | 11.691 | 2,13 | 455 | 18,54 | ||||
| 2025-07-17 | 13F | Summit Financial Strategies, Inc. | 8.069 | 3,04 | 314 | 19,85 | ||||
| 2025-08-13 | 13F | Russell Investments Group, Ltd. | 10 | 0,00 | 0 | |||||
| 2025-08-14 | 13F | Wells Fargo & Company/mn | 29.681 | 1,70 | 1.155 | 18,34 | ||||
| 2025-08-14 | 13F | Bank Of America Corp /de/ | 16.796 | -6,81 | 654 | 8,29 | ||||
| 2025-08-14 | 13F | Colony Group, LLC | 193.073 | 1.365,23 | 7.514 | 1.603,63 | ||||
| 2025-08-13 | 13F | Northwestern Mutual Wealth Management Co | 7.835 | 3,30 | 305 | 20,16 | ||||
| 2025-08-05 | 13F | GPS Wealth Strategies Group, LLC | 211 | 0,00 | 8 | 14,29 | ||||
| 2025-08-14 | 13F | Jane Street Group, Llc | 106.036 | 234,59 | 4.127 | 289,25 | ||||
| 2025-08-14 | 13F | Royal Bank Of Canada | 51.344 | 13,70 | 1.999 | 32,30 | ||||
| 2025-08-14 | 13F | Evergreen Capital Management Llc | 6.040 | 0,00 | 235 | 16,34 | ||||
| 2025-07-25 | 13F | Sequoia Financial Advisors, LLC | 14.142 | 0,67 | 550 | 17,02 | ||||
| 2025-07-08 | 13F | Parallel Advisors, LLC | 3.935 | 0,00 | 153 | 16,79 | ||||
| 2025-08-13 | 13F | Jones Financial Companies Lllp | 6.001 | 56,97 | 232 | 80,47 | ||||
| 2025-08-08 | 13F | Pnc Financial Services Group, Inc. | 989 | -3,04 | 39 | 11,76 | ||||
| 2025-08-12 | 13F | LPL Financial LLC | 190.463 | 1.017,22 | 7.412 | 1.200,35 | ||||
| 2025-08-14 | 13F | Ameriprise Financial Inc | 98.654 | 4,75 | 3.839 | 21,91 | ||||
| 2025-07-30 | 13F | Fairway Wealth LLC | 0 | -100,00 | 0 | |||||
| 2025-08-15 | 13F | Captrust Financial Advisors | 110.868 | 2,03 | 4.315 | 18,61 | ||||
| 2025-08-12 | 13F | CIBC Private Wealth Group, LLC | 2.399 | -6,00 | 93 | 20,78 | ||||
| 2025-07-24 | 13F | Robertson Stephens Wealth Management, LLC | 16.278 | 0,00 | 633 | 16,36 | ||||
| 2025-08-11 | 13F | Principal Securities, Inc. | 1.357 | 0,74 | 53 | 23,81 | ||||
| 2025-08-05 | 13F | Bank Of Montreal /can/ | 3.533 | -78,88 | 137 | -75,49 | ||||
| 2025-08-12 | 13F | Steward Partners Investment Advisory, Llc | 0 | -100,00 | 0 | |||||
| 2025-08-14 | 13F | Susquehanna International Group, Llp | 90.840 | -0,69 | 3.535 | 15,45 | ||||
| 2025-07-18 | 13F | TruNorth Capital Management, LLC | 214 | 0,00 | 8 | 14,29 | ||||
| 2025-04-29 | 13F | Callan Capital, LLC | 16.881 | 0,00 | 565 | 6,00 | ||||
| 2025-08-14 | 13F | C M Bidwell & Associates Ltd | 2.975 | 0,00 | 116 | 16,16 | ||||
| 2025-05-22 | 13F | Mattson Financial Services, LLC | 0 | -100,00 | 0 | |||||
| 2025-08-14 | 13F | CIBC World Markets Inc. | 26.532 | 8,93 | 1.033 | 26,63 | ||||
| 2025-08-14 | 13F | UBS Group AG | 5.799 | -4,10 | 226 | 11,39 | ||||
| 2025-08-12 | 13F | O'shaughnessy Asset Management, Llc | 268 | 0,00 | 10 | 25,00 | ||||
| 2025-08-13 | 13F | Invesco Ltd. | 245.027 | -46,93 | 9.536 | -38,30 | ||||
| 2025-07-25 | 13F | Cwm, Llc | 1.843 | -1,60 | 0 | |||||
| 2025-08-11 | 13F | HighTower Advisors, LLC | 185.685 | -0,88 | 7.226 | 15,23 | ||||
| 2025-08-12 | 13F | Proequities, Inc. | 0 | 0 | ||||||
| 2025-08-08 | 13F | Cetera Investment Advisers | 13.117 | 0,95 | 510 | 17,51 | ||||
| 2025-08-05 | 13F | Beckerman Institutional, LLC | 19.476 | -3,33 | 1 | |||||
| 2025-05-06 | 13F | Kathleen S. Wright Associates Inc. | 0 | -100,00 | 0 | |||||
| 2025-08-12 | 13F | Charles Schwab Investment Management Inc | 2.613.037 | -52,58 | 101.692 | -44,87 | ||||
| 2025-08-14 | 13F | Fmr Llc | 10.022 | 9,76 | 390 | 27,87 | ||||
| 2025-08-13 | 13F | Flow Traders U.s. Llc | 0 | -100,00 | 0 | |||||
| 2025-08-11 | 13F | FSA Wealth Management LLC | 68 | 0,00 | 3 | 0,00 | ||||
| 2025-08-05 | 13F | Access Investment Management LLC | 4.675 | 0,00 | 182 | 23,13 | ||||
| 2025-07-09 | 13F | Westmount Partners, LLC | 11.296 | 0,00 | 440 | 16,14 | ||||
| 2025-05-08 | 13F | Us Bancorp \de\ | 0 | -100,00 | 0 | |||||
| 2025-07-30 | 13F | Klingman & Associates, LLC | 23.721 | 0,00 | 923 | 16,25 | ||||
| 2025-08-05 | 13F | Huntington National Bank | 46 | 15,38 | ||||||
| 2025-08-14 | 13F | Glenmede Investment Management, LP | 321 | 12 | ||||||
| 2025-08-14 | 13F | Guardian Wealth Advisors, Llc / Nc | 5 | 0,00 | 0 | |||||
| 2025-08-06 | 13F | AE Wealth Management LLC | 171 | 0,00 | 7 | 20,00 | ||||
| 2025-08-14 | 13F | Toronto Dominion Bank | 0 | -100,00 | 0 | |||||
| 2025-08-12 | 13F | Accredited Wealth Management, LLC | 80 | 3 | ||||||
| 2025-07-24 | 13F | Stonebridge Financial Group, LLC | 0 | -100,00 | 0 | |||||
| 2025-04-30 | 13F | Synergy Investment Management, LLC | 0 | -100,00 | 0 |