Grundlæggende statistik
| Institutionelle ejere | 71 total, 71 long only, 0 short only, 0 long/short - change of 18,33% MRQ |
| Gennemsnitlig porteføljeallokering | 0.0115 % - change of 72,69% MRQ |
| Institutionelle aktier (lange) | 5.632.148 (ex 13D/G) - change of 4,43MM shares 367,52% MRQ |
| Institutionel værdi (lang) | $ 87.636 USD ($1000) |
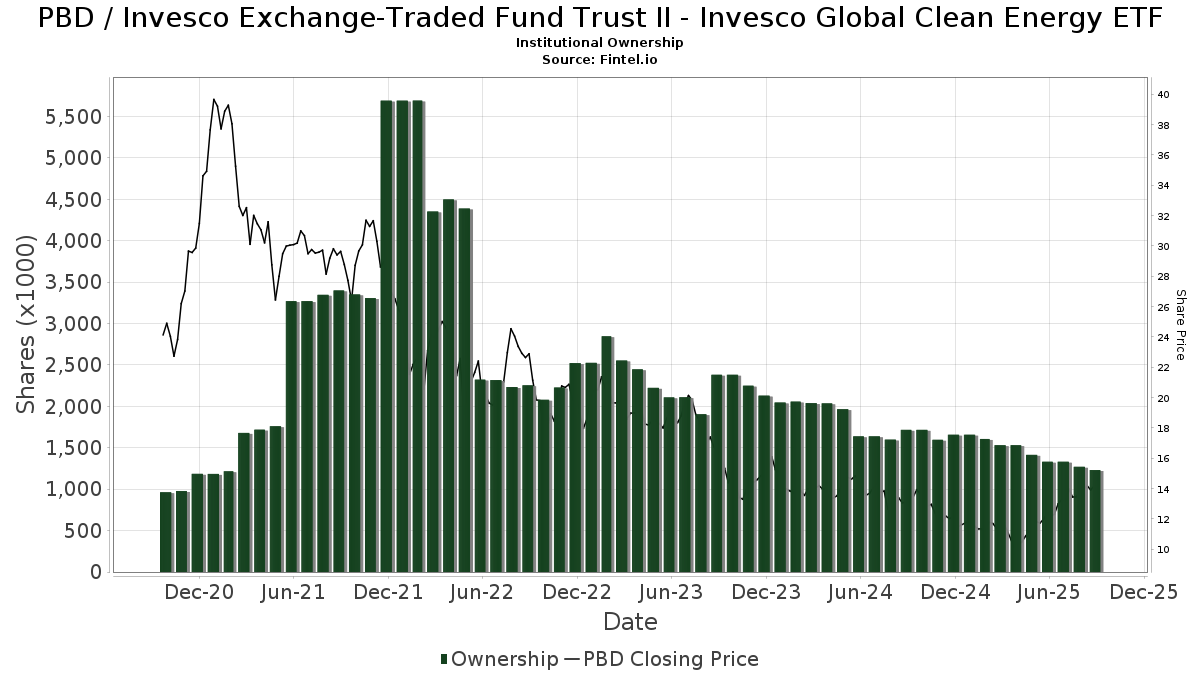
Institutionelt ejerskab og aktionærer
Invesco Exchange-Traded Fund Trust II - Invesco Global Clean Energy ETF (US:PBD) har 71 institutionelle ejere og aktionærer, der har indsendt 13D/G- eller 13F-formularer til Securities Exchange Commission (SEC). Disse institutioner har i alt 5,632,148 aktier. Største aktionærer omfatter HighTower Advisors, LLC, Morgan Stanley, Raymond James Financial Inc, Royal Bank Of Canada, LPL Financial LLC, Mercer Global Advisors Inc /adv, Stifel Financial Corp, UBS Group AG, Harel Insurance Investments & Financial Services Ltd., and Ameriprise Financial Inc .
Invesco Exchange-Traded Fund Trust II - Invesco Global Clean Energy ETF (ARCA:PBD) institutionel ejerskabsstruktur viser aktuelle positioner i virksomheden efter institutioner og fonde, samt seneste ændringer i positionsstørrelse. Større aktionærer kan omfatte individuelle investorer, investeringsforeninger, hedgefonde eller institutioner. Skema 13D angiver, at investoren besidder (eller besidder) mere end 5 % af virksomheden og har til hensigt (eller har til hensigt at) aktivt at forfølge en ændring i forretningsstrategi. Skema 13G indikerer en passiv investering på over 5%.
The share price as of March 27, 2026 is 17,49 / share. Previously, on March 28, 2025, the share price was 10,77 / share. This represents an increase of 62,40% over that period.
Fondens stemningsscore
Fund Sentiment Score (fka Ownership Accumulation Score) finder de aktier, der bliver mest købt af fonde. Det er resultatet af en sofistikeret, multi-faktor kvantitativ model, der identificerer virksomheder med de højeste niveauer af institutionel akkumulering. Scoringsmodellen bruger en kombination af den samlede stigning i oplyste ejere, ændringerne i porteføljeallokeringer i disse ejere og andre målinger. Tallet går fra 0 til 100, hvor højere tal indikerer et højere niveau af akkumulering for sine jævnaldrende, og 50 er gennemsnittet.
Opdateringsfrekvens: Dagligt
Se Ownership Explorer, som giver en liste over højest rangerende virksomheder.
AI+ Ask Fintel’s AI assistant about Invesco Exchange-Traded Fund Trust II - Invesco Global Clean Energy ETF.
Select a question to share a public post with an AI-crafted answer.
Thinking of good questions…
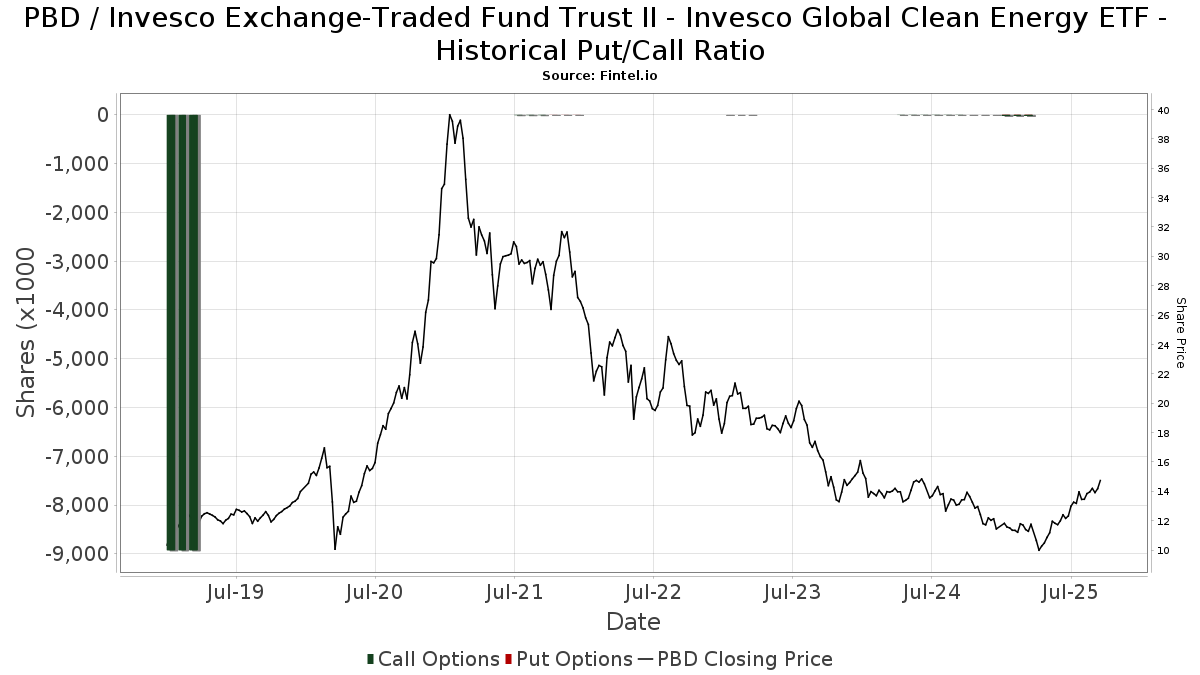
Institutionel Put/Call-forhold
Ud over at indberette standardaktie- og gældsudstedelser skal institutter med mere end 100 mill. aktiver under forvaltning også oplyse deres put- og call-optionsbeholdninger. Da salgsoptioner generelt indikerer negativ stemning, og købsoptioner indikerer positiv stemning, kan vi få en fornemmelse af den overordnede institutionelle stemning ved at plotte forholdet mellem put og kald. Diagrammet til højre viser det historiske put/call-forhold for dette instrument.
Brug af Put/Call Ratio som en indikator for investorernes stemning overvinder en af de vigtigste mangler ved at bruge totalt institutionelt ejerskab, som er, at en betydelig mængde af aktiver under forvaltning investeres passivt for at spore indekser. Passivt forvaltede fonde køber typisk ikke optioner, så indikatoren for put/call-forholdet følger mere nøje følelsen af aktivt forvaltede fonde.
13F og NPORT arkivering
Detaljer om 13F-arkivering er gratis. Detaljer om NP-ansøgninger kræver et premium-medlemskab. Grønne rækker angiver nye positioner. Røde rækker angiver lukkede positioner. Klik på linket ikon for at se den fulde transaktionshistorik.
Opgrader
for at låse premium-data op og eksportere til Excel ![]() .
.
| Fil dato | Kilde | Investor | Type | Gennemsnitlig pris (Øst) |
Aktier | Δ Aktier (%) |
Rapporteret Værdi ($1000) |
Δ Værdi (%) |
Port Alloc (%) |
|
|---|---|---|---|---|---|---|---|---|---|---|
| 2026-02-12 | 13F | Commonwealth Equity Services, Llc | 17.677 | -6,14 | 284 | |||||
| 2026-01-26 | 13F | Whittier Trust Co | 580 | 0,00 | 10 | 0,00 | ||||
| 2026-02-17 | 13F | Private Advisor Group, LLC | 26.884 | 432 | ||||||
| 2025-11-13 | 13F | Fmr Llc | 0 | -100,00 | 0 | |||||
| 2026-02-14 | 13F | Rockefeller Capital Management L.P. | 432 | -1,37 | 7 | 0,00 | ||||
| 2026-02-06 | 13F | HighTower Advisors, LLC | 1.917.933 | 30.845 | ||||||
| 2025-11-07 | 13F | Atticus Wealth Management, Llc | 0 | -100,00 | 0 | -100,00 | ||||
| 2026-02-17 | 13F | Advisory Services Network, LLC | 0 | -100,00 | 0 | |||||
| 2025-11-06 | 13F | Ameritas Advisory Services, LLC | 0 | -100,00 | 0 | -100,00 | ||||
| 2026-01-30 | 13F | Us Bancorp \de\ | 7.192 | 0,00 | 116 | 6,48 | ||||
| 2026-01-13 | 13F | Mather Group, Llc. | 14.825 | 0,00 | 238 | 6,73 | ||||
| 2026-01-13 | 13F | CoreCap Advisors, LLC | 27 | 0,00 | 0 | |||||
| 2025-11-14 | 13F | Financial Network Wealth Management LLC | 0 | -100,00 | 0 | |||||
| 2026-01-20 | 13F | Princeton Global Asset Management LLC | 6.705 | 0,55 | 108 | 7,00 | ||||
| 2026-02-17 | 13F | Mercer Global Advisors Inc /adv | 215.297 | 0,00 | 3.462 | 6,72 | ||||
| 2026-02-03 | 13F | SBI Securities Co., Ltd. | 4.904 | -0,20 | 79 | 5,41 | ||||
| 2025-11-14 | 13F | Guardian Wealth Advisors, Llc / Nc | 0 | -100,00 | 0 | |||||
| 2026-01-26 | 13F | Cwm, Llc | 745 | 0,54 | 0 | |||||
| 2026-01-23 | 13F | Colorado Capital Management, Inc. | 15.639 | -4,49 | 0 | |||||
| 2026-01-26 | 13F | AE Wealth Management LLC | 4 | -99,91 | 0 | -100,00 | ||||
| 2026-02-17 | 13F | Ameriprise Financial Inc | 122.211 | 16,13 | 1.966 | 24,21 | ||||
| 2026-02-17 | 13F | Royal Bank Of Canada | 342.688 | 2.798,73 | 5.512 | 2.996,63 | ||||
| 2026-02-13 | 13F | Evelyn Partners Investment Management Services Ltd | 346 | 0,00 | 6 | 0,00 | ||||
| 2026-02-17 | 13F | Cetera Investment Advisers | 17.438 | 280 | ||||||
| 2026-02-10 | 13F | Ritter Daniher Financial Advisory LLC / DE | 1.550 | 25 | ||||||
| 2026-01-14 | 13F | Hennion & Walsh Asset Management, Inc. | 37.850 | 609 | ||||||
| 2026-01-16 | 13F | Compagnie Lombard Odier SCmA | 1.000 | 0,00 | 16 | 6,67 | ||||
| 2026-01-30 | 13F | Urban Wealth Management, LLC | 0 | -100,00 | 0 | -100,00 | ||||
| 2026-02-12 | 13F | BRYN MAWR TRUST Co | 100 | 0,00 | 2 | 0,00 | ||||
| 2026-02-13 | 13F | Citigroup Inc | 4.075 | 2,96 | 66 | 10,17 | ||||
| 2025-11-14 | 13F | Flow Traders U.s. Llc | 0 | -100,00 | 0 | |||||
| 2026-01-14 | 13F | Jfs Wealth Advisors, Llc | 1.095 | 0,00 | 18 | 6,25 | ||||
| 2026-02-13 | 13F | Stifel Financial Corp | 169.828 | 812,17 | 2.731 | 875,36 | ||||
| 2026-02-11 | 13F | O'shaughnessy Asset Management, Llc | 5.706 | 92 | ||||||
| 2026-02-12 | 13F | Financial Engines Advisors L.L.C. | 50.176 | -15,31 | 807 | -9,64 | ||||
| 2026-02-13 | 13F | Aptus Capital Advisors, LLC | 290 | 0,00 | 5 | 0,00 | ||||
| 2026-02-02 | 13F | Fifth Third Bancorp | 366 | 0,00 | 6 | 0,00 | ||||
| 2025-11-14 | 13F | Citadel Advisors Llc | 0 | -100,00 | 0 | |||||
| 2026-01-15 | 13F | Nilsine Partners, LLC | 91.821 | 1.477 | ||||||
| 2026-02-17 | 13F | Jones Financial Companies Lllp | 11.633 | -1,58 | 187 | 6,86 | ||||
| 2026-01-29 | 13F | UBS Group AG | 163.790 | 347,33 | 2.634 | 378,04 | ||||
| 2026-02-03 | 13F | CGC Financial Services, LLC | 645 | 0,00 | 10 | 11,11 | ||||
| 2026-02-17 | 13F | Susquehanna International Group, Llp | 56.490 | -26,67 | 908 | -21,72 | ||||
| 2026-01-16 | 13F | Trust Co Of Vermont | 19.607 | 0,00 | 315 | 6,78 | ||||
| 2026-01-21 | 13F | Sound Income Strategies, LLC | 109 | 2 | ||||||
| 2026-02-11 | 13F | Simplex Trading, Llc | 0 | -100,00 | 0 | |||||
| 2026-02-12 | 13F | Federation des caisses Desjardins du Quebec | 1.984 | -28,25 | 32 | -24,39 | ||||
| 2026-02-05 | 13F | Allworth Financial LP | 200 | 0,00 | 3 | 0,00 | ||||
| 2026-02-13 | 13F | Pacific Center for Financial Services | 373 | 0,00 | 6 | 0,00 | ||||
| 2026-02-09 | 13F | Hartland & Co., LLC | 2.220 | 0,00 | 36 | 6,06 | ||||
| 2026-02-11 | 13F | Jpmorgan Chase & Co | 3.693 | 0,82 | 59 | 7,27 | ||||
| 2026-02-17 | 13F | Raymond James Financial Inc | 386.143 | 2.136,31 | 6.210 | 2.288,46 | ||||
| 2026-02-13 | 13F | Wells Fargo & Company/mn | 56.017 | 212,51 | 901 | 233,33 | ||||
| 2026-02-02 | 13F | Cornerstone Planning Group LLC | 156 | 0,65 | 3 | 0,00 | ||||
| 2026-02-11 | 13F | LPL Financial LLC | 218.412 | 260,70 | 3.513 | 285,09 | ||||
| 2026-02-17 | 13F | Minichmacgregor Wealth Management, Llc | 21.982 | 354 | ||||||
| 2026-02-06 | 13F | Pnc Financial Services Group, Inc. | 1.691 | 0,00 | 27 | 8,00 | ||||
| 2026-01-23 | 13F | Financial Connections Group, Inc. | 200 | 0,00 | 0 | |||||
| 2026-02-03 | 13F | Harel Insurance Investments & Financial Services Ltd. | 132.832 | 23,43 | 2 | 100,00 | ||||
| 2026-02-17 | 13F | Ancora Advisors, LLC | 100 | 0,00 | 2 | 0,00 | ||||
| 2026-02-13 | 13F | MAI Capital Management | 4.412 | 0,55 | 71 | 6,06 | ||||
| 2026-01-14 | 13F | Global View Capital Management LLC | 55.442 | -1,36 | 892 | 5,19 | ||||
| 2026-02-17 | 13F | Advisor Group Holdings, Inc. | 19.562 | 32,85 | 315 | 45,37 | ||||
| 2026-02-04 | 13F | Atlantic Union Bankshares Corp | 479 | 8 | ||||||
| 2025-10-01 | 13F | Caldwell Trust Co | 474 | 0,00 | 8 | 0,00 | ||||
| 2026-01-20 | 13F | SOA Wealth Advisors, LLC. | 8.458 | 0,11 | 136 | 7,09 | ||||
| 2026-02-13 | 13F | Morgan Stanley | 1.187.100 | 854,31 | 19.091 | 918,73 | ||||
| 2026-02-13 | 13F | Kestra Advisory Services, LLC | 1.335 | 21 | ||||||
| 2026-01-29 | 13F | Comerica Bank | 36 | 1 | ||||||
| 2026-02-17 | 13F | Bank Of America Corp /de/ | 0 | -100,00 | 0 | |||||
| 2026-02-09 | 13F | Wellington Shields & Co., LLC | 25.807 | 415 | ||||||
| 2026-01-26 | 13F | Asset Dedication, LLC | 762 | 0,00 | 12 | 9,09 | ||||
| 2026-02-10 | 13F | Johnson Financial Group, LLC | 22.306 | 18,77 | 359 | 26,50 | ||||
| 2026-02-06 | 13F | GPS Wealth Strategies Group, LLC | 0 | -100,00 | 0 | |||||
| 2025-11-14 | 13F | Gts Securities Llc | 0 | -100,00 | 0 | -100,00 | ||||
| 2026-02-10 | 13F | Envestnet Asset Management Inc | 62.435 | 1.004 | ||||||
| 2026-02-18 | 13F | GWM Advisors LLC | 0 | -100,00 | 0 | -100,00 | ||||
| 2026-02-02 | 13F | Millstone Evans Group, LLC | 235 | 4 | ||||||
| 2026-02-09 | 13F | Prospera Financial Services Inc | 23.094 | 372 | ||||||
| 2026-02-05 | 13F | Cambridge Investment Research Advisors, Inc. | 31.659 | 1 | ||||||
| 2026-02-10 | 13F/A | Northwestern Mutual Wealth Management Co | 450 | -93,02 | 7 | -92,78 | ||||
| 2026-02-12 | 13F | Steward Partners Investment Advisory, Llc | 758 | 0,00 | 12 | 9,09 | ||||
| 2026-02-12 | 13F | Jane Street Group, Llc | 33.043 | -45,39 | 531 | -41,71 | ||||
| 2026-02-17 | 13F | Qube Research & Technologies Ltd | 197 | 0,00 | 3 | 50,00 | ||||
| 2026-02-12 | 13F | Wealthspire Advisors, LLC | 0 | -100,00 | 0 | |||||
| 2026-02-13 | 13F | National Bank Of Canada /fi/ | 443 | 0,00 | 7 | 16,67 | ||||
| 2026-02-17 | 13F | IHT Wealth Management, LLC | 0 | -100,00 | 0 |