Grundlæggende statistik
| Institutionelle ejere | 70 total, 70 long only, 0 short only, 0 long/short - change of 1,45% MRQ |
| Gennemsnitlig porteføljeallokering | 0.3837 % - change of -5,20% MRQ |
| Institutionelle aktier (lange) | 4.351.051 (ex 13D/G) - change of -0,40MM shares -8,39% MRQ |
| Institutionel værdi (lang) | $ 201.617 USD ($1000) |
Institutionelt ejerskab og aktionærer
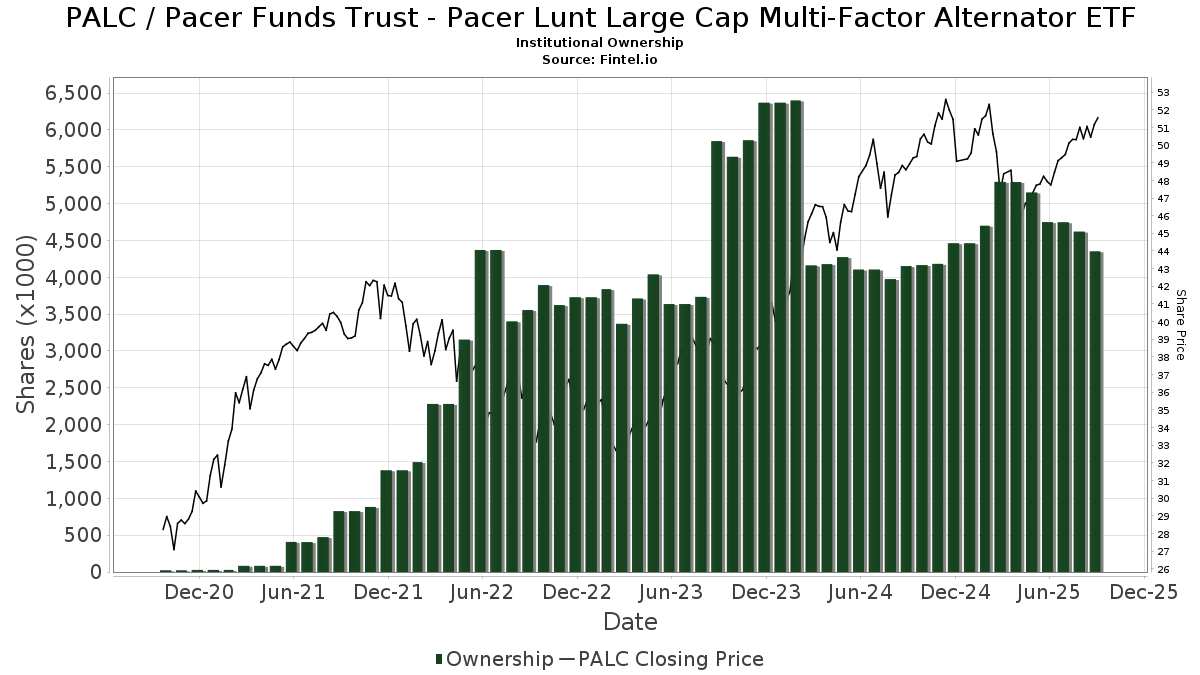
Pacer Funds Trust - Pacer Lunt Large Cap Multi-Factor Alternator ETF (US:PALC) har 70 institutionelle ejere og aktionærer, der har indsendt 13D/G- eller 13F-formularer til Securities Exchange Commission (SEC). Disse institutioner har i alt 4,351,051 aktier. Største aktionærer omfatter Ameriprise Financial Inc, Northwestern Mutual Wealth Management Co, Geneos Wealth Management Inc., Lunt Capital Management, Inc., Enzi Wealth, Financial Enhancement Group LLC, Cambridge Investment Research Advisors, Inc., Ergawealth Advisors, Inc., Centric Wealth Management, and LPL Financial LLC .
Pacer Funds Trust - Pacer Lunt Large Cap Multi-Factor Alternator ETF (ARCA:PALC) institutionel ejerskabsstruktur viser aktuelle positioner i virksomheden efter institutioner og fonde, samt seneste ændringer i positionsstørrelse. Større aktionærer kan omfatte individuelle investorer, investeringsforeninger, hedgefonde eller institutioner. Skema 13D angiver, at investoren besidder (eller besidder) mere end 5 % af virksomheden og har til hensigt (eller har til hensigt at) aktivt at forfølge en ændring i forretningsstrategi. Skema 13G indikerer en passiv investering på over 5%.
The share price as of September 9, 2025 is 50,80 / share. Previously, on September 10, 2024, the share price was 48,66 / share. This represents an increase of 4,40% over that period.
Fondens stemningsscore
Fund Sentiment Score (fka Ownership Accumulation Score) finder de aktier, der bliver mest købt af fonde. Det er resultatet af en sofistikeret, multi-faktor kvantitativ model, der identificerer virksomheder med de højeste niveauer af institutionel akkumulering. Scoringsmodellen bruger en kombination af den samlede stigning i oplyste ejere, ændringerne i porteføljeallokeringer i disse ejere og andre målinger. Tallet går fra 0 til 100, hvor højere tal indikerer et højere niveau af akkumulering for sine jævnaldrende, og 50 er gennemsnittet.
Opdateringsfrekvens: Dagligt
Se Ownership Explorer, som giver en liste over højest rangerende virksomheder.
Institutionel Put/Call-forhold
Ud over at indberette standardaktie- og gældsudstedelser skal institutter med mere end 100 mill. aktiver under forvaltning også oplyse deres put- og call-optionsbeholdninger. Da salgsoptioner generelt indikerer negativ stemning, og købsoptioner indikerer positiv stemning, kan vi få en fornemmelse af den overordnede institutionelle stemning ved at plotte forholdet mellem put og kald. Diagrammet til højre viser det historiske put/call-forhold for dette instrument.
Brug af Put/Call Ratio som en indikator for investorernes stemning overvinder en af de vigtigste mangler ved at bruge totalt institutionelt ejerskab, som er, at en betydelig mængde af aktiver under forvaltning investeres passivt for at spore indekser. Passivt forvaltede fonde køber typisk ikke optioner, så indikatoren for put/call-forholdet følger mere nøje følelsen af aktivt forvaltede fonde.
13F og NPORT arkivering
Detaljer om 13F-arkivering er gratis. Detaljer om NP-ansøgninger kræver et premium-medlemskab. Grønne rækker angiver nye positioner. Røde rækker angiver lukkede positioner. Klik på linket ikon for at se den fulde transaktionshistorik.
Opgrader
for at låse premium-data op og eksportere til Excel ![]() .
.
| Fil dato | Kilde | Investor | Type | Gennemsnitlig pris (Øst) |
Aktier | Δ Aktier (%) |
Rapporteret Værdi ($1000) |
Δ Værdi (%) |
Port Alloc (%) |
|
|---|---|---|---|---|---|---|---|---|---|---|
| 2025-08-15 | 13F | Kestra Advisory Services, LLC | 88.394 | -0,71 | 4.367 | 2,30 | ||||
| 2025-08-04 | 13F | Pensionmark Financial Group, Llc | 63.722 | -2,05 | 3.148 | 0,90 | ||||
| 2025-07-22 | 13F | Ergawealth Advisors, Inc. | 201.666 | -2,90 | 9.962 | 0,04 | ||||
| 2025-08-01 | 13F | Brookwood Investment Group LLC | 4.144 | 205 | ||||||
| 2025-07-24 | 13F | IFP Advisors, Inc | 2.190 | 338,00 | 108 | 468,42 | ||||
| 2025-08-14 | 13F | GWM Advisors LLC | 231 | 0,00 | 11 | 0,00 | ||||
| 2025-05-13 | 13F | Wells Fargo & Company/mn | 0 | -100,00 | 0 | |||||
| 2025-07-14 | 13F | Financial Enhancement Group LLC | 245.831 | 0,26 | 12.124 | 7,35 | ||||
| 2025-03-21 | 13F | Prostatis Group LLC | 0 | -100,00 | 0 | -100,00 | ||||
| 2025-07-15 | 13F | Unified Investment Management | 11.849 | 0,01 | 585 | 2,99 | ||||
| 2025-08-01 | 13F | Envestnet Asset Management Inc | 9.376 | -0,77 | 463 | 2,21 | ||||
| 2025-07-28 | 13F | Lunt Capital Management, Inc. | 262.935 | 1,06 | 12.989 | 4,13 | ||||
| 2025-08-05 | 13F | Sigma Planning Corp | 4.675 | 231 | ||||||
| 2025-07-15 | 13F | Armis Advisers, LLC | 161.192 | 4,75 | 7.963 | 7,93 | ||||
| 2025-07-22 | 13F | Belpointe Asset Management LLC | 31.303 | -7,02 | 1.546 | -4,21 | ||||
| 2025-05-15 | 13F | Captrust Financial Advisors | 0 | -100,00 | 0 | |||||
| 2025-05-22 | 13F | Wbi Investments, Inc. | 0 | -100,00 | 0 | |||||
| 2025-05-14 | 13F | Change Path, LLC | 0 | -100,00 | 0 | |||||
| 2025-08-08 | 13F | Cetera Investment Advisers | 22.919 | -9,11 | 1.132 | -6,37 | ||||
| 2025-07-28 | 13F | Harbour Investments, Inc. | 3.174 | -34,30 | 157 | -32,47 | ||||
| 2025-08-14 | 13F | Glen Eagle Advisors, LLC | 831 | 0,24 | 41 | 5,13 | ||||
| 2025-07-25 | 13F | Cwm, Llc | 439 | -12,90 | 0 | |||||
| 2025-08-14 | 13F | Chicago Wealth Management, Inc. | 8.481 | -2,06 | 419 | 0,72 | ||||
| 2025-07-15 | 13F | Clarus Group, Inc. | 14.576 | 0,00 | 720 | 3,15 | ||||
| 2025-08-14 | 13F | Raymond James Financial Inc | 32.828 | -67,01 | 1.622 | -66,02 | ||||
| 2025-08-18 | 13F | Geneos Wealth Management Inc. | 298.698 | 20,07 | 14.756 | 23,70 | ||||
| 2025-07-25 | 13F | Alpha Financial Partners, LLC | 29.494 | -8,63 | 1.457 | -5,82 | ||||
| 2025-08-12 | 13F | Cornerstone Wealth Management, LLC | 6.450 | 0,06 | 319 | 2,91 | ||||
| 2025-05-07 | 13F | Maridea Wealth Management LLC | 0 | -100,00 | 0 | |||||
| 2025-08-14 | 13F | Citadel Advisors Llc | 0 | -100,00 | 0 | |||||
| 2025-05-16 | 13F/A | Kestra Investment Management, LLC | 0 | -100,00 | 0 | |||||
| 2025-05-14 | 13F | Susquehanna International Group, Llp | 0 | -100,00 | 0 | -100,00 | ||||
| 2025-08-14 | 13F | Gallagher Fiduciary Advisors, LLC | 130.204 | 0,28 | 6.432 | 3,33 | ||||
| 2025-08-14 | 13F | Warren Averett Asset Management, LLC | 18.391 | 26,49 | 909 | 30,27 | ||||
| 2025-08-08 | 13F | Good Life Advisors, LLC | 14.560 | 12,97 | 719 | 16,53 | ||||
| 2025-08-27 | 13F/A | Brinker Capital Investments, LLC | 6.479 | 33,97 | 320 | 38,53 | ||||
| 2025-08-14 | 13F | UBS Group AG | 17.172 | 63,42 | 848 | 68,59 | ||||
| 2025-08-12 | 13F | Proequities, Inc. | 0 | 0 | ||||||
| 2025-07-30 | 13F | Eqis Capital Management, Inc. | 6.905 | -1,16 | 341 | 2,10 | ||||
| 2025-04-18 | 13F | Edge Financial Advisors LLC | 0 | -100,00 | 0 | |||||
| 2025-07-15 | 13F | Palumbo Wealth Management LLC | 21.035 | 2,88 | 1.039 | 6,02 | ||||
| 2025-04-21 | 13F | Clg Llc | 0 | -100,00 | 0 | |||||
| 2025-08-06 | 13F | Commonwealth Equity Services, Llc | 22.533 | -17,25 | 1 | 0,00 | ||||
| 2025-08-12 | 13F | Centric Wealth Management | 195.113 | 1,59 | 9.869 | 7,16 | ||||
| 2025-08-13 | 13F | Northwestern Mutual Wealth Management Co | 359.937 | 8,08 | 17.781 | 11,36 | ||||
| 2025-04-17 | 13F | FNY Investment Advisers, LLC | 0 | -100,00 | 0 | |||||
| 2025-07-17 | 13F | Sound Income Strategies, LLC | 36 | -81,05 | 2 | -88,89 | ||||
| 2025-08-13 | 13F | Flow Traders U.s. Llc | 15.617 | 1 | ||||||
| 2025-08-15 | 13F | Morgan Stanley | 9.363 | -27,99 | 463 | -25,84 | ||||
| 2025-07-31 | 13F | Leavell Investment Management, Inc. | 20.627 | -34,19 | 1.019 | -32,22 | ||||
| 2025-08-14 | 13F | Ausdal Financial Partners, Inc. | 129.937 | 4,97 | 6.417 | 8,14 | ||||
| 2025-07-09 | 13F | Burt Wealth Advisors | 46.544 | 1,72 | 2.299 | 4,83 | ||||
| 2025-09-04 | 13F/A | Advisor Group Holdings, Inc. | 54.008 | 9,84 | 2.668 | 13,19 | ||||
| 2025-05-12 | 13F | Independent Advisor Alliance | 0 | -100,00 | 0 | |||||
| 2025-05-15 | 13F/A | Orion Portfolio Solutions, LLC | 4.836 | -38,08 | 232 | -39,84 | ||||
| 2025-08-04 | 13F | L.m. Kohn & Company | 7.775 | 0,00 | 384 | 3,23 | ||||
| 2025-05-13 | 13F | Aptus Capital Advisors, LLC | 0 | -100,00 | 0 | |||||
| 2025-08-12 | 13F | Steward Partners Investment Advisory, Llc | 2.081 | 0,00 | 103 | 3,03 | ||||
| 2025-07-28 | 13F | Frazier Financial Advisors, LLC | 121 | 0,00 | 6 | 0,00 | ||||
| 2025-08-13 | 13F | Trustmark National Bank Trust Department | 9.000 | 0,00 | 445 | 3,02 | ||||
| 2025-08-14 | 13F | Ameriprise Financial Inc | 422.835 | -22,28 | 20.882 | -20,04 | ||||
| 2025-08-15 | 13F | Equitable Holdings, Inc. | 109.054 | -20,58 | 5.387 | -18,18 | ||||
| 2025-08-14 | 13F | Royal Bank Of Canada | 1.007 | 0,00 | 50 | 4,17 | ||||
| 2025-05-06 | 13F | Avantax Advisory Services, Inc. | 0 | -100,00 | 0 | |||||
| 2025-07-17 | 13F | Financial Designs Corp | 85.395 | -13,80 | 4.219 | -11,20 | ||||
| 2025-08-14 | 13F | Qube Research & Technologies Ltd | 0 | -100,00 | 0 | |||||
| 2025-08-13 | 13F | StoneX Group Inc. | 16.018 | 6,21 | 791 | 9,41 | ||||
| 2025-07-14 | 13F | Enzi Wealth | 257.767 | 0,34 | 12.713 | 6,75 | ||||
| 2025-08-14 | 13F | Goldman Sachs Group Inc | 42.388 | -1,88 | 2.094 | 1,11 | ||||
| 2025-08-19 | 13F | Advisory Services Network, LLC | 43.763 | -50,02 | 2.194 | -47,75 | ||||
| 2025-07-11 | 13F | SILVER OAK SECURITIES, Inc | 58.445 | 0,09 | 2.887 | 3,70 | ||||
| 2025-07-31 | 13F | Cambridge Investment Research Advisors, Inc. | 235.173 | -4,79 | 12 | 0,00 | ||||
| 2025-08-12 | 13F | LPL Financial LLC | 192.035 | -7,40 | 9.487 | -4,60 | ||||
| 2025-08-13 | 13F | GeoWealth Management, LLC | 29.903 | -1,47 | 1.477 | 1,51 | ||||
| 2025-08-29 | 13F | Evolution Wealth Management Inc. | 29 | 1 | ||||||
| 2025-08-08 | 13F | Foundations Investment Advisors, LLC | 27.958 | 208,35 | 1.381 | 218,20 | ||||
| 2025-08-04 | 13F | Atria Investments Llc | 132.837 | -1,10 | 6.562 | 1,89 | ||||
| 2025-08-12 | 13F | Integrated Advisors Network LLC | 8.137 | -40,44 | 402 | -38,78 | ||||
| 2025-05-09 | 13F | Blue Barn Wealth, LLC | 0 | -100,00 | 0 | |||||
| 2025-08-07 | 13F | Allworth Financial LP | 246 | 0,41 | 12 | 9,09 | ||||
| 2025-07-10 | 13F | Wealth Enhancement Advisory Services, Llc | 33.923 | -73,99 | 1.682 | -73,12 | ||||
| 2025-07-18 | 13F | Truist Financial Corp | 6.973 | -6,49 | 344 | -3,64 | ||||
| 2025-08-08 | 13F | Capital Investment Advisory Services, LLC | 8.604 | 11,81 | 425 | 15,49 | ||||
| 2025-08-13 | 13F | Jones Financial Companies Lllp | 0 | -100,00 | 0 | -100,00 | ||||
| 2025-08-14 | 13F | Fmr Llc | 871 | 37,17 | 43 | 43,33 | ||||
| 2025-07-25 | 13F | Atria Wealth Solutions, Inc. | 0 | -100,00 | 0 | |||||
| 2025-08-05 | 13F | Landmark Wealth Management, Inc. | 14.687 | -16,72 | 726 | -14,20 | ||||
| 2025-07-07 | 13F | Centurion Wealth Management LLC | 8.264 | 408 | ||||||
| 2025-08-13 | 13F | EverSource Wealth Advisors, LLC | 166 | 8 | ||||||
| 2025-08-14 | 13F | Jane Street Group, Llc | 16.901 | 96,36 | 835 | 102,43 |