Grundlæggende statistik
| Institutionelle ejere | 84 total, 84 long only, 0 short only, 0 long/short - change of 12,00% MRQ |
| Gennemsnitlig porteføljeallokering | 0.4238 % - change of 60,41% MRQ |
| Institutionelle aktier (lange) | 3.855.950 (ex 13D/G) - change of -0,07MM shares -1,88% MRQ |
| Institutionel værdi (lang) | $ 484.135 USD ($1000) |
Institutionelt ejerskab og aktionærer
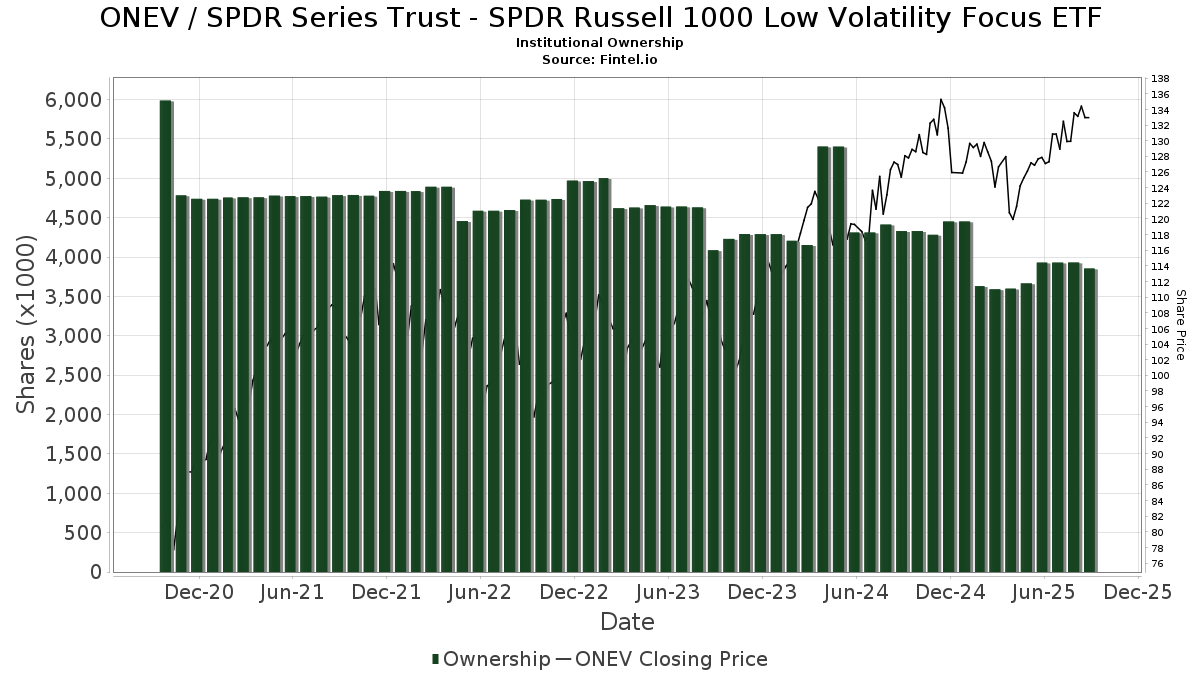
SPDR Series Trust - SPDR Russell 1000 Low Volatility Focus ETF (US:ONEV) har 84 institutionelle ejere og aktionærer, der har indsendt 13D/G- eller 13F-formularer til Securities Exchange Commission (SEC). Disse institutioner har i alt 3,855,950 aktier. Største aktionærer omfatter Alaska Permanent Fund Corp, Ameritas Investment Partners, Inc., LPL Financial LLC, Congress Wealth Management LLC / DE /, Avantax Advisory Services, Inc., Wolf Group Capital Advisors, Integrated Capital Management, LLC, Berkeley, Inc, Dynamic Advisor Solutions LLC, and Kingsview Wealth Management, LLC .
SPDR Series Trust - SPDR Russell 1000 Low Volatility Focus ETF (ARCA:ONEV) institutionel ejerskabsstruktur viser aktuelle positioner i virksomheden efter institutioner og fonde, samt seneste ændringer i positionsstørrelse. Større aktionærer kan omfatte individuelle investorer, investeringsforeninger, hedgefonde eller institutioner. Skema 13D angiver, at investoren besidder (eller besidder) mere end 5 % af virksomheden og har til hensigt (eller har til hensigt at) aktivt at forfølge en ændring i forretningsstrategi. Skema 13G indikerer en passiv investering på over 5%.
The share price as of September 9, 2025 is 133,38 / share. Previously, on September 10, 2024, the share price was 125,72 / share. This represents an increase of 6,10% over that period.
Fondens stemningsscore
Fund Sentiment Score (fka Ownership Accumulation Score) finder de aktier, der bliver mest købt af fonde. Det er resultatet af en sofistikeret, multi-faktor kvantitativ model, der identificerer virksomheder med de højeste niveauer af institutionel akkumulering. Scoringsmodellen bruger en kombination af den samlede stigning i oplyste ejere, ændringerne i porteføljeallokeringer i disse ejere og andre målinger. Tallet går fra 0 til 100, hvor højere tal indikerer et højere niveau af akkumulering for sine jævnaldrende, og 50 er gennemsnittet.
Opdateringsfrekvens: Dagligt
Se Ownership Explorer, som giver en liste over højest rangerende virksomheder.
Institutionel Put/Call-forhold
Ud over at indberette standardaktie- og gældsudstedelser skal institutter med mere end 100 mill. aktiver under forvaltning også oplyse deres put- og call-optionsbeholdninger. Da salgsoptioner generelt indikerer negativ stemning, og købsoptioner indikerer positiv stemning, kan vi få en fornemmelse af den overordnede institutionelle stemning ved at plotte forholdet mellem put og kald. Diagrammet til højre viser det historiske put/call-forhold for dette instrument.
Brug af Put/Call Ratio som en indikator for investorernes stemning overvinder en af de vigtigste mangler ved at bruge totalt institutionelt ejerskab, som er, at en betydelig mængde af aktiver under forvaltning investeres passivt for at spore indekser. Passivt forvaltede fonde køber typisk ikke optioner, så indikatoren for put/call-forholdet følger mere nøje følelsen af aktivt forvaltede fonde.
13F og NPORT arkivering
Detaljer om 13F-arkivering er gratis. Detaljer om NP-ansøgninger kræver et premium-medlemskab. Grønne rækker angiver nye positioner. Røde rækker angiver lukkede positioner. Klik på linket ikon for at se den fulde transaktionshistorik.
Opgrader
for at låse premium-data op og eksportere til Excel ![]() .
.
| Fil dato | Kilde | Investor | Type | Gennemsnitlig pris (Øst) |
Aktier | Δ Aktier (%) |
Rapporteret Værdi ($1000) |
Δ Værdi (%) |
Port Alloc (%) |
|
|---|---|---|---|---|---|---|---|---|---|---|
| 2025-07-10 | 13F | HF Advisory Group, LLC | 11.934 | -1,45 | 1.541 | 0,33 | ||||
| 2025-07-17 | 13F | Fifth Third Securities, Inc. | 15.672 | -9,68 | 2.023 | -8,05 | ||||
| 2025-08-05 | 13F | Dunhill Financial, LLC | 47 | 6 | ||||||
| 2025-08-12 | 13F | Global Retirement Partners, LLC | 615 | 412,50 | 79 | 426,67 | ||||
| 2025-08-07 | 13F | PFG Advisors | 6.632 | -14,99 | 856 | -13,45 | ||||
| 2025-08-14 | 13F | Keystone Financial Services, LLC | 1.878 | 242 | ||||||
| 2025-08-14 | 13F | Hrt Financial Lp | 3.611 | 0 | ||||||
| 2025-07-31 | 13F | Buckingham Strategic Partners | 3.487 | 0,03 | 450 | 1,81 | ||||
| 2025-07-16 | 13F | RWM Asset Management, LLC | 27.575 | 0,07 | 3.560 | 1,89 | ||||
| 2025-07-18 | 13F | Provident Wealth Management, LLC | 39.155 | -1,20 | 5.055 | 0,60 | ||||
| 2025-08-14 | 13F | Fmr Llc | 661 | 25,67 | 85 | 28,79 | ||||
| 2025-08-15 | 13F | Morgan Stanley | 65 | -91,13 | 8 | -91,30 | ||||
| 2025-04-23 | 13F | Golden State Wealth Management, LLC | 0 | -100,00 | 0 | |||||
| 2025-07-09 | 13F | WealthCare Investment Partners, LLC | 2.661 | 0,45 | 349 | 11,50 | ||||
| 2025-08-05 | 13F | Scarborough Advisors, LLC | 2.632 | -1,79 | 340 | 0,00 | ||||
| 2025-08-06 | 13F | Commonwealth Equity Services, Llc | 17.380 | 0,35 | 2 | 0,00 | ||||
| 2025-08-14 | 13F | Avant Capital LLC | 8.008 | 6,28 | 1.034 | 8,17 | ||||
| 2025-08-13 | 13F | Jones Financial Companies Lllp | 4.598 | 33,86 | 591 | 36,81 | ||||
| 2025-08-12 | 13F | O'shaughnessy Asset Management, Llc | 53 | 0,00 | 7 | 0,00 | ||||
| 2025-07-22 | 13F | Integrated Capital Management, LLC | 55.485 | 5,21 | 7 | 16,67 | ||||
| 2025-08-12 | 13F | Proequities, Inc. | 0 | 0 | ||||||
| 2025-08-14 | 13F | Citadel Advisors Llc | 6.125 | -22,87 | 791 | -21,47 | ||||
| 2025-08-12 | 13F | Calton & Associates, Inc. | 7.103 | 917 | ||||||
| 2025-08-11 | 13F | Principal Securities, Inc. | 401 | -2,91 | 52 | 0,00 | ||||
| 2025-08-15 | 13F | Tower Research Capital LLC (TRC) | 5.244 | 288,73 | 677 | 295,32 | ||||
| 2025-07-31 | 13F | Cambridge Investment Research Advisors, Inc. | 3.364 | -15,22 | 0 | |||||
| 2025-08-01 | 13F | Envestnet Asset Management Inc | 11.077 | -31,93 | 1.430 | -30,73 | ||||
| 2025-04-30 | 13F | Stratos Wealth Partners, LTD. | 0 | -100,00 | 0 | |||||
| 2025-07-09 | 13F | Dynamic Advisor Solutions LLC | 46.832 | -2,12 | 6.046 | -0,33 | ||||
| 2025-07-29 | 13F | Stratos Wealth Advisors, LLC | 14.025 | 5,90 | 1.811 | 7,80 | ||||
| 2025-08-14 | 13F | Gotham Asset Management, LLC | 19.266 | 0,00 | 2.487 | 1,84 | ||||
| 2025-07-21 | 13F | Ameritas Advisory Services, LLC | 9.406 | -10,43 | 1.214 | -8,65 | ||||
| 2025-07-24 | 13F | Us Bancorp \de\ | 908 | -27,88 | 117 | -26,42 | ||||
| 2025-08-06 | 13F | Grey Fox Wealth Advisors, LLC | 3.837 | 0,13 | 495 | 2,06 | ||||
| 2025-08-14 | 13F | Alaska Permanent Fund Corp | 2.238.048 | 0,00 | 288.630 | 3,82 | ||||
| 2025-08-08 | 13F | Kingsview Wealth Management, LLC | 42.619 | 0,20 | 5.502 | 2,02 | ||||
| 2025-04-21 | 13F | PSI Advisors, LLC | 0 | -100,00 | 0 | |||||
| 2025-07-11 | 13F | Farther Finance Advisors, LLC | 694 | 0,00 | 90 | 1,14 | ||||
| 2025-08-04 | 13F | Assetmark, Inc | 1.410 | 182 | ||||||
| 2025-04-21 | 13F | Aspiriant, Llc | 0 | -100,00 | 0 | |||||
| 2025-08-14 | 13F | Old Mission Capital Llc | 1.635 | 211 | ||||||
| 2025-08-14 | 13F | Wells Fargo & Company/mn | 1.055 | 174,03 | 136 | 183,33 | ||||
| 2025-08-13 | 13F | Financial Freedom, LLC | 8.692 | -4,00 | 1.122 | -2,18 | ||||
| 2025-08-14 | 13F | GWM Advisors LLC | 2.700 | 0,00 | 349 | 1,75 | ||||
| 2025-08-12 | 13F | Ameritas Investment Partners, Inc. | 323.482 | 3,70 | 41.761 | 5,59 | ||||
| 2025-08-13 | 13F | Northwestern Mutual Wealth Management Co | 33.676 | 6,89 | 4.348 | 8,84 | ||||
| 2025-08-14 | 13F | Ausdal Financial Partners, Inc. | 24.853 | 0,16 | 3.209 | 1,97 | ||||
| 2025-08-11 | 13F | Bellwether Advisors, LLC | 1.280 | 0,00 | 165 | 1,85 | ||||
| 2025-07-08 | 13F | Parallel Advisors, LLC | 290 | 37 | ||||||
| 2025-08-13 | 13F | RIA Advisory Group LLC | 2.911 | 3,74 | 376 | 5,63 | ||||
| 2025-04-18 | 13F | Wolf Group Capital Advisors | 64.046 | 8.121 | ||||||
| 2025-07-08 | 13F | 21 West Wealth Management LLC | 10.855 | 1.401 | ||||||
| 2025-07-07 | 13F | Nova Wealth Management, Inc. | 401 | 25,31 | 52 | 27,50 | ||||
| 2025-08-05 | 13F | Tsfg, Llc | 10.807 | -5,99 | 1 | 0,00 | ||||
| 2025-05-16 | 13F | Arete Wealth Advisors, LLC | 0 | -100,00 | 0 | |||||
| 2025-05-02 | 13F | Bogart Wealth, LLC | 0 | -100,00 | 0 | |||||
| 2025-07-31 | 13F | Glass Jacobson Investment Advisors llc | 213 | -54,49 | 27 | -53,45 | ||||
| 2025-08-14 | 13F | Hilltop Holdings Inc. | 7.912 | 1.021 | ||||||
| 2025-08-04 | 13F | Creative Financial Designs Inc /adv | 9.002 | 15,35 | 1.162 | 17,49 | ||||
| 2025-07-21 | 13F | HighMark Wealth Management LLC | 75 | 0,00 | 10 | 0,00 | ||||
| 2025-07-28 | 13F | Harbour Investments, Inc. | 2 | 100,00 | 0 | |||||
| 2025-08-08 | 13F | Avantax Advisory Services, Inc. | 93.366 | -13,94 | 12.054 | -12,38 | ||||
| 2025-08-14 | 13F | Comerica Bank | 0 | -100,00 | 0 | |||||
| 2025-08-19 | 13F | Newbridge Financial Services Group, Inc. | 1.695 | 0,00 | 219 | 1,87 | ||||
| 2025-08-14 | 13F | Goldman Sachs Group Inc | 1.688 | 218 | ||||||
| 2025-07-10 | 13F | Wealth Enhancement Advisory Services, Llc | 5.539 | -1,32 | 727 | 2,11 | ||||
| 2025-07-30 | 13F | Pacific Sun Financial Corp | 6.063 | 0,63 | 783 | 2,49 | ||||
| 2025-08-14 | 13F | Stifel Financial Corp | 5.474 | 0,00 | 707 | 1,73 | ||||
| 2025-08-19 | 13F | National Asset Management, Inc. | 3.789 | -43,79 | 489 | -42,13 | ||||
| 2025-08-11 | 13F | Vista Cima Wealth Management LLC | 0 | -100,00 | 0 | -100,00 | ||||
| 2025-07-25 | 13F | Cwm, Llc | 165 | -37,74 | 0 | |||||
| 2025-08-15 | 13F | Equitable Holdings, Inc. | 36.350 | 2,15 | 4.693 | 4,01 | ||||
| 2025-08-08 | 13F | Pnc Financial Services Group, Inc. | 13.662 | -16,21 | 1.764 | -14,71 | ||||
| 2025-07-30 | 13F | TFB Advisors LLC | 2.374 | 0,25 | 306 | 2,00 | ||||
| 2025-08-11 | 13F | Private Advisor Group, LLC | 1.694 | 0,06 | 219 | 1,87 | ||||
| 2025-08-14 | 13F | Royal Bank Of Canada | 2.996 | 0,00 | 387 | 1,84 | ||||
| 2025-09-04 | 13F/A | Advisor Group Holdings, Inc. | 14.161 | -38,06 | 1.832 | -36,91 | ||||
| 2025-08-14 | 13F | Mml Investors Services, Llc | 0 | -100,00 | 0 | |||||
| 2025-08-14 | 13F | Susquehanna International Group, Llp | 9.312 | 1.202 | ||||||
| 2025-08-11 | 13F | Berkeley, Inc | 48.012 | 97,73 | 6.198 | 101,36 | ||||
| 2025-08-14 | 13F | Raymond James Financial Inc | 20.101 | 1,14 | 2.595 | 3,02 | ||||
| 2025-08-08 | 13F | Hartland & Co., LLC | 898 | 0,45 | 116 | 1,77 | ||||
| 2025-07-09 | 13F | Fermata Advisors, LLC | 3.074 | 0,03 | 397 | 1,80 | ||||
| 2025-08-13 | 13F | Proactive Wealth Strategies LLC | 11.263 | -0,54 | 1 | 0,00 | ||||
| 2025-07-18 | 13F | SOA Wealth Advisors, LLC. | 7.735 | -5,68 | 999 | -3,95 | ||||
| 2025-08-13 | 13F | Congress Wealth Management LLC / DE / | 128.763 | 16.623 | ||||||
| 2025-08-12 | 13F | LPL Financial LLC | 268.559 | 0,85 | 34.671 | 2,69 | ||||
| 2025-08-14 | 13F | Mariner, LLC | 5.851 | 140,68 | 755 | 145,13 | ||||
| 2025-07-31 | 13F | WFA Asset Management Corp | 3.393 | -17,63 | 401 | -21,53 | ||||
| 2025-08-14 | 13F | Bank Of America Corp /de/ | 27.598 | 4,24 | 3.563 | 6,14 | ||||
| 2025-08-14 | 13F | UBS Group AG | 4.885 | -40,22 | 631 | -39,19 | ||||
| 2025-08-08 | 13F | Cetera Investment Advisers | 6.057 | -2,81 | 782 | -1,14 | ||||
| 2025-07-25 | 13F | Atria Wealth Solutions, Inc. | 2.809 | -25,81 | 369 | -23,33 | ||||
| 2025-08-13 | 13F | Argyle Capital Partners, LLC | 2.229 | 32,36 | 288 | 34,74 |