Grundlæggende statistik
| Institutionelle ejere | 75 total, 75 long only, 0 short only, 0 long/short - change of 0,00% MRQ |
| Gennemsnitlig porteføljeallokering | 0.1004 % - change of -16,64% MRQ |
| Institutionelle aktier (lange) | 1.185.647 (ex 13D/G) - change of 0,02MM shares 2,08% MRQ |
| Institutionel værdi (lang) | $ 55.331 USD ($1000) |
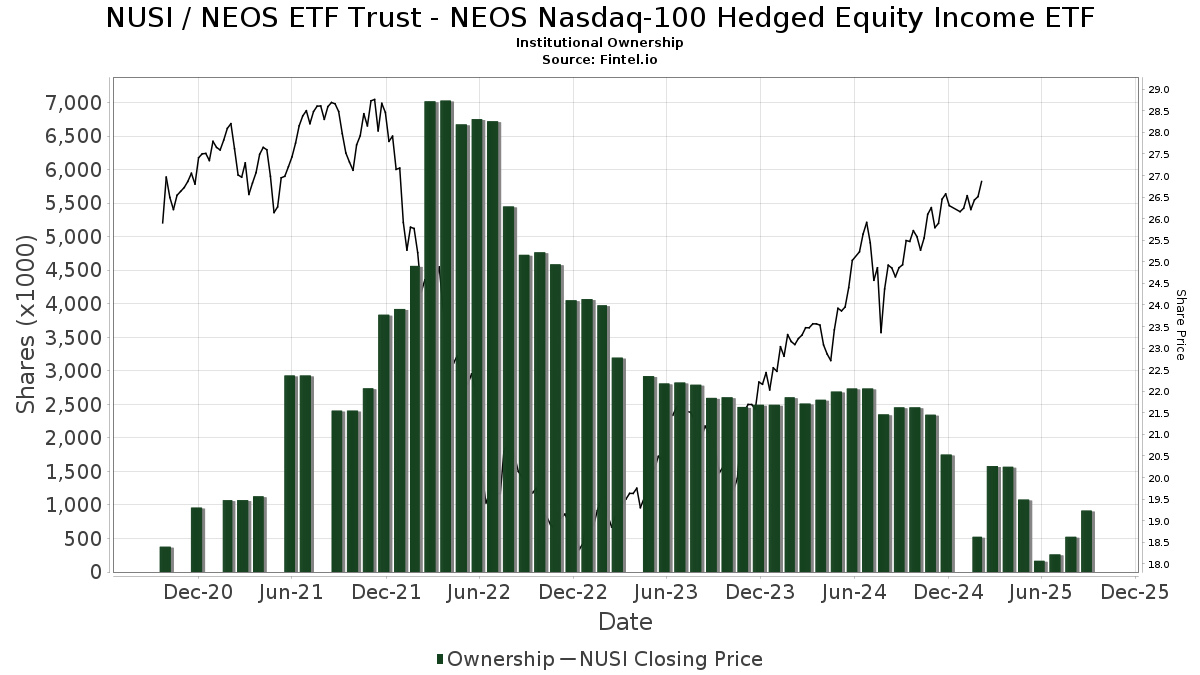
Institutionelt ejerskab og aktionærer
NEOS ETF Trust - NEOS Nasdaq-100 Hedged Equity Income ETF (US:NUSI) har 75 institutionelle ejere og aktionærer, der har indsendt 13D/G- eller 13F-formularer til Securities Exchange Commission (SEC). Disse institutioner har i alt 1,185,647 aktier. Største aktionærer omfatter LPL Financial LLC, Janney Montgomery Scott LLC, PFG Investments, LLC, Hartland & Co., LLC, Wealthstar Advisors, Llc, Thayer Partners, LLC / MA, Rps Advisory Solutions Llc, Advisor Group Holdings, Inc., RFG Advisory, LLC, and Raymond James Financial Inc .
NEOS ETF Trust - NEOS Nasdaq-100 Hedged Equity Income ETF (NasdaqGM:NUSI) institutionel ejerskabsstruktur viser aktuelle positioner i virksomheden efter institutioner og fonde, samt seneste ændringer i positionsstørrelse. Større aktionærer kan omfatte individuelle investorer, investeringsforeninger, hedgefonde eller institutioner. Skema 13D angiver, at investoren besidder (eller besidder) mere end 5 % af virksomheden og har til hensigt (eller har til hensigt at) aktivt at forfølge en ændring i forretningsstrategi. Skema 13G indikerer en passiv investering på over 5%.
Fondens stemningsscore
Fund Sentiment Score (fka Ownership Accumulation Score) finder de aktier, der bliver mest købt af fonde. Det er resultatet af en sofistikeret, multi-faktor kvantitativ model, der identificerer virksomheder med de højeste niveauer af institutionel akkumulering. Scoringsmodellen bruger en kombination af den samlede stigning i oplyste ejere, ændringerne i porteføljeallokeringer i disse ejere og andre målinger. Tallet går fra 0 til 100, hvor højere tal indikerer et højere niveau af akkumulering for sine jævnaldrende, og 50 er gennemsnittet.
Opdateringsfrekvens: Dagligt
Se Ownership Explorer, som giver en liste over højest rangerende virksomheder.
AI+ Ask Fintel’s AI assistant about NEOS ETF Trust - NEOS Nasdaq-100 Hedged Equity Income ETF.
Select a question to share a public post with an AI-crafted answer.
Thinking of good questions…
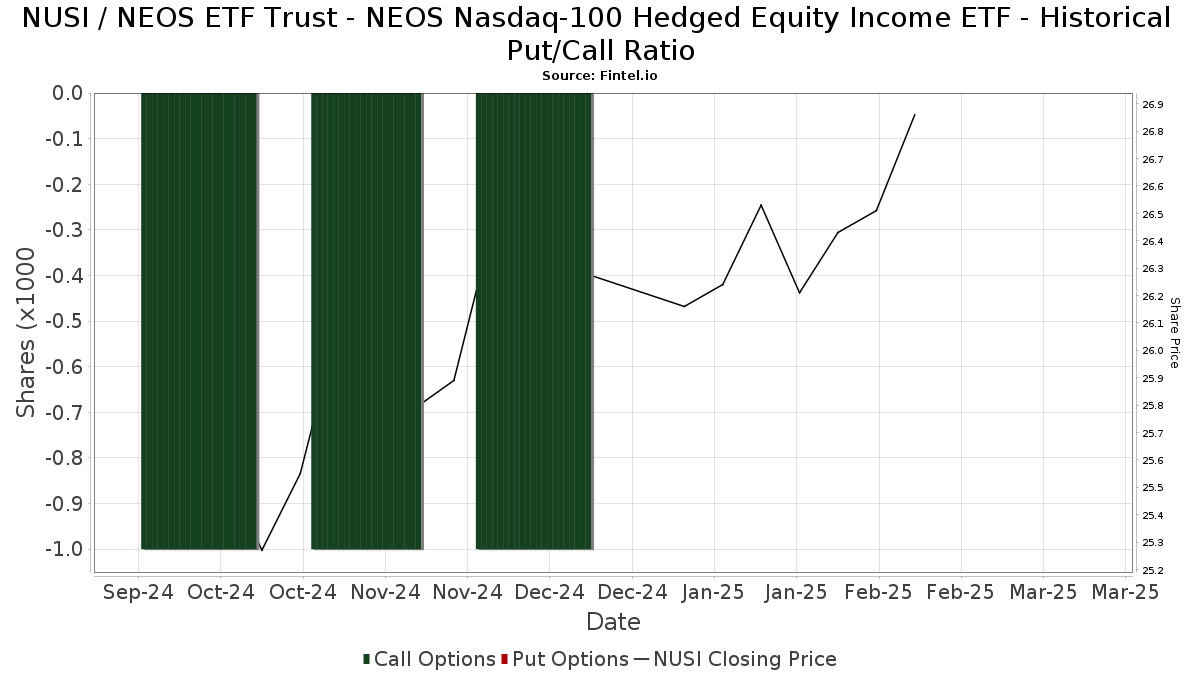
Institutionel Put/Call-forhold
Ud over at indberette standardaktie- og gældsudstedelser skal institutter med mere end 100 mill. aktiver under forvaltning også oplyse deres put- og call-optionsbeholdninger. Da salgsoptioner generelt indikerer negativ stemning, og købsoptioner indikerer positiv stemning, kan vi få en fornemmelse af den overordnede institutionelle stemning ved at plotte forholdet mellem put og kald. Diagrammet til højre viser det historiske put/call-forhold for dette instrument.
Brug af Put/Call Ratio som en indikator for investorernes stemning overvinder en af de vigtigste mangler ved at bruge totalt institutionelt ejerskab, som er, at en betydelig mængde af aktiver under forvaltning investeres passivt for at spore indekser. Passivt forvaltede fonde køber typisk ikke optioner, så indikatoren for put/call-forholdet følger mere nøje følelsen af aktivt forvaltede fonde.
13F og NPORT arkivering
Detaljer om 13F-arkivering er gratis. Detaljer om NP-ansøgninger kræver et premium-medlemskab. Grønne rækker angiver nye positioner. Røde rækker angiver lukkede positioner. Klik på linket ikon for at se den fulde transaktionshistorik.
Opgrader
for at låse premium-data op og eksportere til Excel ![]() .
.
| Fil dato | Kilde | Investor | Type | Gennemsnitlig pris (Øst) |
Aktier | Δ Aktier (%) |
Rapporteret Værdi ($1000) |
Δ Værdi (%) |
Port Alloc (%) |
|
|---|---|---|---|---|---|---|---|---|---|---|
| 2026-01-20 | 13F | Stratos Wealth Advisors, LLC | 16.294 | 1,49 | 885 | 1,26 | ||||
| 2026-01-29 | 13F | UBS Group AG | 2.339 | 178,12 | 127 | 182,22 | ||||
| 2026-02-06 | 13F | Rps Advisory Solutions Llc | 42.432 | 42,18 | 2.304 | 41,96 | ||||
| 2026-02-13 | 13F | Centaurus Financial, Inc. | 4.377 | 11,77 | 0 | |||||
| 2026-01-21 | 13F | Future Financial Wealth Managment LLC | 0 | -100,00 | 0 | |||||
| 2026-02-12 | 13F | Triumph Capital Management | 14 | 0,00 | 1 | |||||
| 2026-02-13 | 13F | Stifel Financial Corp | 17.053 | -15,67 | 926 | -15,74 | ||||
| 2025-10-20 | 13F | Mid-American Wealth Advisory Group, Inc. | 0 | -100,00 | 0 | |||||
| 2026-04-10 | 13F | Quaker Wealth Management, LLC | 125 | 0,00 | 6 | 0,00 | ||||
| 2026-02-02 | 13F | Oppenheimer & Co Inc | 4.065 | 0,00 | 221 | -0,45 | ||||
| 2026-02-12 | 13F | Founders Financial Alliance, LLC | 0 | -100,00 | 0 | |||||
| 2026-01-07 | 13F | Puff Wealth Management, Llc | 3.740 | 203 | ||||||
| 2026-02-11 | 13F | LPL Financial LLC | 215.797 | 10,24 | 11.718 | 10,05 | ||||
| 2026-02-13 | 13F | MAI Capital Management | 927 | 1,53 | 50 | 2,04 | ||||
| 2026-02-17 | 13F | Advisory Services Network, LLC | 11.407 | 1,78 | 619 | 1,64 | ||||
| 2026-01-26 | 13F | PFG Investments, LLC | 74.219 | 1,88 | 4.030 | 1,72 | ||||
| 2026-02-03 | 13F | RFG Advisory, LLC | 35.167 | 1.910 | ||||||
| 2026-02-09 | 13F | Collaborative Wealth Managment Inc. | 6.756 | 0,00 | 367 | -0,27 | ||||
| 2026-01-30 | 13F | Wealthstar Advisors, Llc | 65.780 | 0,02 | 3.572 | -0,14 | ||||
| 2025-11-13 | 13F | Fmr Llc | 0 | -100,00 | 0 | |||||
| 2026-04-07 | 13F | Farther Finance Advisors, LLC | 540 | 0,00 | 28 | -6,90 | ||||
| 2026-02-12 | 13F | Commonwealth Equity Services, Llc | 28.090 | -3,19 | 1.525 | 152.400,00 | ||||
| 2026-01-26 | 13F | Private Trust Co Na | 550 | -26,67 | 30 | -27,50 | ||||
| 2026-02-12 | 13F | Federation des caisses Desjardins du Quebec | 2.479 | -17,23 | 135 | -17,28 | ||||
| 2026-02-12 | 13F | Steward Partners Investment Advisory, Llc | 264 | 2,33 | 14 | 0,00 | ||||
| 2026-04-07 | 13F | Signaturefd, Llc | 700 | 16,67 | 36 | 9,38 | ||||
| 2026-02-11 | 13F | Janney Montgomery Scott LLC | 140.520 | -2,21 | 8 | 0,00 | ||||
| 2026-02-04 | 13F | CAP Partners, LLC | 11.306 | 0,51 | 614 | 0,33 | ||||
| 2026-04-13 | 13F | IFP Advisors, Inc | 2.876 | 275,95 | 147 | 258,54 | ||||
| 2026-02-17 | 13F | Old Mission Capital Llc | 0 | -100,00 | 0 | |||||
| 2026-02-04 | 13F | Meridian Wealth Management, LLC | 4.816 | 0,00 | 262 | 0,00 | ||||
| 2026-03-04 | 13F | SHP Wealth Management | 905 | 49 | ||||||
| 2026-02-13 | 13F | Morgan Stanley | 3.748 | 12,86 | 204 | 12,78 | ||||
| 2026-01-21 | 13F | Capital Investment Advisory Services, LLC | 630 | 0,00 | 34 | 0,00 | ||||
| 2026-02-06 | 13F | GPS Wealth Strategies Group, LLC | 0 | -100,00 | 0 | -100,00 | ||||
| 2026-02-10 | 13F | Envestnet Asset Management Inc | 0 | -100,00 | 0 | |||||
| 2026-02-13 | 13F | Wells Fargo & Company/mn | 4 | -98,55 | 0 | -100,00 | ||||
| 2026-02-17 | 13F | Advisor Group Holdings, Inc. | 39.256 | -45,70 | 2.132 | -44,59 | ||||
| 2026-01-06 | 13F | Tucker Asset Management Llc | 0 | -100,00 | 0 | |||||
| 2026-02-10 | 13F | B&l Asset Management Llc | 7.153 | 0,00 | 388 | -0,26 | ||||
| 2026-04-14 | 13F | Nbc Securities, Inc. | 4.562 | -5,02 | 234 | -10,38 | ||||
| 2026-02-13 | 13F | Level Four Advisory Services, Llc | 4.161 | 0,95 | 226 | 0,45 | ||||
| 2026-01-21 | 13F | TPG Advisors LLC | 9.553 | 1,90 | 519 | 1,77 | ||||
| 2026-01-26 | 13F | Patriot Financial Group Insurance Agency, LLC | 3.728 | 202 | ||||||
| 2026-02-05 | 13F | Cambridge Investment Research Advisors, Inc. | 14.760 | -0,86 | 1 | |||||
| 2026-02-04 | 13F | Dogwood Wealth Management LLC | 1.586 | 2,26 | 86 | 2,38 | ||||
| 2026-02-09 | 13F | Harbour Investments, Inc. | 1.264 | 0,80 | 69 | 0,00 | ||||
| 2026-01-27 | 13F | Elevated Capital Advisors, LLC | 4.021 | 0,00 | 218 | 0,00 | ||||
| 2026-01-26 | 13F | AE Wealth Management LLC | 4.631 | 2,73 | 251 | 2,45 | ||||
| 2026-02-12 | 13F | Atlantic Family Wealth, Llc | 8.858 | 0,00 | 481 | 0,00 | ||||
| 2026-02-05 | 13F | Allworth Financial LP | 925 | 10,78 | 50 | 11,11 | ||||
| 2026-01-28 | 13F | Chicago Partners Investment Group LLC | 12.250 | 1,00 | 670 | -0,45 | ||||
| 2026-02-05 | 13F | Thayer Partners, LLC / MA | 54.773 | 2.974 | ||||||
| 2026-02-12 | 13F | StoneX Group Inc. | 9.642 | 9,84 | 524 | 9,64 | ||||
| 2026-02-05 | 13F | Millennium Capital Advisors, LLC | 7.732 | 10,74 | 420 | 10,55 | ||||
| 2026-02-18 | 13F | Caitlin John, LLC | 49 | 0,00 | 3 | 0,00 | ||||
| 2026-02-17 | 13F | Bank Of America Corp /de/ | 0 | -100,00 | 0 | |||||
| 2026-02-06 | 13F | Larson Financial Group LLC | 0 | -100,00 | 0 | |||||
| 2026-01-26 | 13F | Moran Wealth Management, LLC | 12.608 | 685 | ||||||
| 2026-02-17 | 13F | Cetera Investment Advisers | 20.494 | 1,16 | 1.113 | 0,91 | ||||
| 2026-01-21 | 13F | Prime Capital Investment Advisors, LLC | 6.851 | 2,27 | 372 | 2,20 | ||||
| 2026-02-20 | 13F | Anchor Capital Management Group Inc | 14.000 | 0,00 | 762 | 0,00 | ||||
| 2025-11-05 | 13F | Moloney Securities Asset Management, LLC | 0 | -100,00 | 0 | |||||
| 2026-02-13 | 13F | Mml Investors Services, Llc | 0 | -100,00 | 0 | |||||
| 2026-02-09 | 13F | Huntington National Bank | 3 | |||||||
| 2026-01-30 | 13F | United Community Bank | 380 | 21 | ||||||
| 2026-02-17 | 13F | Private Advisor Group, LLC | 32.661 | 1,15 | 1.774 | 0,97 | ||||
| 2026-01-30 | 13F | Sigma Planning Corp | 4.577 | -3,01 | 249 | -3,12 | ||||
| 2026-02-13 | 13F | Goldstone Financial Group, LLC | 26.029 | -3,83 | 1.413 | -4,01 | ||||
| 2026-02-17 | 13F | Royal Bank Of Canada | 8.748 | 26,84 | 475 | 26,67 | ||||
| 2026-02-17 | 13F | Raymond James Financial Inc | 34.232 | 19,95 | 1.859 | 19,72 | ||||
| 2026-04-17 | 13F | Signal Advisors Wealth, LLC | 15.670 | -14,83 | 803 | -19,62 | ||||
| 2026-01-28 | 13F | Palacios Wealth Management, LLC | 4.946 | 0,00 | 269 | -0,37 | ||||
| 2026-01-15 | 13F | RiverTree Advisors, LLC | 0 | -100,00 | 0 | -100,00 | ||||
| 2026-02-13 | 13F | Colony Group, LLC | 17.132 | 30,46 | 931 | 30,25 | ||||
| 2026-01-30 | 13F | Jackson Hole Capital Partners, LLC | 3.500 | 190 | ||||||
| 2026-04-14 | 13F | Prospera Financial Services Inc | 6.627 | 340 | ||||||
| 2026-01-29 | 13F | Concord Wealth Partners | 140 | 2,19 | 8 | 0,00 | ||||
| 2026-01-26 | 13F | Cwm, Llc | 250 | 0 | ||||||
| 2026-04-07 | 13F | CoreCap Advisors, LLC | 1.092 | 0,00 | 56 | -6,78 | ||||
| 2026-02-06 | 13F | HighTower Advisors, LLC | 5.051 | 0,18 | 274 | 0,00 | ||||
| 2026-02-13 | 13F | Kestra Advisory Services, LLC | 744 | 40 | ||||||
| 2026-02-09 | 13F | Hartland & Co., LLC | 65.828 | 8,19 | 3.575 | 8,01 | ||||
| 2026-02-12 | 13F | Wedbush Securities Inc | 4.261 | 0 | ||||||
| 2026-01-27 | 13F | Davies Financial Advisors, Inc. | 0 | -100,00 | 0 | |||||
| 2026-04-17 | 13F | High Net Worth Advisory Group LLC | 5.950 | 0,00 | 305 | -5,88 | ||||
| 2026-02-06 | 13F | Global Retirement Partners, LLC | 606 | 0,00 | 33 | 0,00 | ||||
| 2026-02-17 | 13F | Quantinno Capital Management LP | 5.121 | 2,26 | 278 | 2,21 | ||||
| 2026-01-21 | 13F | Flagship Harbor Advisors, Llc | 423 | 23 | ||||||
| 2026-02-04 | 13F | Ameritas Advisory Services, LLC | 0 | -100,00 | 0 | |||||
| 2026-02-18 | 13F | Garton & Associates Financial Advisors LLC | 902 | 49 |
Other Listings
| US:QQQH | 53,74 $ |