Grundlæggende statistik
| Institutionelle aktier (lange) | 4.030.467 - 56,26% (ex 13D/G) - change of -1,27MM shares -24,01% MRQ |
| Institutionel værdi (lang) | $ 423.951 USD ($1000) |
Institutionelt ejerskab og aktionærer
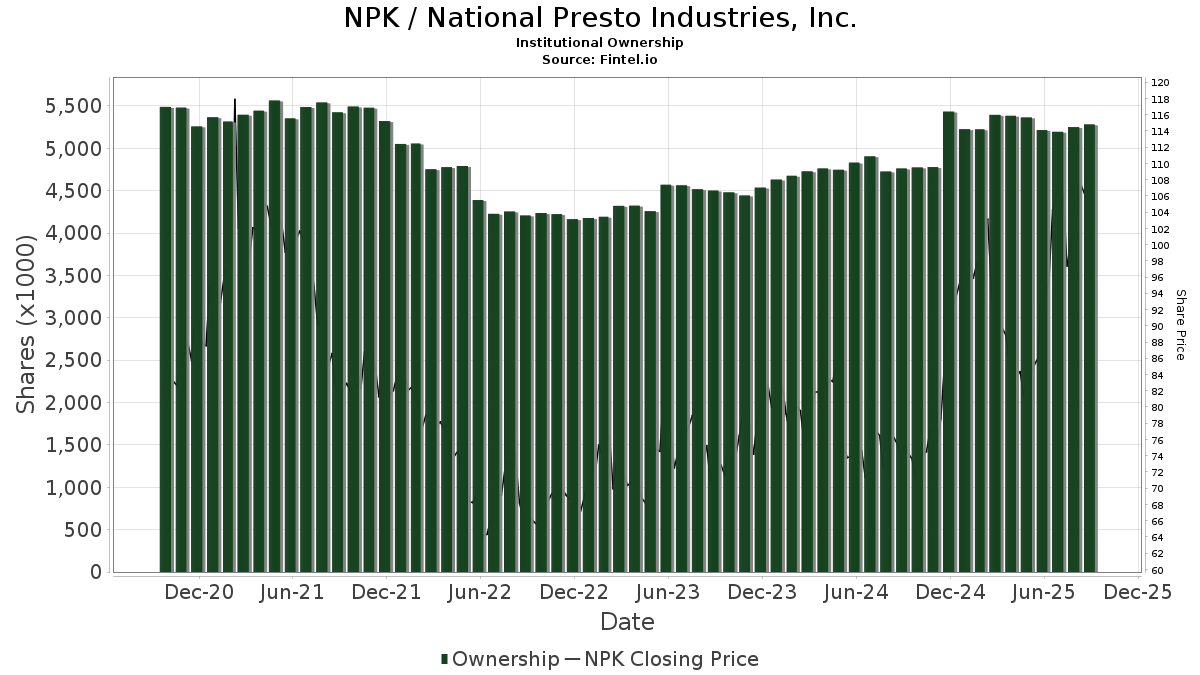
National Presto Industries, Inc. (US:NPK) har 165 institutionelle ejere og aktionærer, der har indsendt 13D/G- eller 13F-formularer til Securities Exchange Commission (SEC). Disse institutioner har i alt 4,030,467 aktier. Største aktionærer omfatter BlackRock, Inc., Vanguard Group Inc, State Street Corp, Dimensional Fund Advisors Lp, Medina Singh Partners, LLC, Renaissance Technologies Llc, Geode Capital Management, Llc, J. Goldman & Co LP, Gamco Investors, Inc. Et Al, and Invesco Ltd. .
National Presto Industries, Inc. (NYSE:NPK) institutionel ejerskabsstruktur viser aktuelle positioner i virksomheden efter institutioner og fonde, samt seneste ændringer i positionsstørrelse. Større aktionærer kan omfatte individuelle investorer, investeringsforeninger, hedgefonde eller institutioner. Skema 13D angiver, at investoren besidder (eller besidder) mere end 5 % af virksomheden og har til hensigt (eller har til hensigt at) aktivt at forfølge en ændring i forretningsstrategi. Skema 13G indikerer en passiv investering på over 5%.
The share price as of March 31, 2026 is 137,06 / share. Previously, on April 1, 2025, the share price was 88,46 / share. This represents an increase of 54,94% over that period.
Fondens stemningsscore
Fund Sentiment Score (fka Ownership Accumulation Score) finder de aktier, der bliver mest købt af fonde. Det er resultatet af en sofistikeret, multi-faktor kvantitativ model, der identificerer virksomheder med de højeste niveauer af institutionel akkumulering. Scoringsmodellen bruger en kombination af den samlede stigning i oplyste ejere, ændringerne i porteføljeallokeringer i disse ejere og andre målinger. Tallet går fra 0 til 100, hvor højere tal indikerer et højere niveau af akkumulering for sine jævnaldrende, og 50 er gennemsnittet.
Opdateringsfrekvens: Dagligt
Se Ownership Explorer, som giver en liste over højest rangerende virksomheder.
AI+ Ask Fintel’s AI assistant about National Presto Industries, Inc..
Select a question to share a public post with an AI-crafted answer.
Thinking of good questions…
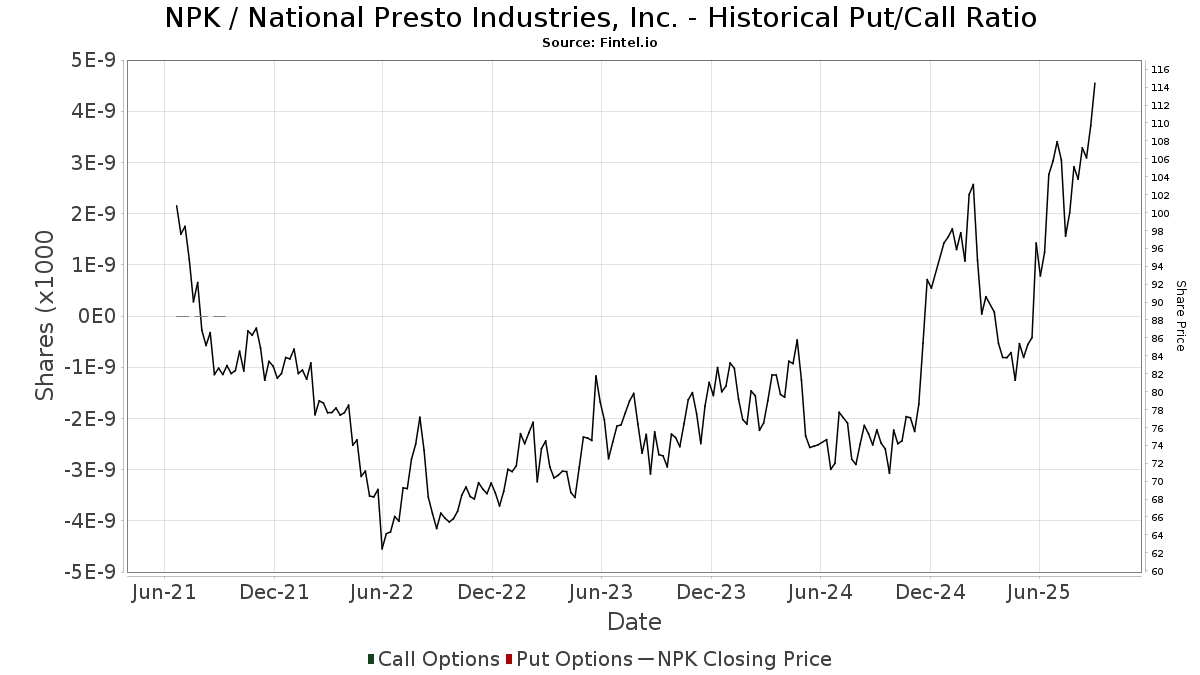
Institutionel Put/Call-forhold
Ud over at indberette standardaktie- og gældsudstedelser skal institutter med mere end 100 mill. aktiver under forvaltning også oplyse deres put- og call-optionsbeholdninger. Da salgsoptioner generelt indikerer negativ stemning, og købsoptioner indikerer positiv stemning, kan vi få en fornemmelse af den overordnede institutionelle stemning ved at plotte forholdet mellem put og kald. Diagrammet til højre viser det historiske put/call-forhold for dette instrument.
Brug af Put/Call Ratio som en indikator for investorernes stemning overvinder en af de vigtigste mangler ved at bruge totalt institutionelt ejerskab, som er, at en betydelig mængde af aktiver under forvaltning investeres passivt for at spore indekser. Passivt forvaltede fonde køber typisk ikke optioner, så indikatoren for put/call-forholdet følger mere nøje følelsen af aktivt forvaltede fonde.
13D/G-arkivering
Vi præsenterer 13D/G ansøgninger separat fra 13F ansøgninger på grund af den forskellige behandling af SEC. 13D/G-ansøgninger kan indgives af grupper af investorer (med én ledende), hvorimod 13F-ansøgninger ikke kan. Dette resulterer i situationer, hvor en investor kan indsende en 13D/G, der rapporterer én værdi for de samlede aktier (der repræsenterer alle de aktier, der ejes af investorgruppen), men derefter indsender en 13F, der rapporterer en anden værdi for de samlede aktier (der udelukkende repræsenterer deres egne) ejendomsret). Det betyder, at aktieejerskab af 13D/G-arkiver og 13F-arkiveringer ofte ikke er direkte sammenlignelige, så vi præsenterer dem separat.
Bemærk: Fra den 16. maj 2021 viser vi ikke længere ejere, der ikke har indsendt en 13D/G inden for det seneste år. Tidligere viste vi den fulde historie af 13D/G-arkiver. Generelt skal enheder, der er forpligtet til at indgive 13D/G-ansøgninger, indgive mindst årligt, før de indsender en afsluttende ansøgning. Dog forlader fonde nogle gange positioner uden at indsende en afsluttende ansøgning (dvs. de afvikler), så visning af den fulde historie resulterede nogle gange i forvirring om det nuværende ejerskab. For at undgå forvirring viser vi nu kun 'aktuelle' ejere - det vil sige - ejere, der har anmeldt inden for det seneste år.
Upgrade to unlock premium data.
| Fil dato | Form | Investor | Forrige Aktier |
Seneste Aktier |
Δ Aktier (Procent) |
Ejendomsret (Procent) |
Δ Ejerskab (Procent) |
|
|---|---|---|---|---|---|---|---|---|
| 2026-03-27 | VANGUARD GROUP INC | 362,076 | 0 | -100.00 | 0.00 | -100.00 | ||
| 2025-12-05 | Albion River Management LLC | 362,350 | 5.07 | |||||
| 2025-04-28 | BlackRock, Inc. | 928,980 | 831,156 | -10.53 | 11.60 | -11.45 | ||
| 2025-04-15 | DIMENSIONAL FUND ADVISORS LP | 356,919 | 341,117 | -4.43 | 4.80 | -4.00 |
13F og NPORT arkivering
Detaljer om 13F-arkivering er gratis. Detaljer om NP-ansøgninger kræver et premium-medlemskab. Grønne rækker angiver nye positioner. Røde rækker angiver lukkede positioner. Klik på linket ikon for at se den fulde transaktionshistorik.
Opgrader
for at låse premium-data op og eksportere til Excel ![]() .
.
| Fil dato | Kilde | Investor | Type | Gennemsnitlig pris (Øst) |
Aktier | Δ Aktier (%) |
Rapporteret Værdi ($1000) |
Δ Værdi (%) |
Port Alloc (%) |
|
|---|---|---|---|---|---|---|---|---|---|---|
| 2026-02-13 | 13F | Kennedy Capital Management, Inc. | 56.666 | -0,54 | 6.050 | -5,32 | ||||
| 2025-11-14 | 13F | Cubist Systematic Strategies, LLC | 0 | -100,00 | 0 | -100,00 | ||||
| 2026-02-13 | 13F | Martingale Asset Management L P | 9.046 | 2,74 | 966 | -2,23 | ||||
| 2026-02-17 | 13F | Occudo Quantitative Strategies Lp | 0 | -100,00 | 0 | |||||
| 2025-11-12 | 13F | Royce & Associates Lp | 0 | -100,00 | 0 | |||||
| 2026-01-29 | 13F | Comerica Bank | 1.229 | -16,79 | 131 | -20,61 | ||||
| 2026-02-10 | 13F | Quantbot Technologies LP | 0 | -100,00 | 0 | |||||
| 2026-02-12 | 13F | Sit Investment Associates Inc | 0 | -100,00 | 0 | |||||
| 2026-02-13 | 13F | Smartleaf Asset Management LLC | 102 | 14,61 | 11 | 11,11 | ||||
| 2026-02-05 | 13F | Atria Investments Llc | 1.931 | -0,36 | 206 | -5,07 | ||||
| 2026-02-13 | 13F | Verition Fund Management LLC | 2.531 | -52,67 | 270 | -54,92 | ||||
| 2025-11-12 | 13F | Victory Capital Management Inc | 0 | -100,00 | 0 | |||||
| 2026-01-07 | 13F | Massmutual Trust Co Fsb/adv | 162 | 0,00 | 17 | -5,56 | ||||
| 2026-02-12 | 13F | CIBC Private Wealth Group, LLC | 500 | 53 | ||||||
| 2026-02-13 | 13F | Prudential Financial Inc | 5.125 | -7,52 | 547 | -11,92 | ||||
| 2026-01-20 | 13F | Signaturefd, Llc | 119 | -4,80 | 13 | -14,29 | ||||
| 2026-02-17 | 13F | Optiver Holding B.V. | 0 | -100,00 | 0 | |||||
| 2026-02-13 | 13F | American Century Companies Inc | 14.395 | 0,02 | 1.537 | -4,83 | ||||
| 2026-02-17 | 13F | Aqr Capital Management Llc | 4.900 | 8,10 | 523 | 2,95 | ||||
| 2026-02-12 | 13F | Renaissance Technologies Llc | 162.800 | -11,04 | 17.381 | -15,31 | ||||
| 2026-02-17 | 13F | Trexquant Investment LP | 2.130 | -11,47 | 227 | -15,61 | ||||
| 2026-02-17 | 13F | Price T Rowe Associates Inc /md/ | 5.526 | 6,87 | 1 | |||||
| 2026-01-05 | 13F | GAMMA Investing LLC | 264 | -7,37 | 28 | -9,68 | ||||
| 2026-02-11 | 13F | Jpmorgan Chase & Co | 22.556 | 35,80 | 2.408 | 29,32 | ||||
| 2026-02-13 | 13F | Pinnacle Wealth Planning Services, Inc. | 149 | 16 | ||||||
| 2026-02-13 | 13F | Martin & Co Inc /tn/ | 28.746 | 2,89 | 3.069 | -2,07 | ||||
| 2026-01-23 | 13F | State of Alaska, Department of Revenue | 3.035 | -0,36 | 0 | |||||
| 2026-02-13 | 13F | Parkside Financial Bank & Trust | 7 | 0,00 | 1 | |||||
| 2026-01-28 | 13F | Universal- Beteiligungs- und Servicegesellschaft mbH | 2.400 | -11,11 | 256 | -15,23 | ||||
| 2025-10-16 | 13F | Ellsworth Advisors, LLC | 0 | -100,00 | 0 | |||||
| 2026-02-06 | 13F | EverSource Wealth Advisors, LLC | 375 | -32,92 | 40 | -35,48 | ||||
| 2026-01-21 | 13F | Newbridge Financial Services Group, Inc. | 800 | 0,00 | 85 | -4,49 | ||||
| 2026-02-13 | 13F | Segall Bryant & Hamill, Llc | 11.092 | 1.184 | ||||||
| 2026-02-13 | 13F | Wells Fargo & Company/mn | 6.233 | 43,02 | 665 | 36,27 | ||||
| 2026-02-12 | 13F | BlackRock, Inc. | 868.497 | 1,86 | 92.721 | -3,03 | ||||
| 2026-02-17 | 13F | EVR Research LP | 75.000 | 82,93 | 8.007 | 74,14 | ||||
| 2026-02-17 | 13F | Guggenheim Capital Llc | 8.068 | -34,03 | 861 | 15,88 | ||||
| 2026-02-12 | 13F | Swiss National Bank | 10.600 | -3,64 | 1.132 | -8,27 | ||||
| 2026-02-17 | 13F | Quantinno Capital Management LP | 2.670 | 35,12 | 285 | 28,96 | ||||
| 2026-02-17 | 13F | Numerai GP LLC | 0 | -100,00 | 0 | -100,00 | ||||
| 2026-02-06 | 13F | Pnc Financial Services Group, Inc. | 252 | 14,55 | 27 | 8,33 | ||||
| 2026-02-17 | 13F | Millennium Management Llc | 54.741 | 6,63 | 5.844 | 1,51 | ||||
| 2026-02-02 | 13F | Fifth Third Bancorp | 11 | -45,00 | 1 | -50,00 | ||||
| 2026-02-11 | 13F | Deutsche Bank Ag\ | 3.347 | 16,17 | 357 | 10,53 | ||||
| 2026-02-04 | 13F | Oregon Public Employees Retirement Fund | 1.204 | 0,00 | 129 | -5,19 | ||||
| 2025-11-13 | 13F | Sei Investments Co | 0 | -100,00 | 0 | |||||
| 2026-02-06 | 13F | Covestor Ltd | 2 | 0,00 | 0 | |||||
| 2026-02-13 | 13F | Police & Firemen's Retirement System of New Jersey | 1.434 | 0,00 | 153 | -4,37 | ||||
| 2025-11-14 | 13F | Centiva Capital, LP | 0 | -100,00 | 0 | |||||
| 2026-02-17 | 13F | Susquehanna Fundamental Investments, Llc | 1.875 | 0,00 | 200 | -4,76 | ||||
| 2026-02-12 | 13F | Quadrant Capital Group Llc | 366 | 0,00 | 39 | -4,88 | ||||
| 2026-02-13 | 13F | Morgan Stanley | 67.993 | 4,99 | 7.259 | -0,04 | ||||
| 2025-11-14 | 13F | Point72 Asia (Singapore) Pte. Ltd. | 0 | -100,00 | 0 | |||||
| 2026-02-12 | 13F | Dimensional Fund Advisors Lp | 320.124 | -0,83 | 34.176 | -5,59 | ||||
| 2026-02-03 | 13F | International Assets Investment Management, Llc | 300 | 32 | ||||||
| 2026-02-05 | 13F | Gamco Investors, Inc. Et Al | 95.819 | 0,55 | 10.230 | -4,29 | ||||
| 2026-02-13 | 13F | First Trust Advisors Lp | 30.048 | 53,30 | 3.208 | 45,91 | ||||
| 2026-02-17 | 13F | Alliancebernstein L.p. | 4.892 | 0,00 | 522 | -4,74 | ||||
| 2026-02-12 | 13F | Nuveen, LLC | 11.392 | 0,00 | 1.216 | -4,78 | ||||
| 2026-02-12 | 13F | Ensign Peak Advisors, Inc | 1.143 | -57,56 | 122 | -59,60 | ||||
| 2026-02-05 | 13F | Gabelli Funds Llc | 25.752 | 0,00 | 2.749 | -4,81 | ||||
| 2026-02-17 | 13F | Tower Research Capital LLC (TRC) | 264 | 20,55 | 28 | 16,67 | ||||
| 2026-02-17 | 13F | Russell Investments Group, Ltd. | 902 | 6,37 | 96 | 1,05 | ||||
| 2026-02-10 | 13F | Bnp Paribas Arbitrage, Sa | 3.838 | -58,89 | 410 | -60,94 | ||||
| 2026-01-09 | 13F | SG Americas Securities, LLC | 7.167 | -17,43 | 1 | |||||
| 2026-02-13 | 13F | Charles Schwab Investment Management Inc | 49.560 | 4,49 | 5.291 | -0,53 | ||||
| 2026-02-11 | 13F | CLARET ASSET MANAGEMENT Corp | 8.230 | -19,19 | 1 | -100,00 | ||||
| 2026-02-13 | 13F | Kestra Advisory Services, LLC | 250 | 27 | ||||||
| 2026-02-18 | 13F | State of Tennessee, Treasury Department | 1.163 | -7,26 | 148 | 5,71 | ||||
| 2026-01-30 | 13F | New York State Teachers Retirement System | 7.554 | 1,34 | 1 | |||||
| 2026-02-13 | 13F | JustInvest LLC | 2.551 | 272 | ||||||
| 2026-02-13 | 13F | Citigroup Inc | 5.790 | -28,57 | 618 | -32,01 | ||||
| 2026-02-17 | 13F | California State Teachers Retirement System | 4.904 | -1,11 | 524 | -5,94 | ||||
| 2025-11-21 | 13F | Nebula Research & Development LLC | 0 | -100,00 | 0 | |||||
| 2026-01-27 | 13F | First Horizon Corp | 85 | 0,00 | 9 | 0,00 | ||||
| 2026-02-09 | 13F | Geode Capital Management, Llc | 137.752 | 1,13 | 14.709 | -3,73 | ||||
| 2026-01-26 | 13F | Cwm, Llc | 6.970 | -15,43 | 1 | |||||
| 2026-02-14 | 13F | Rockefeller Capital Management L.P. | 5 | -28,57 | 1 | |||||
| 2026-02-13 | 13F | Sterling Capital Management LLC | 303 | -15,60 | 32 | -20,00 | ||||
| 2026-02-12 | 13F | New York State Common Retirement Fund | 2.444 | 0,00 | 261 | -5,11 | ||||
| 2026-02-13 | 13F | Umb Bank N A/mo | 38 | 15,15 | 4 | 33,33 | ||||
| 2026-02-13 | 13F | Ubs Asset Management Americas Inc | 9.123 | 0,00 | 974 | -4,89 | ||||
| 2026-02-17 | 13F | Royal Bank Of Canada | 860 | -34,45 | 92 | -37,84 | ||||
| 2026-01-07 | 13F | Central Pacific Bank - Trust Division | 1.000 | 0,00 | 107 | -5,36 | ||||
| 2026-02-06 | 13F | Larson Financial Group LLC | 256 | 26,73 | 27 | 22,73 | ||||
| 2026-02-09 | 13F | Quest Partners LLC | 1.144 | 12,27 | 122 | 7,02 | ||||
| 2026-02-17 | 13F | J. Goldman & Co LP | 105.919 | -18,93 | 11.308 | -22,82 | ||||
| 2026-02-26 | 13F/A | Aristides Capital LLC | 3.028 | 323 | ||||||
| 2026-02-10 | 13F | Bank of New York Mellon Corp | 61.927 | -17,23 | 6.611 | -21,21 | ||||
| 2025-11-17 | 13F | PDT Partners, LLC | 0 | -100,00 | 0 | |||||
| 2026-02-17 | 13F | MIRAE ASSET GLOBAL ETFS HOLDINGS Ltd. | 53.738 | -0,68 | 5.737 | -5,44 | ||||
| 2026-02-11 | 13F | LPL Financial LLC | 4.728 | -1,29 | 505 | -6,15 | ||||
| 2026-02-13 | 13F | Solstein Capital, LLC | 290 | 0,00 | 31 | -6,25 | ||||
| 2026-02-03 | 13F | Western Standard LLC | 0 | -100,00 | 0 | |||||
| 2026-02-13 | 13F | Stifel Financial Corp | 3.004 | 0,00 | 321 | -4,76 | ||||
| 2026-01-29 | 13F | UBS Group AG | 15.451 | -5,90 | 1.650 | -10,43 | ||||
| 2026-02-13 | 13F | Mariner, LLC | 4.797 | -12,14 | 512 | -16,34 | ||||
| 2025-12-02 | 13F | IFP Advisors, Inc | 0 | 6 | 66,67 | |||||
| 2025-11-14 | 13F | Warren Averett Asset Management, LLC | 0 | -100,00 | 0 | |||||
| 2026-02-10 | 13F | Marietta Investment Partners Llc | 3.825 | -7,27 | 408 | -11,69 | ||||
| 2026-02-02 | 13F | Principal Financial Group Inc | 25.219 | -1,30 | 2.692 | -6,04 | ||||
| 2026-02-17 | 13F | Atom Investors LP | 14.611 | 66,20 | 1.560 | 58,27 | ||||
| 2026-02-11 | 13F | Ameritas Investment Partners, Inc. | 435 | 46 | ||||||
| 2026-02-13 | 13F | Y-Intercept (Hong Kong) Ltd | 6.506 | 695 | ||||||
| 2026-02-10 | 13F | State of Wyoming | 160 | -3,61 | 17 | -5,56 | ||||
| 2026-02-10 | 13F | Operose Advisors LLC | 366 | 0,00 | 39 | -4,88 | ||||
| 2026-02-13 | 13F | Great West Life Assurance Co /can/ | 5.034 | -8,69 | 1 | |||||
| 2026-02-10 | 13F | Goldman Sachs Group Inc | 42.154 | -58,57 | 4.500 | -60,57 | ||||
| 2026-02-13 | 13F | Medina Singh Partners, LLC | 212.246 | 1,61 | 22.659 | -3,27 | ||||
| 2026-03-03 | 13F/A | Caitong International Asset Management Co., Ltd | 351 | 37 | ||||||
| 2026-01-27 | 13F | Evergreen Capital Management Llc | 3.500 | 0,00 | 374 | -4,85 | ||||
| 2026-01-29 | 13F | Teachers Retirement System Of The State Of Kentucky | 1.319 | -9,60 | 0 | |||||
| 2026-02-13 | 13F | SRS Capital Advisors, Inc. | 0 | -100,00 | 0 | |||||
| 2026-01-26 | 13F | JNBA Financial Advisors | 150 | 0,00 | 16 | 0,00 | ||||
| 2025-10-24 | 13F | ORG Partners LLC | 0 | 0 | ||||||
| 2026-02-19 | 13F | Invesco Ltd. | 78.808 | 18,74 | 8.414 | 13,03 | ||||
| 2025-11-14 | 13F | Lazard Asset Management Llc | 0 | -100,00 | 0 | |||||
| 2026-01-23 | 13F | Farther Finance Advisors, LLC | 1 | 0,00 | 0 | |||||
| 2026-02-13 | 13F | Meixler Investment Management, Ltd. | 2.931 | -0,85 | 313 | -5,74 | ||||
| 2026-02-13 | 13F | Public Sector Pension Investment Board | 0 | -100,00 | 0 | |||||
| 2026-02-13 | 13F | Dynamic Technology Lab Private Ltd | 0 | -100,00 | 0 | |||||
| 2026-02-09 | 13F | Legal & General Group Plc | 13.119 | -1,38 | 1.401 | -6,10 | ||||
| 2026-01-16 | 13F | Louisiana State Employees Retirement System | 2.400 | 0,00 | 256 | -4,83 | ||||
| 2026-01-30 | 13F | North Star Investment Management Corp. | 5 | 0,00 | 1 | |||||
| 2026-02-17 | 13F | Algert Global Llc | 9.577 | -56,68 | 1 | -50,00 | ||||
| 2026-01-30 | 13F | Us Bancorp \de\ | 986 | 0,00 | 105 | -4,55 | ||||
| 2026-02-17 | 13F | Brevan Howard Capital Management LP | 5.243 | 560 | ||||||
| 2026-02-12 | 13F | BRYN MAWR TRUST Co | 1.000 | 0,00 | 107 | -5,36 | ||||
| 2026-02-17 | 13F | Ameriprise Financial Inc | 24.589 | 4,55 | 2.626 | -0,46 | ||||
| 2026-01-28 | 13F | Teacher Retirement System Of Texas | 3.944 | -10,75 | 421 | -14,95 | ||||
| 2026-02-17 | 13F | Hotchkis & Wiley Capital Management Llc | 30.530 | 0,00 | 3.259 | -4,79 | ||||
| 2026-02-17 | 13F | Two Sigma Advisers, Lp | 0 | -100,00 | 0 | |||||
| 2026-02-06 | 13F | Tortoise Investment Management, LLC | 0 | -100,00 | 0 | |||||
| 2026-01-28 | 13F | Salomon & Ludwin, LLC | 101 | 36,49 | 11 | 37,50 | ||||
| 2026-02-17 | 13F | Creative Planning | 2.279 | -14,99 | 243 | -19,00 | ||||
| 2026-02-17 | 13F | Jones Financial Companies Lllp | 70 | -39,66 | 8 | -46,15 | ||||
| 2026-02-12 | 13F | Jane Street Group, Llc | 0 | -100,00 | 0 | |||||
| 2025-11-14 | 13F | Raymond James Financial Inc | 0 | -100,00 | 0 | |||||
| 2026-02-09 | 13F | Annis Gardner Whiting Capital Advisors, LLC | 0 | -100,00 | 0 | |||||
| 2026-02-17 | 13F | Aquatic Capital Management LLC | 560 | -64,91 | 60 | -66,85 | ||||
| 2026-02-06 | 13F | Fortis Group Advisors, LLC | 2.529 | 0,00 | 322 | 19,26 | ||||
| 2026-02-17 | 13F | Advisor Group Holdings, Inc. | 272 | -32,67 | 29 | -34,09 | ||||
| 2026-02-09 | 13F | Huntington National Bank | 1 | 0,00 | 0 | |||||
| 2026-02-11 | 13F | Gilpin Wealth Management, Llc | 1 | 0 | ||||||
| 2026-02-17 | 13F | Bank Of America Corp /de/ | 8.655 | -61,52 | 924 | -63,36 | ||||
| 2026-01-21 | 13F | Flagship Harbor Advisors, Llc | 112 | 12 | ||||||
| 2026-02-13 | 13F | Barclays Plc | 8.768 | -21,07 | 936 | 12,23 | ||||
| 2026-02-17 | 13F | Fmr Llc | 753 | -3,09 | 80 | -8,05 | ||||
| 2026-02-05 | 13F | Thrivent Financial For Lutherans | 3.637 | -4,72 | 0 | |||||
| 2026-02-11 | 13F | Illinois Municipal Retirement Fund | 2.598 | 2,53 | 277 | -2,46 | ||||
| 2026-02-17 | 13F | Janus Henderson Group Plc | 2.329 | 0,00 | 248 | -5,00 | ||||
| 2025-11-07 | 13F | Gsa Capital Partners Llp | 0 | -100,00 | 0 | |||||
| 2026-01-30 | 13F | Caldwell Trust Co | 200 | 0,00 | 21 | -4,55 | ||||
| 2026-02-02 | 13F | Horizon Investments, LLC | 0 | -100,00 | 0 | |||||
| 2025-11-10 | 13F | MAI Capital Management | 0 | -100,00 | 0 | |||||
| 2026-02-10 | 13F | Intech Investment Management Llc | 1.874 | 0,00 | 200 | -4,76 | ||||
| 2026-02-13 | 13F | State Street Corp | 348.255 | 6,99 | 37.180 | 1,85 | ||||
| 2026-02-12 | 13F | Wealthspire Advisors, LLC | 0 | -100,00 | 0 | |||||
| 2026-02-17 | 13F | Jump Financial, LLC | 13.604 | -20,91 | 1.452 | -24,69 | ||||
| 2026-02-13 | 13F | Manufacturers Life Insurance Company, The | 0 | -100,00 | 0 | |||||
| 2025-11-14 | 13F | D. E. Shaw & Co., Inc. | 0 | -100,00 | 0 | |||||
| 2026-02-17 | 13F | Northern Trust Corp | 45.892 | -7,32 | 4.899 | -11,76 | ||||
| 2026-02-05 | 13F | Bessemer Group Inc | 18 | 500,00 | 0 | |||||
| 2025-11-14 | 13F | Susquehanna International Group, Llp | 0 | -100,00 | 0 | -100,00 | ||||
| 2026-02-11 | 13F | Brandes Investment Partners, Lp | 70.469 | 12,92 | 7.523 | 7,50 | ||||
| 2026-01-20 | 13F | Pullen Investment Management, LLC | 15.027 | 0,15 | 1.604 | -4,64 | ||||
| 2026-02-17 | 13F | Two Sigma Investments, Lp | 7.897 | -68,81 | 843 | -70,31 | ||||
| 2026-01-15 | 13F | Nisa Investment Advisors, Llc | 594 | 19,76 | 63 | 14,55 | ||||
| 2025-11-14 | 13F | Texas Permanent School Fund | 0 | -100,00 | 0 | -100,00 | ||||
| 2026-02-17 | 13F | SageView Advisory Group, LLC | 3.823 | -7,86 | 408 | -12,26 | ||||
| 2026-02-05 | 13F | Amalgamated Bank | 1.555 | 2,50 | 0 | |||||
| 2026-02-12 | 13F | Federation des caisses Desjardins du Quebec | 60 | 0,00 | 6 | 0,00 | ||||
| 2026-01-23 | 13F | Private Wealth Management Group, LLC | 5 | -44,44 | 1 | -100,00 | ||||
| 2026-01-13 | 13F/A | Sanctuary Advisors, LLC | 1.807 | 203 | ||||||
| 2026-01-23 | 13F | Assetmark, Inc | 9 | 12,50 | 1 | |||||
| 2026-02-13 | 13F | Guardian Wealth Management, Inc. | 25.770 | -5,47 | 2.751 | -10,01 | ||||
| 2026-02-17 | 13F | Qube Research & Technologies Ltd | 18.670 | 219,91 | 1.993 | 204,74 | ||||
| 2026-02-17 | 13F | State Of Wisconsin Investment Board | 6.233 | 24,24 | 665 | 18,33 | ||||
| 2025-10-14 | 13F | Exchange Traded Concepts, Llc | 0 | -100,00 | 0 | |||||
| 2026-02-11 | 13F | Syon Capital Llc | 3.393 | 362 | ||||||
| 2026-01-21 | 13F | Sound Income Strategies, LLC | 17 | 2 | ||||||
| 2026-02-17 | 13F | Corsair Capital Management, L.p. | 8.022 | 0,01 | 856 | -4,78 | ||||
| 2026-02-13 | 13F | Diametric Capital, LP | 3.490 | 10,23 | 373 | 4,79 | ||||
| 2026-01-30 | 13F | Pekin Hardy Strauss, Inc. | 2.485 | -90,84 | 265 | -91,28 | ||||
| 2026-01-08 | 13F | Versant Capital Management, Inc | 15 | 0,00 | 2 | 0,00 | ||||
| 2026-02-03 | 13F | SBI Securities Co., Ltd. | 25 | -7,41 | 3 | -33,33 | ||||
| 2026-01-30 | 13F | Catalytic Wealth RIA, LLC | 3.483 | 39,32 | 372 | 32,50 | ||||
| 2025-11-14 | 13F | Gotham Asset Management, LLC | 0 | -100,00 | 0 | |||||
| 2026-02-13 | 13F | Walleye Capital LLC | 0 | -100,00 | 0 | |||||
| 2026-02-13 | 13F | Steel Partners Holdings L.p. | 56.469 | 349,49 | 6.029 | 539,24 | ||||
| 2026-02-24 | 13F | Amanah Holdings Trust | 0 | -100,00 | 0 | |||||
| 2026-02-09 | 13F | Hantz Financial Services, Inc. | 54 | 2.600,00 | 0 | |||||
| 2026-02-13 | 13F | National Bank Of Canada /fi/ | 1.004 | 0,10 | 106 | -4,50 | ||||
| 2026-02-17 | 13F | Quadrature Capital Ltd | 0 | -100,00 | 0 | |||||
| 2026-02-17 | 13F | Citadel Advisors Llc | 27.025 | 41,86 | 2.885 | 35,07 | ||||
| 2026-01-29 | 13F | Vanguard Group Inc | 370.551 | -0,88 | 39.560 | -5,64 | ||||
| 2026-02-10 | 13F | Godfrey Financial Associates, Inc. | 87 | 9 | ||||||
| 2026-02-13 | 13F | Ambassador Advisors, LLC | 0 | -100,00 | 0 | |||||
| 2026-01-15 | 13F | Uncommon Cents Investing LLC | 19.010 | -0,45 | 2.030 | -5,23 | ||||
| 2026-02-11 | 13F | Parallel Advisors, LLC | 617 | 0,00 | 66 | -5,80 | ||||
| 2026-02-12 | 13F | MetLife Investment Management, LLC | 2.936 | 0,00 | 313 | -4,86 | ||||
| 2026-02-03 | 13F | Farmers & Merchants Investments Inc | 3 | 0,00 | 0 | |||||
| 2025-11-12 | 13F | NewSquare Capital LLC | 0 | -100,00 | 0 | |||||
| 2025-11-13 | 13F | Norges Bank | 0 | -100,00 | 0 | |||||
| 2026-02-17 | 13F | Massar Capital Management, LP | 0 | -100,00 | 0 | |||||
| 2026-02-13 | 13F | Rhumbline Advisers | 13.003 | -8,15 | 1.388 | -12,54 | ||||
| 2026-02-13 | 13F | Caxton Associates Llp | 1.957 | 209 | ||||||
| 2026-02-12 | 13F | Ankerstar Wealth, LLC | 1 | 0 |