Grundlæggende statistik
| Institutionelle ejere | 115 total, 115 long only, 0 short only, 0 long/short - change of 0,00% MRQ |
| Gennemsnitlig porteføljeallokering | 0.0836 % - change of -28,22% MRQ |
| Institutionelle aktier (lange) | 2.013.833 (ex 13D/G) - change of -0,20MM shares -9,06% MRQ |
| Institutionel værdi (lang) | $ 134.270 USD ($1000) |
Institutionelt ejerskab og aktionærer
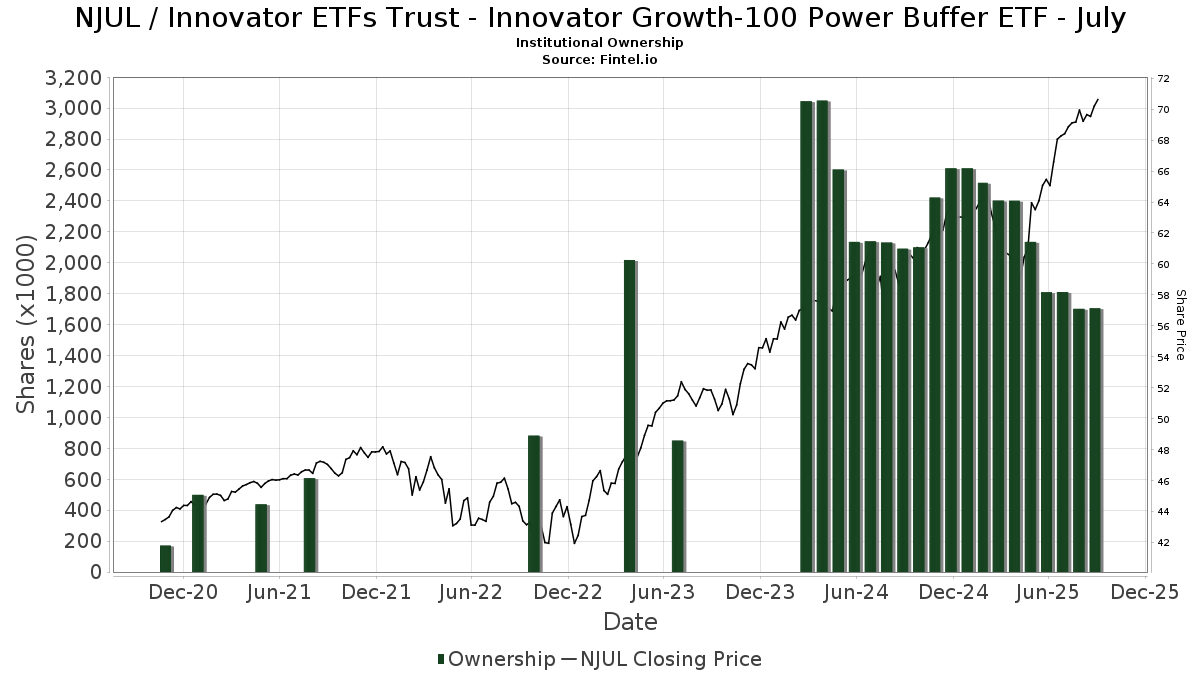
Innovator ETFs Trust - Innovator Growth-100 Power Buffer ETF - July (US:NJUL) har 115 institutionelle ejere og aktionærer, der har indsendt 13D/G- eller 13F-formularer til Securities Exchange Commission (SEC). Disse institutioner har i alt 2,013,833 aktier. Største aktionærer omfatter Advisor Group Holdings, Inc., Commonwealth Equity Services, Llc, HighTower Advisors, LLC, Kestra Advisory Services, LLC, Janney Montgomery Scott LLC, Truist Financial Corp, Principal Securities, Inc., Cetera Investment Advisers, Raymond James Financial Inc, and Cambridge Investment Research Advisors, Inc. .
Innovator ETFs Trust - Innovator Growth-100 Power Buffer ETF - July (BATS:NJUL) institutionel ejerskabsstruktur viser aktuelle positioner i virksomheden efter institutioner og fonde, samt seneste ændringer i positionsstørrelse. Større aktionærer kan omfatte individuelle investorer, investeringsforeninger, hedgefonde eller institutioner. Skema 13D angiver, at investoren besidder (eller besidder) mere end 5 % af virksomheden og har til hensigt (eller har til hensigt at) aktivt at forfølge en ændring i forretningsstrategi. Skema 13G indikerer en passiv investering på over 5%.
The share price as of April 30, 2026 is 75,94 / share. Previously, on April 30, 2025, the share price was 60,43 / share. This represents an increase of 25,67% over that period.
Fondens stemningsscore
Fund Sentiment Score (fka Ownership Accumulation Score) finder de aktier, der bliver mest købt af fonde. Det er resultatet af en sofistikeret, multi-faktor kvantitativ model, der identificerer virksomheder med de højeste niveauer af institutionel akkumulering. Scoringsmodellen bruger en kombination af den samlede stigning i oplyste ejere, ændringerne i porteføljeallokeringer i disse ejere og andre målinger. Tallet går fra 0 til 100, hvor højere tal indikerer et højere niveau af akkumulering for sine jævnaldrende, og 50 er gennemsnittet.
Opdateringsfrekvens: Dagligt
Se Ownership Explorer, som giver en liste over højest rangerende virksomheder.
AI+ Ask Fintel’s AI assistant about Innovator ETFs Trust - Innovator Growth-100 Power Buffer ETF - July.
Select a question to share a public post with an AI-crafted answer.
Thinking of good questions…
Institutionel Put/Call-forhold
Ud over at indberette standardaktie- og gældsudstedelser skal institutter med mere end 100 mill. aktiver under forvaltning også oplyse deres put- og call-optionsbeholdninger. Da salgsoptioner generelt indikerer negativ stemning, og købsoptioner indikerer positiv stemning, kan vi få en fornemmelse af den overordnede institutionelle stemning ved at plotte forholdet mellem put og kald. Diagrammet til højre viser det historiske put/call-forhold for dette instrument.
Brug af Put/Call Ratio som en indikator for investorernes stemning overvinder en af de vigtigste mangler ved at bruge totalt institutionelt ejerskab, som er, at en betydelig mængde af aktiver under forvaltning investeres passivt for at spore indekser. Passivt forvaltede fonde køber typisk ikke optioner, så indikatoren for put/call-forholdet følger mere nøje følelsen af aktivt forvaltede fonde.
13F og NPORT arkivering
Detaljer om 13F-arkivering er gratis. Detaljer om NP-ansøgninger kræver et premium-medlemskab. Grønne rækker angiver nye positioner. Røde rækker angiver lukkede positioner. Klik på linket ikon for at se den fulde transaktionshistorik.
Opgrader
for at låse premium-data op og eksportere til Excel ![]() .
.
| Fil dato | Kilde | Investor | Type | Gennemsnitlig pris (Øst) |
Aktier | Δ Aktier (%) |
Rapporteret Værdi ($1000) |
Δ Værdi (%) |
Port Alloc (%) |
|
|---|---|---|---|---|---|---|---|---|---|---|
| 2026-01-30 | 13F | Us Bancorp \de\ | 325 | 0,00 | 24 | 0,00 | ||||
| 2026-02-13 | 13F | Visionary Wealth Advisors | 7.245 | -12,12 | 526 | -10,24 | ||||
| 2026-04-17 | 13F | AdvisorNet Financial, Inc | 7.408 | -12,18 | 529 | -13,56 | ||||
| 2026-04-24 | 13F | Michels Family Financial, LLC | 6.811 | 0,00 | 486 | -1,62 | ||||
| 2026-04-27 | 13F | Beacon Financial Advisory LLC | 0 | -100,00 | 0 | |||||
| 2026-04-22 | 13F | Clear Creek Financial Management, LLC | 3.372 | 241 | ||||||
| 2026-04-27 | 13F | Pensionmark Financial Group, Llc | 5.183 | 0,00 | 370 | -1,60 | ||||
| 2026-04-29 | 13F | Clear Point Advisors Inc. | 0 | -100,00 | 0 | |||||
| 2026-04-21 | 13F | Welch Financial Planning, LLC | 0 | -100,00 | 0 | |||||
| 2026-04-27 | 13F | Truist Financial Corp | 80.854 | -1,05 | 5.774 | -2,70 | ||||
| 2026-02-17 | 13F | Cresset Asset Management, LLC | 25.746 | 0,00 | 1.870 | 2,13 | ||||
| 2026-04-30 | 13F | Kestra Advisory Services, LLC | 90.587 | 211,72 | 6.469 | 206,59 | ||||
| 2026-01-29 | 13F | UBS Group AG | 73 | 170,37 | 5 | 400,00 | ||||
| 2026-02-10 | 13F | David R. Rahn & Associates Inc. | 4.294 | 0,00 | 312 | 1,97 | ||||
| 2026-02-13 | 13F | Motiv8 Investments LLC | 7 | 0 | ||||||
| 2026-04-28 | 13F | Altfest L J & Co Inc | 17.625 | -8,58 | 1.259 | -10,14 | ||||
| 2026-02-13 | 13F | Morgan Stanley | 212 | 66,93 | 15 | 66,67 | ||||
| 2026-04-17 | 13F | BCS Wealth Management | 7.076 | -50,00 | 505 | -50,83 | ||||
| 2026-04-13 | 13F | Creative Financial Designs Inc /adv | 21.130 | 0,00 | 1.509 | -1,69 | ||||
| 2026-02-06 | 13F | Frisch Financial Group, Inc. | 3.391 | 0,00 | 246 | 2,07 | ||||
| 2026-02-17 | 13F | Blair William & Co/il | 7.628 | 0,00 | 554 | 2,03 | ||||
| 2026-02-13 | 13F | Gts Securities Llc | 0 | -100,00 | 0 | |||||
| 2026-04-09 | 13F | Nelson, Van Denburg & Campbell Wealth Management Group, LLC | 7.944 | 0,00 | 567 | -1,56 | ||||
| 2026-04-17 | 13F | Outlook Wealth Advisors, LLC | 44.042 | 3,80 | 3.145 | 2,08 | ||||
| 2026-04-24 | 13F | Private Advisor Group, LLC | 3.834 | 274 | ||||||
| 2026-04-21 | 13F | Wedbush Securities Inc | 4.372 | 2,34 | 0 | |||||
| 2025-11-14 | 13F | Wolverine Trading, Llc | 0 | -100,00 | 0 | |||||
| 2026-02-06 | 13F | HighTower Advisors, LLC | 96.669 | 0,00 | 7.020 | 2,14 | ||||
| 2026-01-26 | 13F | AE Wealth Management LLC | 5.724 | -57,24 | 416 | -56,36 | ||||
| 2026-01-21 | 13F | New Wave Wealth Advisors Llc | 3.595 | 0,00 | 261 | 2,35 | ||||
| 2026-04-27 | 13F | BIP Wealth, LLC | 46.502 | -3,46 | 3.321 | -5,06 | ||||
| 2026-04-22 | 13F | Onyx Bridge Wealth Group LLC | 4.339 | 0,00 | 310 | -1,90 | ||||
| 2026-04-22 | 13F | Janney Montgomery Scott LLC | 83.663 | 4,48 | 6 | 0,00 | ||||
| 2026-01-23 | 13F | U.S. Capital Wealth Advisors, LLC | 0 | -100,00 | 0 | |||||
| 2026-02-11 | 13F | Tradition Wealth Management, LLC | 9.365 | -8,63 | 680 | -6,59 | ||||
| 2026-02-12 | 13F | Principal Securities, Inc. | 75.639 | -0,74 | 5.493 | 1,37 | ||||
| 2026-01-26 | 13F | Keystone Wealth Services, LLC | 9.810 | 60,82 | 658 | 51,73 | ||||
| 2025-11-14 | 13F | Wood Tarver Financial Group, LLC | 0 | -100,00 | 0 | |||||
| 2026-04-27 | 13F | Liberty Atlantic Advisors LLC | 3.663 | -0,68 | 262 | -2,25 | ||||
| 2026-02-05 | 13F | Phoenix Holdings Ltd. | 12.645 | 0,00 | 916 | 2,12 | ||||
| 2026-02-10 | 13F | Envestnet Asset Management Inc | 18.779 | -2,17 | 1.364 | -0,07 | ||||
| 2026-02-17 | 13F | Raymond James Financial Inc | 55.504 | -40,86 | 4.031 | -39,61 | ||||
| 2026-04-28 | 13F | Stratos Wealth Advisors, LLC | 4.940 | -11,72 | 353 | -13,30 | ||||
| 2026-04-17 | 13F | Summit Wealth Partners, LLC | 5.240 | -36,41 | 374 | -37,46 | ||||
| 2026-01-21 | 13F | Leading Edge Financial Planning LLC | 3.034 | -5,89 | 220 | -3,93 | ||||
| 2026-04-30 | 13F | Sequoia Financial Advisors, LLC | 22.613 | 0,95 | 1.615 | -0,74 | ||||
| 2026-02-18 | 13F | GWM Advisors LLC | 17.684 | -4,87 | 1.284 | -2,80 | ||||
| 2026-04-17 | 13F | RFG Advisory, LLC | 0 | -100,00 | 0 | |||||
| 2026-04-15 | 13F | Diligent Investors, LLC | 27.335 | -0,35 | 1.952 | -1,96 | ||||
| 2026-02-20 | 13F | Sunbelt Securities, Inc. | 4.215 | -4,92 | 306 | -2,86 | ||||
| 2026-02-17 | 13F | Warren Averett Asset Management, LLC | 3.981 | 289 | ||||||
| 2026-02-27 | 13F | Compass Financial Services Inc | 401 | 0,00 | 29 | 3,57 | ||||
| 2026-02-13 | 13F | Luminist Capital LLC | 0 | -100,00 | 0 | |||||
| 2026-04-02 | 13F | Noble Wealth Management PBC | 475 | -46,02 | 34 | -47,62 | ||||
| 2026-04-17 | 13F | Weaver Capital Management LLC | 14.811 | 0,00 | 1.058 | -1,67 | ||||
| 2026-01-16 | 13F | PFS Partners, LLC | 0 | -100,00 | 0 | |||||
| 2026-02-17 | 13F | Advisor Group Holdings, Inc. | 281.863 | -5,08 | 20.469 | -2,03 | ||||
| 2026-01-06 | 13F | Arlington Capital Management, Inc. | 10.524 | -32,12 | 764 | -30,67 | ||||
| 2026-02-13 | 13F | Centaurus Financial, Inc. | 1.469 | 0,00 | 0 | |||||
| 2026-04-09 | 13F | DHJJ Financial Advisors, Ltd. | 15.072 | -0,20 | 1.076 | -1,82 | ||||
| 2026-04-23 | 13F | Accurate Wealth Management, LLC | 2.784 | -0,11 | 205 | 0,49 | ||||
| 2026-04-08 | 13F | Wealth Enhancement Advisory Services, Llc | 26.630 | -13,07 | 1.915 | -14,52 | ||||
| 2026-02-05 | 13F | Allworth Financial LP | 2.608 | 0,00 | 189 | 2,16 | ||||
| 2026-02-13 | 13F | Financial Network Wealth Advisors LLC | 458 | 0,00 | 33 | 3,13 | ||||
| 2025-11-06 | 13F | Ameritas Advisory Services, LLC | 0 | -100,00 | 0 | -100,00 | ||||
| 2026-01-21 | 13F | Capital Investment Advisory Services, LLC | 0 | -100,00 | 0 | |||||
| 2026-02-17 | 13F | Snowden Capital Advisors LLC | 7.902 | 0,00 | 574 | 2,14 | ||||
| 2026-02-13 | 13F | Mml Investors Services, Llc | 15.929 | 13,47 | 1.157 | 15,83 | ||||
| 2026-04-27 | 13F | Soltis Investment Advisors LLC | 3.676 | -7,41 | 263 | -9,03 | ||||
| 2026-04-29 | 13F | Strategic Blueprint, LLC | 21.409 | -0,70 | 1.529 | -2,36 | ||||
| 2026-04-09 | 13F | CRA Financial Services, LLC | 8.672 | 0,00 | 619 | -1,59 | ||||
| 2026-04-13 | 13F | Gill Capital Partners, Llc | 1.354 | 97 | ||||||
| 2026-01-23 | 13F | Assetmark, Inc | 120 | 0,00 | 9 | 0,00 | ||||
| 2026-02-09 | 13F | Keating Financial Advisory Services, Inc. | 5.444 | 395 | ||||||
| 2026-04-07 | 13F | CoreCap Advisors, LLC | 6.765 | 8,48 | 483 | 6,86 | ||||
| 2026-02-06 | 13F | EverSource Wealth Advisors, LLC | 2.280 | -3,76 | 166 | -1,79 | ||||
| 2026-02-17 | 13F | Ameriflex Group, Inc. | 267 | -50,00 | 19 | -48,65 | ||||
| 2026-04-14 | 13F | Focus Financial Network, Inc. | 10.531 | -0,16 | 752 | -1,70 | ||||
| 2026-02-13 | 13F | Change Path, LLC | 7.166 | -2,98 | 520 | -0,95 | ||||
| 2026-01-27 | 13F | PFG Advisors | 21.530 | -3,79 | 1.564 | -1,76 | ||||
| 2026-02-11 | 13F | Jpmorgan Chase & Co | 9.334 | -18,37 | 678 | -16,73 | ||||
| 2026-02-12 | 13F | Helium Advisors LLC | 5.905 | 0,00 | 429 | 2,15 | ||||
| 2026-04-15 | 13F | Cypress Wealth Services, LLC | 16.688 | 0,00 | 1.192 | -1,65 | ||||
| 2026-02-13 | 13F | Arete Wealth Advisors, LLC | 3.078 | 0,00 | 0 | |||||
| 2026-02-13 | 13F | Arkadios Wealth Advisors | 3.454 | -14,72 | 251 | -12,89 | ||||
| 2026-04-17 | 13F | Certified Advisory Corp | 11.987 | -4,68 | 856 | -6,24 | ||||
| 2026-04-17 | 13F/A | Founders Financial Securities Llc | 4.682 | -0,06 | 345 | 1,47 | ||||
| 2026-02-17 | 13F | Susquehanna International Group, Llp | 3.861 | -61,83 | 280 | -61,06 | ||||
| 2026-02-13 | 13F | MAI Capital Management | 40.311 | -46,26 | 2.927 | -45,13 | ||||
| 2026-02-11 | 13F | Gwn Securities Inc. | 12.309 | 4,36 | 894 | 5,93 | ||||
| 2026-04-27 | 13F | Evolution Wealth Management Inc. | 2.327 | 0,00 | 166 | -1,19 | ||||
| 2026-04-24 | 13F | Keybank National Association/oh | 3.700 | 264 | ||||||
| 2026-02-02 | 13F | FSA Advisors, Inc. | 10.956 | 0,00 | 796 | 2,05 | ||||
| 2026-02-13 | 13F | Wells Fargo & Company/mn | 0 | -100,00 | 0 | |||||
| 2026-02-03 | 13F | Emerald Investment Partners, Llc | 1.336 | 0,00 | 97 | 3,19 | ||||
| 2026-02-11 | 13F | LPL Financial LLC | 54.477 | -1,21 | 3.956 | 0,89 | ||||
| 2026-04-16 | 13F | Brookstone Capital Management | 3.829 | -7,60 | 273 | -9,00 | ||||
| 2026-02-04 | 13F | BCJ Capital Management, LLC | 10.045 | -1,51 | 729 | 0,55 | ||||
| 2026-01-23 | 13F | Optima Capital Llc | 453 | 33 | ||||||
| 2026-02-12 | 13F | Triumph Capital Management | 4.547 | 12,11 | 330 | 14,58 | ||||
| 2026-02-13 | 13F | Jacobi Capital Management LLC | 10.498 | 0,00 | 762 | 2,14 | ||||
| 2026-02-02 | 13F | Vantage Point Financial LLC | 2.988 | -1,32 | 217 | 0,47 | ||||
| 2026-02-12 | 13F | Commonwealth Equity Services, Llc | 135.679 | -2,13 | 9.853 | 109.377,78 | ||||
| 2026-04-30 | 13F | Corrado Advisors, Llc | 27.898 | -2,29 | 1.992 | -3,91 | ||||
| 2026-02-10 | 13F | Goldman Sachs Group Inc | 0 | -100,00 | 0 | |||||
| 2026-02-05 | 13F | Dana Investment Advisors, Inc. | 10.283 | 0,61 | 747 | 2,75 | ||||
| 2026-04-21 | 13F | Long Island Wealth Management, Inc. | 6.073 | -9,33 | 434 | -10,91 | ||||
| 2026-01-08 | 13F | Gradient Investments LLC | 0 | -100,00 | 0 | |||||
| 2026-04-08 | 13F | NorthCrest Asset Manangement, LLC | 0 | -100,00 | 0 | |||||
| 2026-02-06 | 13F | Seros Financial, LLC | 5.109 | 0,00 | 371 | 2,20 | ||||
| 2026-02-11 | 13F | Capital Analysts, Inc. | 4.614 | -9,56 | 0 | |||||
| 2026-02-06 | 13F | Rps Advisory Solutions Llc | 5.767 | -5,84 | 419 | -3,91 | ||||
| 2026-01-26 | 13F | Cwm, Llc | 634 | -41,99 | 0 | |||||
| 2026-04-30 | 13F | Cambridge Investment Research Advisors, Inc. | 55.397 | -14,38 | 4 | -25,00 | ||||
| 2026-02-17 | 13F | Old Mission Capital Llc | 45.793 | 416,68 | 3.325 | 427,78 | ||||
| 2026-02-17 | 13F | SageView Advisory Group, LLC | 4.355 | 0,00 | 316 | 2,27 | ||||
| 2026-02-17 | 13F | Cetera Investment Advisers | 74.088 | -3,94 | 5.380 | -1,90 | ||||
| 2026-04-14 | 13F | Nbc Securities, Inc. | 325 | 0,00 | 23 | 0,00 | ||||
| 2026-02-17 | 13F | Opus Financial Solutions LLC | 3.562 | 259 | ||||||
| 2026-01-29 | 13F | ODonnell Financial Services, LLC | 22.733 | 0,00 | 1.651 | 2,10 | ||||
| 2026-02-12 | 13F | Steward Partners Investment Advisory, Llc | 11.765 | -0,25 | 854 | 1,91 | ||||
| 2026-04-13 | 13F | IFP Advisors, Inc | 9.456 | 7,11 | 675 | 5,30 | ||||
| 2026-04-23 | 13F | Global Trust Asset Management, LLC | 2.500 | 0,00 | 179 | -1,66 | ||||
| 2026-04-08 | 13F | First Heartland Consultants, Inc. | 3.531 | -4,07 | 252 | -5,62 | ||||
| 2026-04-15 | 13F | Merit Financial Group, LLC | 13.413 | 1,68 | 958 | -0,10 | ||||
| 2026-02-13 | 13F | Aptus Capital Advisors, LLC | 16 | 0,00 | 1 | 0,00 | ||||
| 2026-04-21 | 13F | Gilpin Wealth Management, Llc | 100 | 0,00 | 7 | 0,00 | ||||
| 2026-02-13 | 13F | Colony Group, LLC | 5.640 | 0,00 | 410 | 2,00 | ||||
| 2026-04-20 | 13F | Kfg Wealth Management, Llc | 5.769 | -0,55 | 412 | -2,38 | ||||
| 2026-04-22 | 13F | Patriot Financial Group Insurance Agency, LLC | 4.800 | 343 | ||||||
| 2026-04-23 | 13F | Element Squared LLC | 0 | -100,00 | 0 | |||||
| 2025-11-14 | 13F | Brass Tax Wealth Management, Inc | 3.530 | 251 |