Grundlæggende statistik
| Institutionelle ejere | 95 total, 95 long only, 0 short only, 0 long/short - change of -4,95% MRQ |
| Gennemsnitlig porteføljeallokering | 0.1566 % - change of -7,10% MRQ |
| Institutionelle aktier (lange) | 8.817.026 (ex 13D/G) - change of -0,50MM shares -5,41% MRQ |
| Institutionel værdi (lang) | $ 485.499 USD ($1000) |
Institutionelt ejerskab og aktionærer
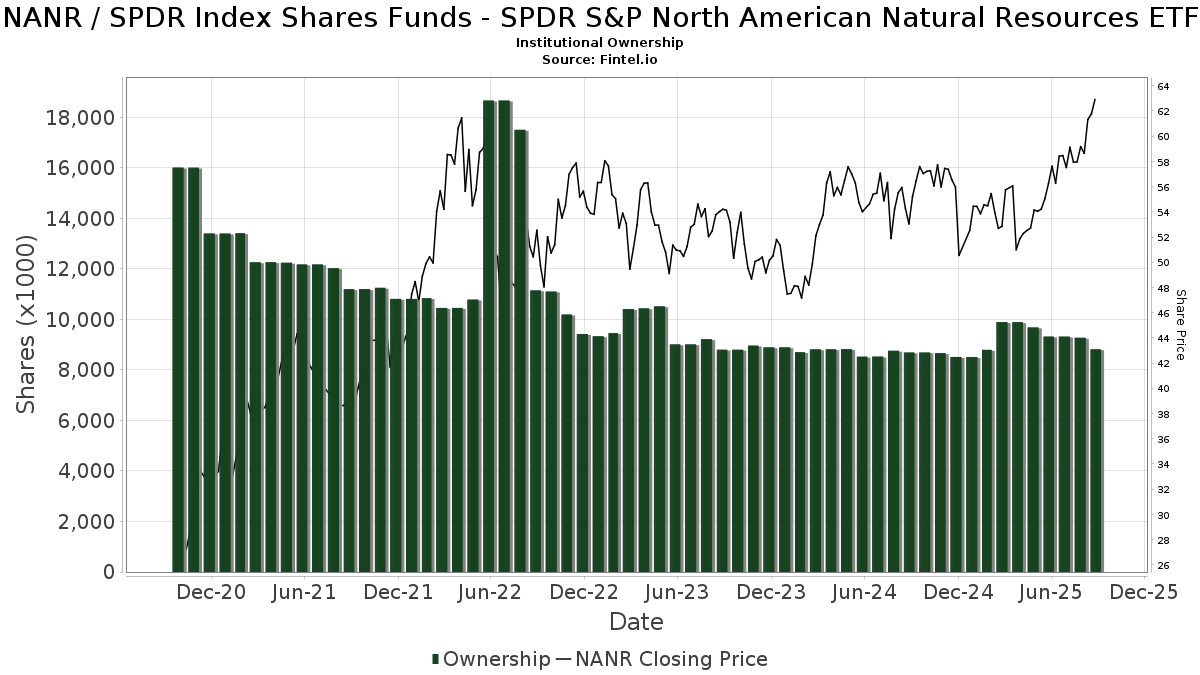
SPDR Index Shares Funds - SPDR S&P North American Natural Resources ETF (US:NANR) har 95 institutionelle ejere og aktionærer, der har indsendt 13D/G- eller 13F-formularer til Securities Exchange Commission (SEC). Disse institutioner har i alt 8,817,026 aktier. Største aktionærer omfatter Financial Engines Advisors L.L.C., Capital Wealth Management, Llc, Franklin Resources Inc, LPL Financial LLC, Morgan Stanley, Baird Financial Group, Inc., XML Financial, LLC, Steward Partners Investment Advisory, Llc, Schmidt P J Investment Management Inc, and Mariner, LLC .
SPDR Index Shares Funds - SPDR S&P North American Natural Resources ETF (ARCA:NANR) institutionel ejerskabsstruktur viser aktuelle positioner i virksomheden efter institutioner og fonde, samt seneste ændringer i positionsstørrelse. Større aktionærer kan omfatte individuelle investorer, investeringsforeninger, hedgefonde eller institutioner. Skema 13D angiver, at investoren besidder (eller besidder) mere end 5 % af virksomheden og har til hensigt (eller har til hensigt at) aktivt at forfølge en ændring i forretningsstrategi. Skema 13G indikerer en passiv investering på over 5%.
The share price as of September 12, 2025 is 63,05 / share. Previously, on September 16, 2024, the share price was 54,78 / share. This represents an increase of 15,09% over that period.
Fondens stemningsscore
Fund Sentiment Score (fka Ownership Accumulation Score) finder de aktier, der bliver mest købt af fonde. Det er resultatet af en sofistikeret, multi-faktor kvantitativ model, der identificerer virksomheder med de højeste niveauer af institutionel akkumulering. Scoringsmodellen bruger en kombination af den samlede stigning i oplyste ejere, ændringerne i porteføljeallokeringer i disse ejere og andre målinger. Tallet går fra 0 til 100, hvor højere tal indikerer et højere niveau af akkumulering for sine jævnaldrende, og 50 er gennemsnittet.
Opdateringsfrekvens: Dagligt
Se Ownership Explorer, som giver en liste over højest rangerende virksomheder.
Institutionel Put/Call-forhold
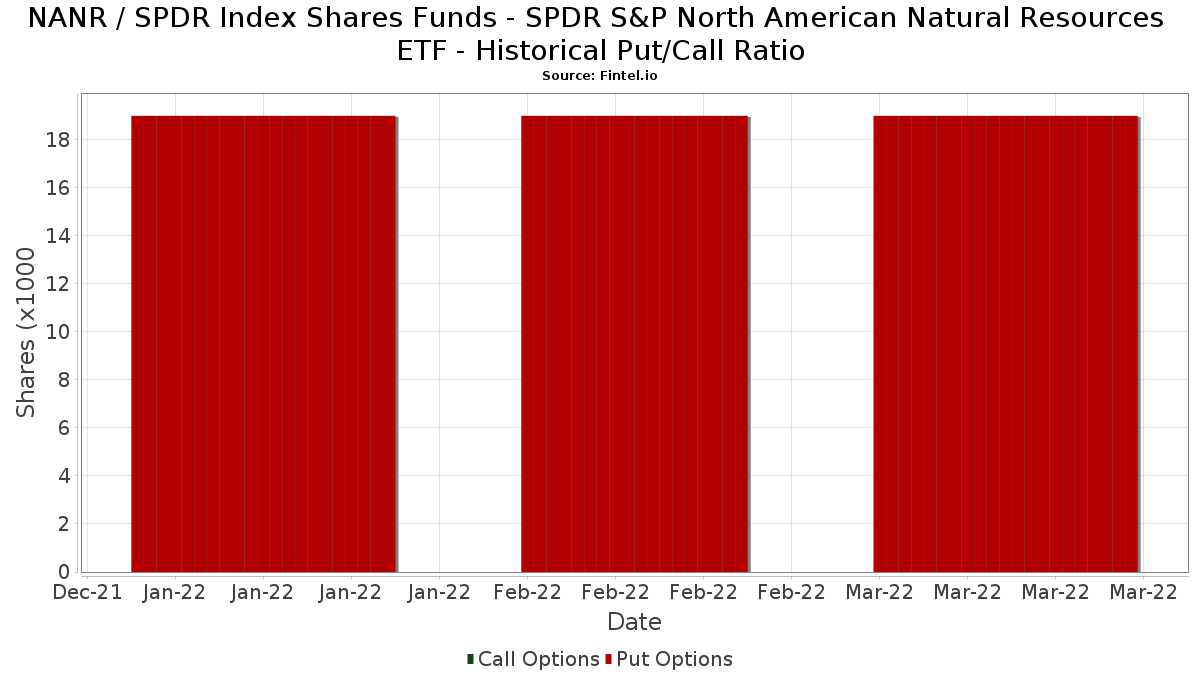
Ud over at indberette standardaktie- og gældsudstedelser skal institutter med mere end 100 mill. aktiver under forvaltning også oplyse deres put- og call-optionsbeholdninger. Da salgsoptioner generelt indikerer negativ stemning, og købsoptioner indikerer positiv stemning, kan vi få en fornemmelse af den overordnede institutionelle stemning ved at plotte forholdet mellem put og kald. Diagrammet til højre viser det historiske put/call-forhold for dette instrument.
Brug af Put/Call Ratio som en indikator for investorernes stemning overvinder en af de vigtigste mangler ved at bruge totalt institutionelt ejerskab, som er, at en betydelig mængde af aktiver under forvaltning investeres passivt for at spore indekser. Passivt forvaltede fonde køber typisk ikke optioner, så indikatoren for put/call-forholdet følger mere nøje følelsen af aktivt forvaltede fonde.
13F og NPORT arkivering
Detaljer om 13F-arkivering er gratis. Detaljer om NP-ansøgninger kræver et premium-medlemskab. Grønne rækker angiver nye positioner. Røde rækker angiver lukkede positioner. Klik på linket ikon for at se den fulde transaktionshistorik.
Opgrader
for at låse premium-data op og eksportere til Excel ![]() .
.
| Fil dato | Kilde | Investor | Type | Gennemsnitlig pris (Øst) |
Aktier | Δ Aktier (%) |
Rapporteret Værdi ($1000) |
Δ Værdi (%) |
Port Alloc (%) |
|
|---|---|---|---|---|---|---|---|---|---|---|
| 2025-07-25 | 13F | Envestnet Portfolio Solutions, Inc. | 0 | -100,00 | 0 | |||||
| 2025-07-24 | 13F | IFP Advisors, Inc | 667 | 0,60 | 38 | 2,78 | ||||
| 2025-08-14 | 13F | Wells Fargo & Company/mn | 0 | -100,00 | 0 | -100,00 | ||||
| 2025-07-21 | 13F | Ameritas Advisory Services, LLC | 373 | 21 | ||||||
| 2025-07-21 | 13F | Crews Bank & Trust | 83 | 0,00 | 5 | 0,00 | ||||
| 2025-08-11 | 13F | Principal Securities, Inc. | 0 | -100,00 | 0 | |||||
| 2025-08-14 | 13F | Talon Private Wealth, LLC | 618 | 35 | ||||||
| 2025-08-06 | 13F | Founders Financial Securities Llc | 6.705 | 10,99 | 380 | 17,70 | ||||
| 2025-07-14 | 13F | Painted Porch Advisors LLC | 167 | 9 | ||||||
| 2025-08-14 | 13F | Stifel Financial Corp | 35.986 | 3,32 | 2.038 | 5,43 | ||||
| 2025-08-13 | 13F | Northwestern Mutual Wealth Management Co | 60.390 | 22,11 | 3.420 | 24,59 | ||||
| 2025-07-17 | 13F | Tempus Wealth Planning, LLC | 7.497 | -8,02 | 425 | -6,19 | ||||
| 2025-08-08 | 13F | Gts Securities Llc | 0 | -100,00 | 0 | |||||
| 2025-05-12 | 13F | Sandy Spring Bank | 3.581 | -3,74 | 199 | 4,21 | ||||
| 2025-08-08 | 13F | MTM Investment Management, LLC | 13 | 1 | ||||||
| 2025-08-14 | 13F | Glen Eagle Advisors, LLC | 1 | 0,00 | 0 | |||||
| 2025-08-14 | 13F | Raymond James Financial Inc | 33.940 | -1,55 | 1.922 | 0,47 | ||||
| 2025-08-13 | 13F | Financial Freedom, LLC | 18.213 | -5,70 | 1.032 | -3,82 | ||||
| 2025-08-14 | 13F | Horizon Investments, LLC | 4.887 | 16,14 | 277 | 18,45 | ||||
| 2025-08-11 | 13F | CFS Investment Advisory Services, LLC | 98.968 | -0,14 | 6 | 0,00 | ||||
| 2025-07-09 | 13F | Fiduciary Alliance LLC | 47.213 | 0,05 | 2.674 | 2,10 | ||||
| 2025-08-14 | 13F | CoreCap Advisors, LLC | 277 | 0,00 | 16 | 0,00 | ||||
| 2025-07-09 | 13F | Aaron Wealth Advisors LLC | 19.116 | 0,00 | 1.083 | 1,98 | ||||
| 2025-07-09 | 13F | Capital Wealth Management, Llc | 332.468 | 2,33 | 18.831 | 4,40 | ||||
| 2025-08-14 | 13F | Fmr Llc | 4.199 | 1,40 | 238 | 3,49 | ||||
| 2025-08-01 | 13F | Schmidt P J Investment Management Inc | 114.694 | -6,03 | 6.496 | -4,12 | ||||
| 2025-08-12 | 13F | Steward Partners Investment Advisory, Llc | 120.632 | 58,46 | 6.833 | 61,70 | ||||
| 2025-08-14 | 13F | Mml Investors Services, Llc | 4.824 | 0 | ||||||
| 2025-07-30 | 13F | Crewe Advisors LLC | 134 | 8 | ||||||
| 2025-07-29 | 13F | Fundamentun, Llc | 53.507 | -12,83 | 3.031 | -11,07 | ||||
| 2025-05-12 | 13F | Richard W. Paul & Associates, LLC | 0 | -100,00 | 0 | -100,00 | ||||
| 2025-05-12 | 13F | Aveo Capital Partners, LLC | 0 | -100,00 | 0 | |||||
| 2025-08-14 | 13F | UBS Group AG | 10.628 | 16,93 | 602 | 19,25 | ||||
| 2025-04-28 | 13F | Strategic Financial Concepts, LLC | 0 | -100,00 | 0 | -100,00 | ||||
| 2025-08-07 | 13F | Brio Consultants, LLC | 40.847 | -19,05 | 2.314 | -17,42 | ||||
| 2025-08-04 | 13F | Assetmark, Inc | 2.321 | -99,60 | 131 | -99,59 | ||||
| 2025-08-14 | 13F/A | Perritt Capital Management Inc | 74.447 | -0,71 | 4.217 | 1,30 | ||||
| 2025-07-17 | 13F | Wolff Wiese Magana Llc | 608 | 0,00 | 34 | 3,03 | ||||
| 2025-08-12 | 13F | O'shaughnessy Asset Management, Llc | 2.441 | 301,48 | 138 | 318,18 | ||||
| 2025-07-08 | 13F | Nbc Securities, Inc. | 1.224 | 1,83 | 0 | |||||
| 2025-08-12 | 13F | Ameritas Investment Partners, Inc. | 4.108 | 24,52 | 233 | 26,78 | ||||
| 2025-08-14 | 13F | Jane Street Group, Llc | 11.461 | -50,27 | 649 | -49,26 | ||||
| 2025-07-23 | 13F | Prime Capital Investment Advisors, LLC | 0 | -100,00 | 0 | |||||
| 2025-08-06 | 13F | Atlantic Union Bankshares Corp | 3.449 | 195 | ||||||
| 2025-08-14 | 13F | Royal Bank Of Canada | 3.528 | 19,43 | 200 | 21,95 | ||||
| 2025-07-25 | 13F | Concord Wealth Partners | 87 | 0,00 | 5 | 0,00 | ||||
| 2025-08-05 | 13F | Simplex Trading, Llc | 0 | -100,00 | 0 | |||||
| 2025-04-22 | 13F | World Equity Group, Inc. | 0 | -100,00 | 0 | |||||
| 2025-08-12 | 13F | Jpmorgan Chase & Co | 259 | 25.800,00 | 15 | |||||
| 2025-08-04 | 13F | Creative Financial Designs Inc /adv | 640 | -17,95 | 36 | -16,28 | ||||
| 2025-08-14 | 13F | Financial Engines Advisors L.L.C. | 5.953.357 | 0,19 | 337.195 | 2,22 | ||||
| 2025-08-14 | 13F | Qube Research & Technologies Ltd | 48 | 0,00 | 3 | 0,00 | ||||
| 2025-08-04 | 13F | Balentine LLC | 29 | 0,00 | 2 | 0,00 | ||||
| 2025-05-16 | 13F | Coppell Advisory Solutions LLC | 0 | -100,00 | 0 | |||||
| 2025-08-14 | 13F | Citadel Advisors Llc | 0 | -100,00 | 0 | |||||
| 2025-05-06 | 13F | Atria Investments Llc | 0 | -100,00 | 0 | |||||
| 2025-08-13 | 13F | Virtue Capital Management, LLC | 0 | -100,00 | 0 | |||||
| 2025-05-07 | 13F | HB Wealth Management, LLC | 0 | -100,00 | 0 | |||||
| 2025-08-14 | 13F | Susquehanna International Group, Llp | 26.809 | 150,22 | 1.518 | 155,56 | ||||
| 2025-08-07 | 13F | Allworth Financial LP | 63 | 0,00 | 4 | 0,00 | ||||
| 2025-08-12 | 13F | Deutsche Bank Ag\ | 37.049 | -17,38 | 2.098 | -15,71 | ||||
| 2025-08-14 | 13F | Bank Of America Corp /de/ | 79.138 | -1,92 | 4.482 | 0,07 | ||||
| 2025-08-08 | 13F | Capital Investment Advisory Services, LLC | 344 | -26,02 | 19 | -24,00 | ||||
| 2025-08-13 | 13F | Baird Financial Group, Inc. | 131.909 | 12,33 | 7.471 | 14,62 | ||||
| 2025-08-15 | 13F | Morgan Stanley | 178.148 | 15,81 | 10.090 | 18,16 | ||||
| 2025-08-06 | 13F | First Horizon Advisors, Inc. | 98.580 | 10,17 | 5.584 | 12,40 | ||||
| 2025-08-11 | 13F | Hopwood Financial Services, Inc. | 40 | -46,67 | 2 | -50,00 | ||||
| 2025-08-11 | 13F | Private Advisor Group, LLC | 8.029 | -1,21 | 455 | 0,67 | ||||
| 2025-07-16 | 13F/A | CX Institutional | 21 | 0,00 | 0 | |||||
| 2025-09-04 | 13F/A | Advisor Group Holdings, Inc. | 99.566 | 396,79 | 5.542 | 398,29 | ||||
| 2025-07-10 | 13F | Wealth Enhancement Advisory Services, Llc | 4.047 | 237 | ||||||
| 2025-07-15 | 13F | Mather Group, Llc. | 0 | -100,00 | 0 | |||||
| 2025-07-31 | 13F | Cambridge Investment Research Advisors, Inc. | 11.410 | -15,00 | 1 | |||||
| 2025-08-13 | 13F | Flow Traders U.s. Llc | 13.018 | -10,21 | 1 | |||||
| 2025-08-13 | 13F | Consultiva Wealth Management, Corp. | 2.313 | 0,17 | 131 | 1,56 | ||||
| 2025-07-29 | 13F | International Assets Investment Management, Llc | 33.927 | -2,86 | 1.922 | -0,88 | ||||
| 2025-08-12 | 13F | CIBC Private Wealth Group, LLC | 0 | -100,00 | 0 | |||||
| 2025-07-10 | 13F | Focus Financial Network, Inc. | 11.180 | -17,73 | 633 | -16,05 | ||||
| 2025-07-24 | 13F | Ronald Blue Trust, Inc. | 200 | 0,00 | 11 | 0,00 | ||||
| 2025-08-12 | 13F | LPL Financial LLC | 180.757 | 8,60 | 10.238 | 10,80 | ||||
| 2025-08-08 | 13F | Cetera Investment Advisers | 9.868 | -24,95 | 559 | -23,46 | ||||
| 2025-07-23 | 13F | Sachetta, LLC | 129 | -22,75 | 7 | -22,22 | ||||
| 2025-07-17 | 13F | DiNuzzo Private Wealth, Inc. | 2.880 | 0,00 | 163 | 2,52 | ||||
| 2025-07-31 | 13F | Hanlon Investment Management, Inc. | 0 | -100,00 | 0 | |||||
| 2025-08-12 | 13F | Franklin Resources Inc | 181.754 | -0,30 | 10.294 | 1,73 | ||||
| 2025-08-08 | 13F | Pnc Financial Services Group, Inc. | 2.365 | 3.714,52 | 134 | 4.333,33 | ||||
| 2025-07-25 | 13F | Cwm, Llc | 105.571 | -4,42 | 6 | -16,67 | ||||
| 2025-07-25 | 13F | Atria Wealth Solutions, Inc. | 0 | -100,00 | 0 | |||||
| 2025-08-06 | 13F | Rialto Wealth Management, LLC | 7 | 0,00 | 0 | |||||
| 2025-08-12 | 13F | MAI Capital Management | 192 | 0,00 | 11 | 0,00 | ||||
| 2025-08-11 | 13F | Aptus Capital Advisors, LLC | 11 | 0,00 | 1 | |||||
| 2025-08-19 | 13F | Cape Investment Advisory, Inc. | 786 | 0,00 | 45 | 2,33 | ||||
| 2025-08-06 | 13F | Commonwealth Equity Services, Llc | 6.793 | -2,89 | 0 | |||||
| 2025-04-15 | 13F | Mv Capital Management, Inc. | 0 | -100,00 | 0 | |||||
| 2025-07-29 | 13F | Stratos Wealth Partners, LTD. | 16.639 | 3,93 | 942 | 6,08 | ||||
| 2025-08-14 | 13F | MGB Wealth Management, LLC | 93 | 0,00 | 5 | 0,00 | ||||
| 2025-08-14 | 13F | Mariner, LLC | 113.879 | -15,76 | 6.450 | -14,05 | ||||
| 2025-07-29 | 13F | Stratos Wealth Advisors, LLC | 35.108 | -0,60 | 1.989 | 1,43 | ||||
| 2025-07-17 | 13F | XML Financial, LLC | 125.180 | -2,82 | 7.090 | -0,84 | ||||
| 2025-08-11 | 13F | Hexagon Capital Partners LLC | 0 | -100,00 | 0 | |||||
| 2025-08-13 | 13F | Jones Financial Companies Lllp | 7.104 | 49,21 | 401 | 53,05 | ||||
| 2025-04-23 | 13F | Financial Life Planners | 0 | -100,00 | 0 | |||||
| 2025-07-14 | 13F | AdvisorNet Financial, Inc | 185 | 10 | ||||||
| 2025-05-08 | 13F | Us Bancorp \de\ | 0 | -100,00 | 0 | |||||
| 2025-08-06 | 13F | AE Wealth Management LLC | 457 | -38,16 | 26 | -39,02 | ||||
| 2025-08-12 | 13F | Virtu Financial LLC | 0 | -100,00 | 0 | |||||
| 2025-07-29 | 13F | Private Trust Co Na | 223 | 0,00 | 13 | 0,00 | ||||
| 2025-08-01 | 13F | Envestnet Asset Management Inc | 102.032 | -13,99 | 5.779 | -12,24 | ||||
| 2025-07-24 | 13F | JNBA Financial Advisors | 835 | -8,04 | 47 | -6,00 | ||||
| 2025-08-12 | 13F | Proequities, Inc. | 0 | 0 | ||||||
| 2025-08-12 | 13F | Global Retirement Partners, LLC | 13 | -99,75 | 1 | -100,00 | ||||
| 2025-08-06 | 13F | Csenge Advisory Group | 16.650 | -0,20 | 902 | 3,44 | ||||
| 2025-08-13 | 13F | Capital Analysts, Inc. | 466 | 0,00 | 0 | |||||
| 2025-07-30 | 13F | D.a. Davidson & Co. | 23.171 | -6,91 | 1.312 | -5,00 | ||||
| 2025-07-08 | 13F | Parallel Advisors, LLC | 566 | 0,00 | 32 | 3,23 | ||||
| 2025-07-24 | 13F | Blair William & Co/il | 118 | 0,00 | 7 | 0,00 | ||||
| 2025-08-11 | 13F | Beaumont Capital Management, LLC | 0 | -100,00 | 0 | |||||
| 2025-08-13 | 13F | Hollow Brook Wealth Management LLC | 53.642 | 0,00 | 3.038 | 2,05 | ||||
| 2025-08-05 | 13F | Bank Of Montreal /can/ | 0 | -100,00 | 0 | |||||
| 2025-08-05 | 13F | Key FInancial Inc | 157 | 0,00 | 9 | 0,00 | ||||
| 2025-08-13 | 13F | Per Stirling Capital Management, LLC. | 11.060 | 1,12 | 626 | 3,13 | ||||
| 2025-08-14 | 13F | Comerica Bank | 3.909 | 0,00 | 221 | 2,31 |