Grundlæggende statistik
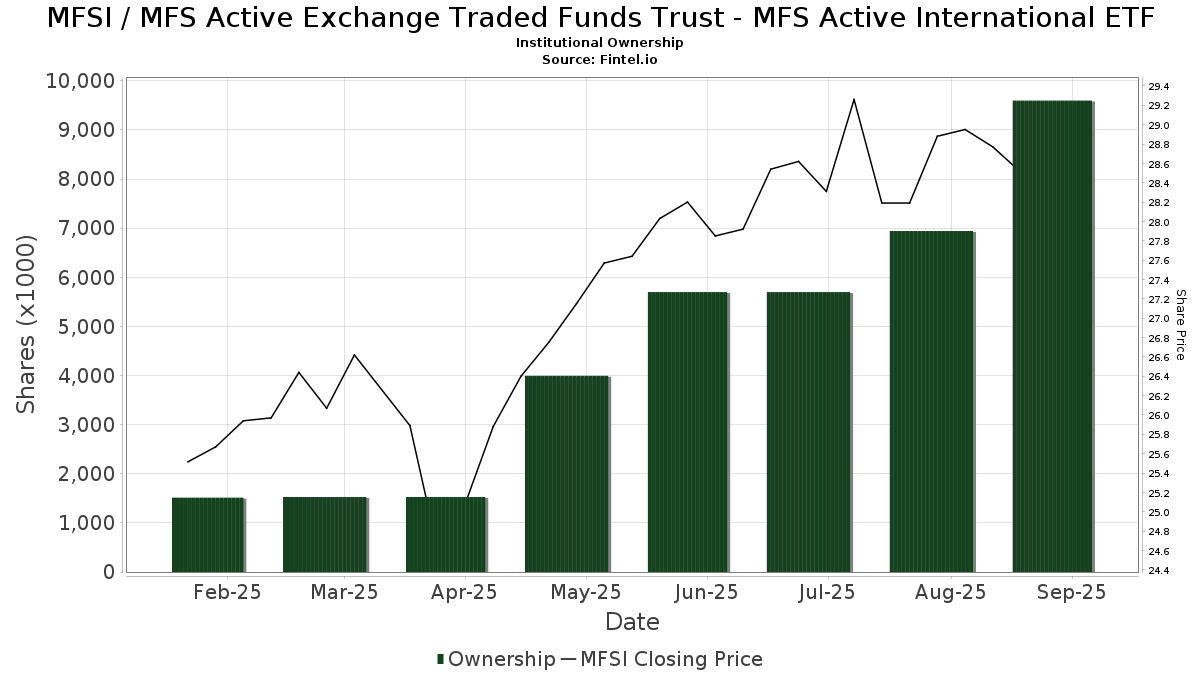
| Institutionelle ejere | 56 total, 56 long only, 0 short only, 0 long/short - change of 30,23% MRQ |
| Gennemsnitlig porteføljeallokering | 0.5952 % - change of -23,11% MRQ |
| Institutionelle aktier (lange) | 16.179.541 (ex 13D/G) - change of 1,81MM shares 12,57% MRQ |
| Institutionel værdi (lang) | $ 464.406 USD ($1000) |
Institutionelt ejerskab og aktionærer
MFS Active Exchange Traded Funds Trust - MFS Active International ETF (US:MFSI) har 56 institutionelle ejere og aktionærer, der har indsendt 13D/G- eller 13F-formularer til Securities Exchange Commission (SEC). Disse institutioner har i alt 16,179,541 aktier. Største aktionærer omfatter Raymond James Financial Inc, LPL Financial LLC, Old Second National Bank Of Aurora, Kestra Private Wealth Services, Llc, Jones Financial Companies Lllp, Baron Wealth Management LLC, River Street Advisors LLC, Capital Analysts, Inc., CMH Wealth Management LLC, and Cetera Investment Advisers .
MFS Active Exchange Traded Funds Trust - MFS Active International ETF (NYSE:MFSI) institutionel ejerskabsstruktur viser aktuelle positioner i virksomheden efter institutioner og fonde, samt seneste ændringer i positionsstørrelse. Større aktionærer kan omfatte individuelle investorer, investeringsforeninger, hedgefonde eller institutioner. Skema 13D angiver, at investoren besidder (eller besidder) mere end 5 % af virksomheden og har til hensigt (eller har til hensigt at) aktivt at forfølge en ændring i forretningsstrategi. Skema 13G indikerer en passiv investering på over 5%.
The share price as of April 24, 2026 is 31,34 / share. Previously, on April 28, 2025, the share price was 26,28 / share. This represents an increase of 19,27% over that period.
Fondens stemningsscore
Fund Sentiment Score (fka Ownership Accumulation Score) finder de aktier, der bliver mest købt af fonde. Det er resultatet af en sofistikeret, multi-faktor kvantitativ model, der identificerer virksomheder med de højeste niveauer af institutionel akkumulering. Scoringsmodellen bruger en kombination af den samlede stigning i oplyste ejere, ændringerne i porteføljeallokeringer i disse ejere og andre målinger. Tallet går fra 0 til 100, hvor højere tal indikerer et højere niveau af akkumulering for sine jævnaldrende, og 50 er gennemsnittet.
Opdateringsfrekvens: Dagligt
Se Ownership Explorer, som giver en liste over højest rangerende virksomheder.
AI+ Ask Fintel’s AI assistant about MFS Active Exchange Traded Funds Trust - MFS Active International ETF.
Select a question to share a public post with an AI-crafted answer.
Thinking of good questions…
Institutionel Put/Call-forhold
Ud over at indberette standardaktie- og gældsudstedelser skal institutter med mere end 100 mill. aktiver under forvaltning også oplyse deres put- og call-optionsbeholdninger. Da salgsoptioner generelt indikerer negativ stemning, og købsoptioner indikerer positiv stemning, kan vi få en fornemmelse af den overordnede institutionelle stemning ved at plotte forholdet mellem put og kald. Diagrammet til højre viser det historiske put/call-forhold for dette instrument.
Brug af Put/Call Ratio som en indikator for investorernes stemning overvinder en af de vigtigste mangler ved at bruge totalt institutionelt ejerskab, som er, at en betydelig mængde af aktiver under forvaltning investeres passivt for at spore indekser. Passivt forvaltede fonde køber typisk ikke optioner, så indikatoren for put/call-forholdet følger mere nøje følelsen af aktivt forvaltede fonde.
13F og NPORT arkivering
Detaljer om 13F-arkivering er gratis. Detaljer om NP-ansøgninger kræver et premium-medlemskab. Grønne rækker angiver nye positioner. Røde rækker angiver lukkede positioner. Klik på linket ikon for at se den fulde transaktionshistorik.
Opgrader
for at låse premium-data op og eksportere til Excel ![]() .
.
| Fil dato | Kilde | Investor | Type | Gennemsnitlig pris (Øst) |
Aktier | Δ Aktier (%) |
Rapporteret Værdi ($1000) |
Δ Værdi (%) |
Port Alloc (%) |
|
|---|---|---|---|---|---|---|---|---|---|---|
| 2026-04-16 | 13F | Baron Wealth Management LLC | 974.446 | -0,36 | 28.961 | -2,75 | ||||
| 2026-02-02 | 13F | Truist Financial Corp | 31.375 | 8,71 | 955 | 12,09 | ||||
| 2026-02-13 | 13F | Integrity Financial Corp /WA | 155.935 | 1,59 | 4.748 | 4,72 | ||||
| 2026-02-02 | 13F | Benjamin Edwards Inc | 28.981 | 8,66 | 882 | 12,07 | ||||
| 2026-02-12 | 13F | Steward Partners Investment Advisory, Llc | 31.079 | -2,49 | 946 | 0,53 | ||||
| 2026-02-17 | 13F | Gladstone Institutional Advisory LLC | 61.517 | 1.873 | ||||||
| 2026-02-17 | 13F | Private Advisor Group, LLC | 53.850 | 90,09 | 1.640 | 96,05 | ||||
| 2026-02-13 | 13F | Kestra Advisory Services, LLC | 0 | -100,00 | 0 | |||||
| 2026-01-26 | 13F | Heritage Wealth Architects, Inc. | 30.481 | 51,00 | 950 | 59,23 | ||||
| 2026-01-29 | 13F | D.a. Davidson & Co. | 22.811 | -6,37 | 695 | -3,48 | ||||
| 2026-02-11 | 13F | LPL Financial LLC | 1.386.772 | 49,23 | 42.227 | 53,83 | ||||
| 2026-01-23 | 13F | Smith, Moore & Co. | 20.906 | -18,67 | 637 | -16,21 | ||||
| 2026-02-13 | 13F | Morgan Dempsey Capital Management Llc | 2.954 | 0,00 | 90 | 2,30 | ||||
| 2026-01-26 | 13F | Cwm, Llc | 2.427 | 0 | ||||||
| 2026-02-13 | 13F | Stifel Financial Corp | 277.840 | 42,22 | 8.460 | 46,60 | ||||
| 2026-04-22 | 13F | Apollon Wealth Management, LLC | 14.293 | 425 | ||||||
| 2026-02-13 | 13F | Mariner, LLC | 171.499 | 25,91 | 5.222 | 29,80 | ||||
| 2026-02-10 | 13F | Natixis Advisors, L.p. | 76.297 | 120,73 | 2 | 100,00 | ||||
| 2026-02-17 | 13F | Cetera Investment Advisers | 614.485 | 30,25 | 18.711 | 34,26 | ||||
| 2026-01-26 | 13F | Northwest Capital Management Inc | 2.427 | 74 | ||||||
| 2025-11-13 | 13F | Wells Fargo & Company/mn | 0 | -100,00 | 0 | |||||
| 2026-02-17 | 13F | Citadel Advisors Llc | 0 | -100,00 | 0 | |||||
| 2026-02-10 | 13F | Spectrum Wealth Advisory Group, LLC | 319.738 | 9.736 | ||||||
| 2026-04-22 | 13F | Spire Wealth Management | 1.230 | 37 | ||||||
| 2026-02-17 | 13F | Royal Bank Of Canada | 396.444 | 13,33 | 12.072 | 16,82 | ||||
| 2026-02-17 | 13F | Wiley Bros.-aintree Capital, Llc | 9.539 | 18,22 | 290 | 21,85 | ||||
| 2026-02-11 | 13F | Capital Analysts, Inc. | 675.557 | 26,48 | 21 | 33,33 | ||||
| 2026-02-12 | 13F | Commonwealth Equity Services, Llc | 262.482 | 65,74 | 7.993 | 199.700,00 | ||||
| 2026-02-12 | 13F | Jane Street Group, Llc | 75.593 | -76,42 | 2.302 | -75,70 | ||||
| 2026-02-04 | 13F | MONECO Advisors, LLC | 15.003 | 24,10 | 457 | 27,73 | ||||
| 2026-02-06 | 13F | Flaharty Asset Management, LLC | 205.262 | 6.250 | ||||||
| 2026-02-17 | 13F | Old Mission Capital Llc | 18.534 | -6,25 | 564 | -3,42 | ||||
| 2026-04-24 | 13F | Lynx Investment Advisory | 7.000 | 0,00 | 208 | -2,35 | ||||
| 2026-04-22 | 13F | Janney Montgomery Scott LLC | 44.465 | 1 | ||||||
| 2026-02-13 | 13F | Integrated Wealth Concepts LLC | 22.867 | -93,41 | 696 | -93,21 | ||||
| 2026-02-11 | 13F | Greykasell Wealth Strategies, Inc. | 75.908 | 1,05 | 2.311 | 4,15 | ||||
| 2026-04-20 | 13F | Kestra Private Wealth Services, Llc | 1.049.543 | 4,38 | 31.192 | 1,88 | ||||
| 2026-02-17 | 13F | Ancora Advisors, LLC | 4.200 | 128 | ||||||
| 2026-01-29 | 13F | Sanctuary Advisors, LLC | 15.669 | -34,91 | 477 | -32,91 | ||||
| 2026-02-13 | 13F | Mml Investors Services, Llc | 0 | -100,00 | 0 | |||||
| 2026-02-17 | 13F | Gotham Asset Management, LLC | 9.422 | 287 | ||||||
| 2026-04-13 | 13F | CMH Wealth Management LLC | 631.190 | 340,24 | 18.759 | 329,74 | ||||
| 2026-04-23 | 13F | Walleye Partners, LLC | 8.200 | 0,00 | 244 | -2,41 | ||||
| 2026-04-20 | 13F | Provenance Wealth Advisors, LLC | 4.954 | 147 | ||||||
| 2026-02-13 | 13F | Gts Securities Llc | 7.257 | 221 | ||||||
| 2026-04-21 | 13F | Old Second National Bank Of Aurora | 1.385.288 | 0,93 | 41.171 | -1,49 | ||||
| 2026-04-15 | 13F | DAVENPORT & Co LLC | 221.313 | 14,45 | 6.577 | 11,70 | ||||
| 2026-02-17 | 13F | Mars Jewett Financial Group, Inc. | 79.234 | 2.534 | ||||||
| 2026-01-15 | 13F | Victory Financial Group, Llc | 85.286 | 2.597 | ||||||
| 2026-02-09 | 13F | Kingsview Wealth Management, LLC | 6.712 | 204 | ||||||
| 2026-04-16 | 13F | Annex Advisory Services, LLC | 587.778 | -80,41 | 17.469 | -80,88 | ||||
| 2026-04-21 | 13F | River Street Advisors LLC | 701.739 | 9,07 | 20.856 | 6,46 | ||||
| 2026-01-23 | 13F | JM2 Capital Inc. | 7.051 | 215 | ||||||
| 2026-02-18 | 13F | GWM Advisors LLC | 313.086 | 11,85 | 9.533 | 15,30 | ||||
| 2026-02-17 | 13F | Advisor Group Holdings, Inc. | 2.405 | 201,38 | 73 | 217,39 | ||||
| 2026-02-17 | 13F | Raymond James Financial Inc | 2.947.901 | 68,85 | 89.764 | 74,05 | ||||
| 2026-02-10 | 13F | Envestnet Asset Management Inc | 39.537 | 10,87 | 1.204 | 14,25 | ||||
| 2026-02-05 | 13F | Soltis Investment Advisors LLC | 427.146 | 5,37 | 13.007 | 8,62 | ||||
| 2026-02-17 | 13F | Bank Of America Corp /de/ | 515.222 | 15.689 | ||||||
| 2026-02-17 | 13F | Jones Financial Companies Lllp | 1.039.411 | 99,85 | 31.650 | 108,35 |