Grundlæggende statistik
| Institutionelle ejere | 109 total, 109 long only, 0 short only, 0 long/short - change of 3,77% MRQ |
| Gennemsnitlig porteføljeallokering | 0.1589 % - change of 55,71% MRQ |
| Institutionelle aktier (lange) | 4.045.173 (ex 13D/G) - change of 0,22MM shares 5,72% MRQ |
| Institutionel værdi (lang) | $ 368.570 USD ($1000) |
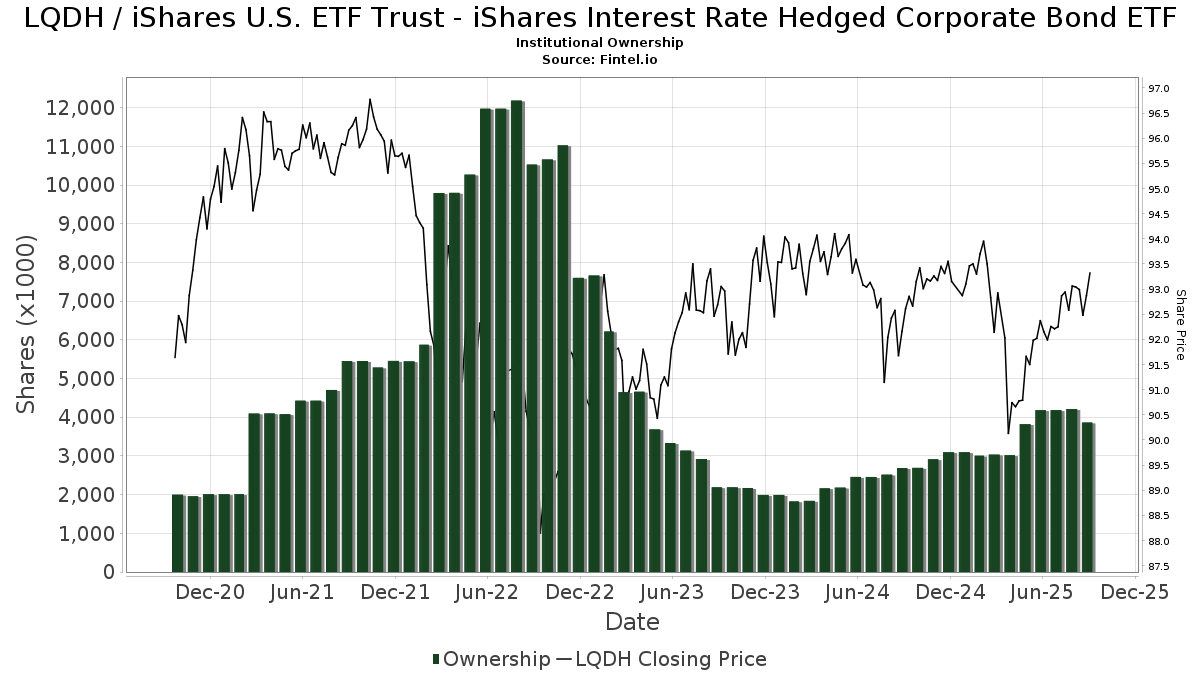
Institutionelt ejerskab og aktionærer
iShares U.S. ETF Trust - iShares Interest Rate Hedged Corporate Bond ETF (US:LQDH) har 109 institutionelle ejere og aktionærer, der har indsendt 13D/G- eller 13F-formularer til Securities Exchange Commission (SEC). Disse institutioner har i alt 4,045,173 aktier. Største aktionærer omfatter Destination Wealth Management, Envestnet Asset Management Inc, LPL Financial LLC, Bank Of America Corp /de/, Leo Wealth, LLC, Mml Investors Services, Llc, UBS Group AG, Capital Investment Advisory Services, LLC, Morgan Stanley, and Harbour Wealth Management Group, Inc. .
iShares U.S. ETF Trust - iShares Interest Rate Hedged Corporate Bond ETF (ARCA:LQDH) institutionel ejerskabsstruktur viser aktuelle positioner i virksomheden efter institutioner og fonde, samt seneste ændringer i positionsstørrelse. Større aktionærer kan omfatte individuelle investorer, investeringsforeninger, hedgefonde eller institutioner. Skema 13D angiver, at investoren besidder (eller besidder) mere end 5 % af virksomheden og har til hensigt (eller har til hensigt at) aktivt at forfølge en ændring i forretningsstrategi. Skema 13G indikerer en passiv investering på over 5%.
The share price as of March 18, 2026 is 91,64 / share. Previously, on March 19, 2025, the share price was 92,92 / share. This represents a decline of 1,38% over that period.
Fondens stemningsscore
Fund Sentiment Score (fka Ownership Accumulation Score) finder de aktier, der bliver mest købt af fonde. Det er resultatet af en sofistikeret, multi-faktor kvantitativ model, der identificerer virksomheder med de højeste niveauer af institutionel akkumulering. Scoringsmodellen bruger en kombination af den samlede stigning i oplyste ejere, ændringerne i porteføljeallokeringer i disse ejere og andre målinger. Tallet går fra 0 til 100, hvor højere tal indikerer et højere niveau af akkumulering for sine jævnaldrende, og 50 er gennemsnittet.
Opdateringsfrekvens: Dagligt
Se Ownership Explorer, som giver en liste over højest rangerende virksomheder.
AI+ Ask Fintel’s AI assistant about iShares U.S. ETF Trust - iShares Interest Rate Hedged Corporate Bond ETF.
Select a question to share a public post with an AI-crafted answer.
Thinking of good questions…
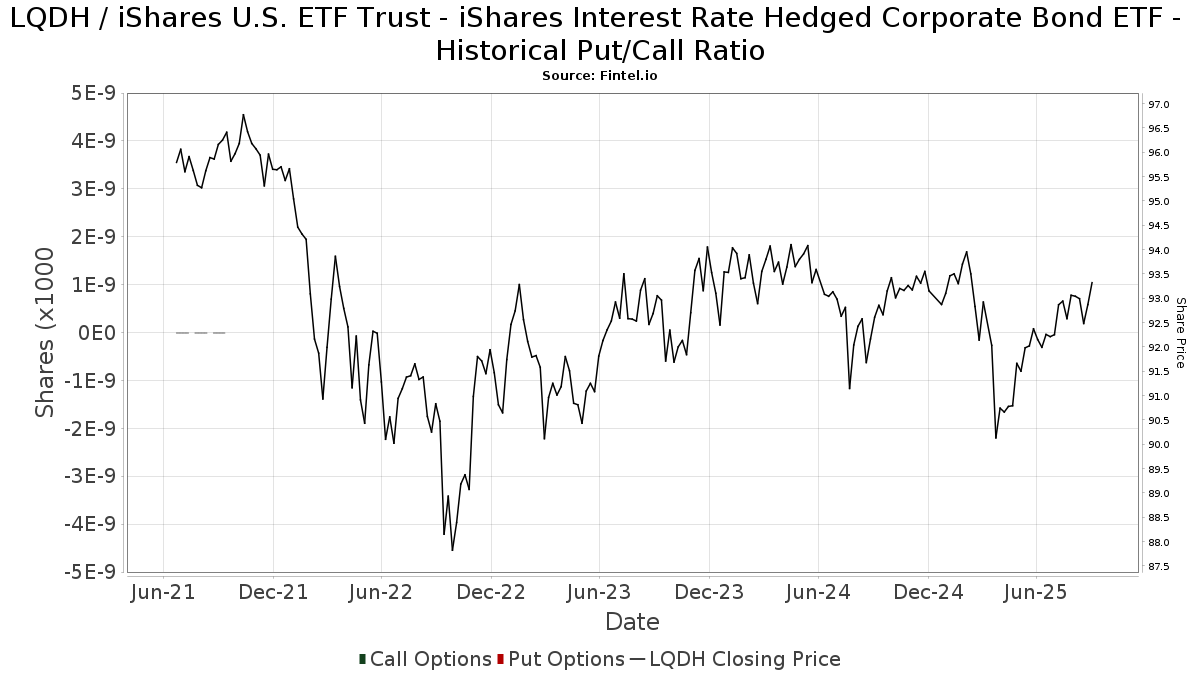
Institutionel Put/Call-forhold
Ud over at indberette standardaktie- og gældsudstedelser skal institutter med mere end 100 mill. aktiver under forvaltning også oplyse deres put- og call-optionsbeholdninger. Da salgsoptioner generelt indikerer negativ stemning, og købsoptioner indikerer positiv stemning, kan vi få en fornemmelse af den overordnede institutionelle stemning ved at plotte forholdet mellem put og kald. Diagrammet til højre viser det historiske put/call-forhold for dette instrument.
Brug af Put/Call Ratio som en indikator for investorernes stemning overvinder en af de vigtigste mangler ved at bruge totalt institutionelt ejerskab, som er, at en betydelig mængde af aktiver under forvaltning investeres passivt for at spore indekser. Passivt forvaltede fonde køber typisk ikke optioner, så indikatoren for put/call-forholdet følger mere nøje følelsen af aktivt forvaltede fonde.
13F og NPORT arkivering
Detaljer om 13F-arkivering er gratis. Detaljer om NP-ansøgninger kræver et premium-medlemskab. Grønne rækker angiver nye positioner. Røde rækker angiver lukkede positioner. Klik på linket ikon for at se den fulde transaktionshistorik.
Opgrader
for at låse premium-data op og eksportere til Excel ![]() .
.
| Fil dato | Kilde | Investor | Type | Gennemsnitlig pris (Øst) |
Aktier | Δ Aktier (%) |
Rapporteret Værdi ($1000) |
Δ Værdi (%) |
Port Alloc (%) |
|
|---|---|---|---|---|---|---|---|---|---|---|
| 2026-02-06 | 13F | Red Wave Investments LLC | 22.326 | -1,90 | 2.084 | -2,07 | ||||
| 2026-01-20 | 13F | Savvy Advisors, Inc. | 31.455 | 2.936 | ||||||
| 2026-02-12 | 13F | Betterment LLC | 22.460 | 17,43 | 2 | 100,00 | ||||
| 2026-01-28 | 13F | Geneos Wealth Management Inc. | 1.349 | -3,92 | 126 | -4,58 | ||||
| 2026-02-24 | 13F | MidFirst Bank | 97 | 9 | ||||||
| 2026-02-17 | 13F | Citadel Advisors Llc | 10.880 | 1.016 | ||||||
| 2026-01-26 | 13F | Harbor Asset Planning, Inc. | 450 | 42 | ||||||
| 2026-01-27 | 13F | Able Wealth Management LLC | 15.784 | 0,99 | 1.473 | 0,75 | ||||
| 2026-02-17 | 13F | Ameriflex Group, Inc. | 100 | -50,00 | 9 | -50,00 | ||||
| 2026-01-26 | 13F | AE Wealth Management LLC | 23 | 2 | ||||||
| 2025-10-21 | 13F | Steel Peak Wealth Management LLC | 0 | -100,00 | 0 | |||||
| 2026-01-22 | 13F | Richardson Financial Services Inc. | 6 | 0,00 | 1 | |||||
| 2025-11-12 | 13F | First Trust Advisors Lp | 0 | -100,00 | 0 | |||||
| 2026-02-05 | 13F | Cambridge Investment Research Advisors, Inc. | 25.275 | -10,47 | 2 | 0,00 | ||||
| 2026-01-05 | 13F | Park Avenue Securities Llc | 21.352 | 12,09 | 2 | 0,00 | ||||
| 2026-01-14 | 13F | Wealthcare Advisory Partners LLC | 5.178 | 13,11 | 483 | 12,85 | ||||
| 2026-02-05 | 13F | Park Square Financial Group, LLC | 81 | 68,75 | 8 | 75,00 | ||||
| 2026-02-10 | 13F/A | Northwestern Mutual Wealth Management Co | 24.358 | 119,84 | 2.274 | 119,40 | ||||
| 2026-02-12 | 13F | Compass Capital Corp /ma/ /adv | 2.686 | 250 | ||||||
| 2025-10-08 | 13F | Beacon Financial Group | 53.117 | -23,62 | 4.969 | -22,68 | ||||
| 2026-02-17 | 13F | United Capital Financial Advisers, Llc | 25.463 | 0,75 | 2.377 | 0,55 | ||||
| 2026-01-12 | 13F | ONE Advisory Partners, LLC | 2.419 | 226 | ||||||
| 2026-02-10 | 13F | Bank of New York Mellon Corp | 46.539 | 19,84 | 4.344 | 19,60 | ||||
| 2026-02-18 | 13F | Beacon Pointe Advisors, LLC | 16.071 | 9,24 | 1.500 | 9,01 | ||||
| 2026-01-22 | 13F | Trilogy Capital Inc. | 7.551 | -8,13 | 705 | -8,33 | ||||
| 2026-02-13 | 13F | Aptus Capital Advisors, LLC | 0 | -100,00 | 0 | |||||
| 2026-01-08 | 13F | Wealth Enhancement Advisory Services, Llc | 34.443 | 15,76 | 3.218 | 15,80 | ||||
| 2026-02-06 | 13F | Envestnet Portfolio Solutions, Inc. | 10.282 | 2,52 | 960 | 2,24 | ||||
| 2026-02-13 | 13F | Wells Fargo & Company/mn | 253 | 2.430,00 | 24 | |||||
| 2026-01-15 | 13F | Alpine Bank Wealth Management | 11.465 | -22,12 | 1.070 | -22,29 | ||||
| 2026-02-10 | 13F | Envestnet Asset Management Inc | 411.670 | -4,60 | 38.429 | -4,80 | ||||
| 2026-02-12 | 13F | Commonwealth Equity Services, Llc | 2.917 | 272 | ||||||
| 2026-02-13 | 13F | Smartleaf Asset Management LLC | 0 | -100,00 | 0 | |||||
| 2026-02-11 | 13F | Vista Cima Wealth Management LLC | 2.932 | 0,93 | 274 | 0,74 | ||||
| 2026-01-16 | 13F | Bangor Savings Bank | 185 | 0,00 | 17 | 0,00 | ||||
| 2026-02-17 | 13F | Cetera Investment Advisers | 31.001 | 16,20 | 2.894 | 15,99 | ||||
| 2026-01-23 | 13F | Diversify Advisory Services, LLC | 2.345 | -7,64 | 220 | -6,78 | ||||
| 2026-02-02 | 13F | FSA Advisors, Inc. | 2.542 | 17,85 | 237 | 17,91 | ||||
| 2026-02-12 | 13F | Rossby Financial, LCC | 28 | 0,00 | 3 | 0,00 | ||||
| 2025-11-14 | 13F | Integrated Wealth Concepts LLC | 0 | -100,00 | 0 | |||||
| 2026-02-04 | 13F | Mascoma Wealth Management LLC | 174 | -80,00 | 16 | -80,25 | ||||
| 2026-02-17 | 13F | Bank Of America Corp /de/ | 282.528 | -0,50 | 26.374 | -0,72 | ||||
| 2025-11-04 | 13F | Sollinda Capital Management LLC | 0 | -100,00 | 0 | |||||
| 2026-02-17 | 13F | GeoWealth Management, LLC | 3.163 | 3,88 | 295 | 3,87 | ||||
| 2026-02-02 | 13F | Oppenheimer & Co Inc | 4.483 | 95,34 | 418 | 95,33 | ||||
| 2026-02-11 | 13F | Jpmorgan Chase & Co | 20.342 | 10,75 | 1.899 | 10,48 | ||||
| 2026-01-22 | 13F | Columbia Advisory Partners Llc | 21.088 | -25,94 | 1.969 | -26,10 | ||||
| 2026-01-08 | 13F | Maridea Wealth Management LLC | 4.210 | -0,47 | 393 | -0,25 | ||||
| 2026-02-13 | 13F | Resources Investment Advisors, LLC. | 51.260 | -1,72 | 4.785 | -1,91 | ||||
| 2026-02-17 | 13F | Cape Investment Advisory, Inc. | 308 | 29 | ||||||
| 2026-01-14 | 13F | ORG Partners LLC | 16.395 | 0,10 | 1.530 | -0,13 | ||||
| 2026-02-11 | 13F | Gwn Securities Inc. | 7.244 | -18,58 | 676 | -19,04 | ||||
| 2026-02-13 | 13F | Stifel Financial Corp | 15.371 | 0,00 | 1.435 | -0,21 | ||||
| 2026-02-04 | 13F | Ameritas Advisory Services, LLC | 0 | -100,00 | 0 | |||||
| 2026-01-14 | 13F | Spire Wealth Management | 283 | 784,38 | 26 | 766,67 | ||||
| 2026-01-21 | 13F | Leo Wealth, LLC | 262.375 | 132,76 | 24.500 | 132,35 | ||||
| 2026-02-10 | 13F | WCG Wealth Advisors LLC | 20.161 | 1,89 | 1.882 | 1,62 | ||||
| 2025-10-29 | 13F | Inspire Advisors, LLC | 0 | -100,00 | 0 | |||||
| 2026-01-21 | 13F | Prime Capital Investment Advisors, LLC | 40.263 | 19,43 | 3.759 | 19,19 | ||||
| 2025-11-12 | 13F | Creative Financial Designs Inc /adv | 0 | -100,00 | 0 | |||||
| 2025-11-12 | 13F | Transce3nd, LLC | 0 | -100,00 | 0 | |||||
| 2026-01-13 | 13F | Two West Capital Advisors LLC | 5.074 | 8,81 | 474 | 8,49 | ||||
| 2026-02-12 | 13F | Great Valley Advisor Group, Inc. | 2.660 | -5,71 | 248 | -5,70 | ||||
| 2026-02-13 | 13F | Kestra Advisory Services, LLC | 1.279 | 119 | ||||||
| 2026-02-17 | 13F | Advisory Services Network, LLC | 5.274 | 1,91 | 492 | 1,65 | ||||
| 2026-02-18 | 13F | EP Wealth Advisors, Inc. | 0 | -100,00 | 0 | |||||
| 2026-02-11 | 13F | Janney Montgomery Scott LLC | 27.967 | 10,82 | 3 | 0,00 | ||||
| 2026-01-29 | 13F | Sanctuary Advisors, LLC | 21.024 | 19,77 | 1.963 | 19,49 | ||||
| 2026-01-29 | 13F | Comerica Bank | 296 | -7,79 | 28 | -10,00 | ||||
| 2026-01-20 | 13F | AdvisorNet Financial, Inc | 2.942 | -94,08 | 275 | -94,11 | ||||
| 2026-02-10 | 13F | Spectrum Planning & Advisory Services Inc. | 4.950 | 462 | ||||||
| 2026-02-13 | 13F | Journey Strategic Wealth Llc | 2.283 | 0,00 | 213 | 0,00 | ||||
| 2026-01-16 | 13F | Empirical Financial Services, LLC d.b.a. Empirical Wealth Management | 2.444 | 228 | ||||||
| 2026-02-17 | 13F | Keebeck Wealth Management, LLC | 6.019 | 54,97 | 562 | 54,55 | ||||
| 2025-11-12 | 13F | Principal Securities, Inc. | 0 | -100,00 | 0 | |||||
| 2026-01-26 | 13F | West Wealth Group, LLC | 2.287 | 0,66 | 214 | 0,47 | ||||
| 2026-02-17 | 13F | Susquehanna International Group, Llp | 0 | -100,00 | 0 | |||||
| 2026-02-17 | 13F | Fmr Llc | 80 | -46,67 | 7 | -50,00 | ||||
| 2026-01-22 | 13F | Glass Jacobson Investment Advisors llc | 645 | 17,27 | 60 | 17,65 | ||||
| 2026-02-02 | 13F | Truist Financial Corp | 16.563 | 5,10 | 1.546 | 4,88 | ||||
| 2026-02-13 | 13F | Mml Investors Services, Llc | 167.831 | 10,45 | 15.667 | 10,22 | ||||
| 2026-02-17 | 13F | Private Advisor Group, LLC | 2.430 | -3,49 | 227 | -3,83 | ||||
| 2026-02-14 | 13F | Rockefeller Capital Management L.P. | 43.768 | 20,15 | 4.086 | 19,90 | ||||
| 2026-02-09 | 13F | Harbour Investments, Inc. | 2.463 | 0,00 | 230 | -0,43 | ||||
| 2026-02-06 | 13F | GPS Wealth Strategies Group, LLC | 0 | -100,00 | 0 | |||||
| 2026-02-17 | 13F | Signature Equity Partners, LLC | 310 | 29 | ||||||
| 2026-02-02 | 13F | Fifth Third Bancorp | 62 | 6 | ||||||
| 2026-02-09 | 13F | Huntington National Bank | 0 | |||||||
| 2026-01-13 | 13F | CoreCap Advisors, LLC | 175 | 0,00 | 16 | 0,00 | ||||
| 2025-11-14 | 13F | Strategic Wealth Partners, Ltd. | 104 | 10 | ||||||
| 2026-01-23 | 13F | Twelve Points Wealth Management LLC | 55.452 | 316,34 | 5.189 | 316,71 | ||||
| 2026-02-17 | 13F | Mercer Global Advisors Inc /adv | 3.905 | 0,83 | 364 | 0,55 | ||||
| 2026-01-23 | 13F | Nbt Bank N A /ny | 93 | 38 | ||||||
| 2026-01-26 | 13F | Private Trust Co Na | 272 | 0,00 | 25 | 0,00 | ||||
| 2025-10-16 | 13F | Signature Resources Capital Management, LLC | 0 | -100,00 | 0 | |||||
| 2026-01-29 | 13F | UBS Group AG | 137.825 | 6,31 | 12.866 | 6,09 | ||||
| 2026-02-12 | 13F | BlackRock, Inc. | 705 | -86,56 | 66 | -86,73 | ||||
| 2026-02-13 | 13F | Transamerica Financial Advisors, Inc. | 6.740 | 629 | ||||||
| 2026-01-23 | 13F | Farther Finance Advisors, LLC | 158 | 102,56 | 15 | 100,00 | ||||
| 2026-02-13 | 13F | McAdam, LLC | 5.170 | -4,86 | 483 | -5,12 | ||||
| 2026-02-17 | 13F | Royal Bank Of Canada | 27.919 | 5,80 | 2.605 | 5,55 | ||||
| 2025-11-19 | 13F | Sunbelt Securities, Inc. | 0 | -100,00 | 0 | |||||
| 2026-02-19 | 13F | Harbour Wealth Management Group, Inc. | 95.991 | 8.961 | ||||||
| 2026-02-12 | 13F | Scotia Capital Inc. | 11.686 | -91,22 | 1.091 | -91,24 | ||||
| 2026-01-20 | 13F | Fundamentun, Llc | 8.918 | -0,23 | 833 | -0,48 | ||||
| 2026-02-12 | 13F | Triumph Capital Management | 57 | 0,00 | 5 | 0,00 | ||||
| 2026-02-13 | 13F | Destination Wealth Management | 892.414 | 4,07 | 83.307 | 3,85 | ||||
| 2026-01-28 | 13F | Eagle Global Advisors Llc | 3.530 | 330 | ||||||
| 2026-02-12 | 13F | Insigneo Advisory Services, Llc | 0 | -100,00 | 0 | |||||
| 2026-01-23 | 13F | Assetmark, Inc | 24.869 | -31,74 | 2.322 | -31,90 | ||||
| 2026-02-17 | 13F | Advisor Group Holdings, Inc. | 41.175 | -20,87 | 3.844 | -20,50 | ||||
| 2026-02-13 | 13F | Morgan Stanley | 99.470 | 24,40 | 9.286 | 24,15 | ||||
| 2026-02-06 | 13F | Global Retirement Partners, LLC | 16.437 | 8,00 | 1.534 | 7,80 | ||||
| 2026-01-30 | 13F | Catalytic Wealth RIA, LLC | 3.160 | 3,88 | 295 | 3,52 | ||||
| 2026-02-06 | 13F | Pnc Financial Services Group, Inc. | 2.002 | 16,94 | 187 | 16,25 | ||||
| 2026-02-10 | 13F | Foundations Investment Advisors, LLC | 0 | -100,00 | 0 | |||||
| 2026-02-17 | 13F | Raymond James Financial Inc | 76.449 | 4,21 | 7.137 | 3,99 | ||||
| 2026-02-11 | 13F | LPL Financial LLC | 393.935 | 12,91 | 36.774 | 12,67 | ||||
| 2026-02-17 | 13F | Coastal Bridge Advisors, LLC | 6.769 | 0,00 | 632 | -0,32 | ||||
| 2025-11-20 | 13F | Centaurus Financial, Inc. | 0 | -100,00 | 0 | |||||
| 2026-01-30 | 13F | North Star Investment Management Corp. | 167 | 16 | ||||||
| 2026-01-16 | 13F | Ronald Blue Trust, Inc. | 87 | 0,00 | 8 | 0,00 | ||||
| 2026-01-21 | 13F | Capital Investment Advisory Services, LLC | 109.515 | 1,93 | 10.223 | 1,72 | ||||
| 2026-01-16 | 13F | Perigon Wealth Management, LLC | 10.370 | -0,33 | 968 | -0,51 | ||||
| 2026-01-28 | 13F | Milestone Asset Management, Llc | 11.126 | 21,85 | 1.039 | 21,55 | ||||
| 2026-01-30 | 13F | Sigma Planning Corp | 3.199 | -10,92 | 299 | -11,04 | ||||
| 2026-02-06 | 13F | Motco | 0 | -100,00 | 0 | |||||
| 2026-02-12 | 13F | Jane Street Group, Llc | 19.372 | 24,31 | 1.808 | 24,09 | ||||
| 2026-02-12 | 13F | Bank Of Montreal /can/ | 57.341 | 3,68 | 5.353 | 3,46 | ||||
| 2026-02-12 | 13F | Founders Financial Alliance, LLC | 5.234 | 0,98 | 489 | 0,83 | ||||
| 2026-02-17 | 13F | Guardian Partners Inc. | 0 | -100,00 | 0 | |||||
| 2026-02-03 | 13F | Anfield Capital Management, LLC | 0 | -100,00 | 0 |