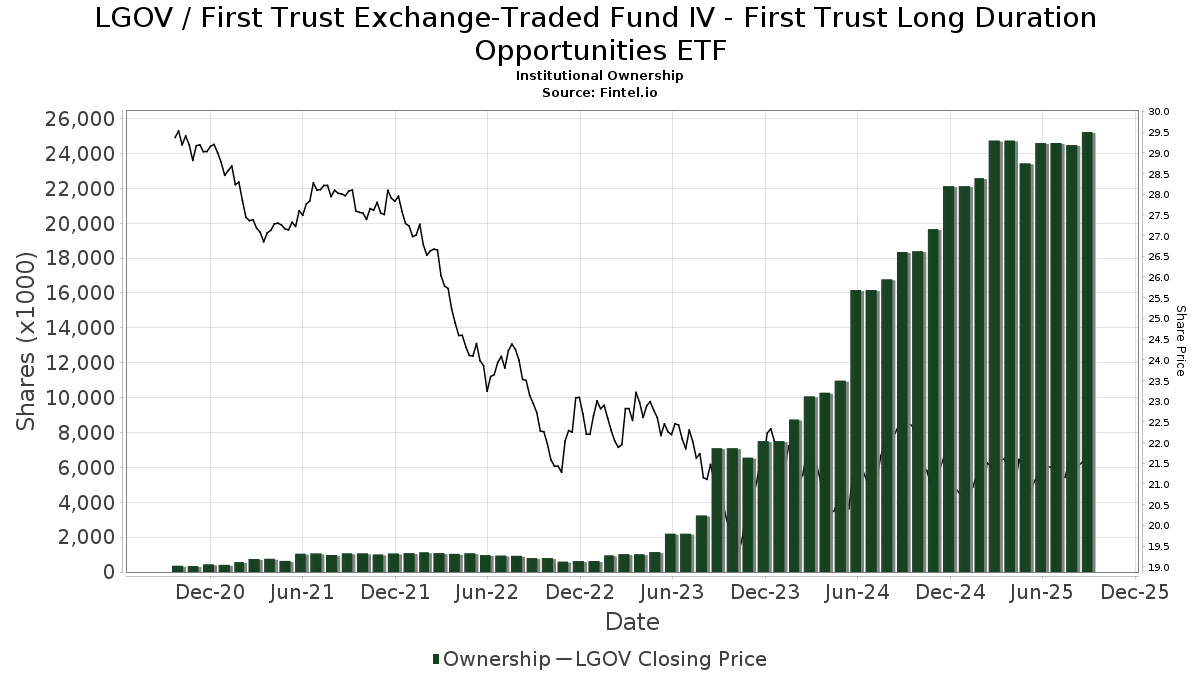
Grundlæggende statistik
| Institutionelle ejere | 137 total, 137 long only, 0 short only, 0 long/short - change of 9,60% MRQ |
| Gennemsnitlig porteføljeallokering | 0.4068 % - change of -18,51% MRQ |
| Institutionelle aktier (lange) | 24.890.024 (ex 13D/G) - change of -0,56MM shares -2,21% MRQ |
| Institutionel værdi (lang) | $ 515.127 USD ($1000) |
Institutionelt ejerskab og aktionærer
First Trust Exchange-Traded Fund IV - First Trust Long Duration Opportunities ETF (US:LGOV) har 137 institutionelle ejere og aktionærer, der har indsendt 13D/G- eller 13F-formularer til Securities Exchange Commission (SEC). Disse institutioner har i alt 24,890,024 aktier. Største aktionærer omfatter LPL Financial LLC, Royal Bank Of Canada, Raymond James Financial Inc, Morgan Stanley, Comprehensive Wealth Management, LLC, GDS Wealth Management, Csenge Advisory Group, Walkner Condon Financial Advisors LLC, Cambridge Investment Research Advisors, Inc., and Financial Enhancement Group LLC .
First Trust Exchange-Traded Fund IV - First Trust Long Duration Opportunities ETF (ARCA:LGOV) institutionel ejerskabsstruktur viser aktuelle positioner i virksomheden efter institutioner og fonde, samt seneste ændringer i positionsstørrelse. Større aktionærer kan omfatte individuelle investorer, investeringsforeninger, hedgefonde eller institutioner. Skema 13D angiver, at investoren besidder (eller besidder) mere end 5 % af virksomheden og har til hensigt (eller har til hensigt at) aktivt at forfølge en ændring i forretningsstrategi. Skema 13G indikerer en passiv investering på over 5%.
The share price as of March 6, 2026 is 22,00 / share. Previously, on March 10, 2025, the share price was 21,42 / share. This represents an increase of 2,73% over that period.
Fondens stemningsscore
Fund Sentiment Score (fka Ownership Accumulation Score) finder de aktier, der bliver mest købt af fonde. Det er resultatet af en sofistikeret, multi-faktor kvantitativ model, der identificerer virksomheder med de højeste niveauer af institutionel akkumulering. Scoringsmodellen bruger en kombination af den samlede stigning i oplyste ejere, ændringerne i porteføljeallokeringer i disse ejere og andre målinger. Tallet går fra 0 til 100, hvor højere tal indikerer et højere niveau af akkumulering for sine jævnaldrende, og 50 er gennemsnittet.
Opdateringsfrekvens: Dagligt
Se Ownership Explorer, som giver en liste over højest rangerende virksomheder.
AI+ Ask Fintel’s AI assistant about First Trust Exchange-Traded Fund IV - First Trust Long Duration Opportunities ETF.
Select a question to share a public post with an AI-crafted answer.
Thinking of good questions…
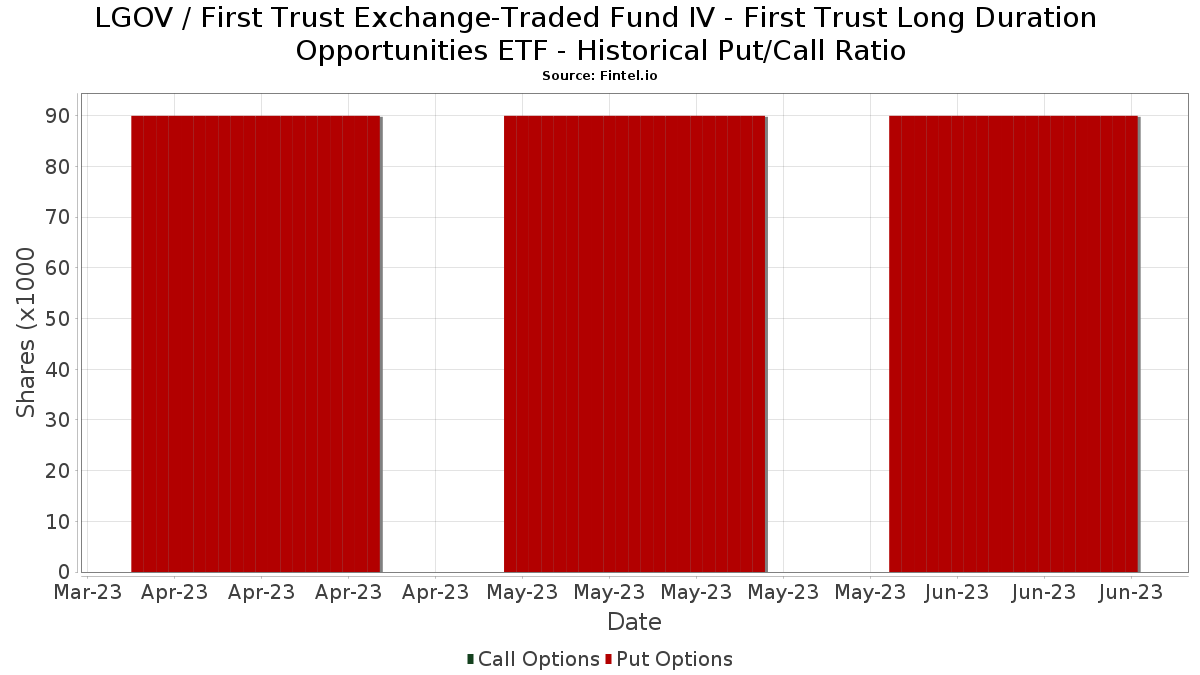
Institutionel Put/Call-forhold
Ud over at indberette standardaktie- og gældsudstedelser skal institutter med mere end 100 mill. aktiver under forvaltning også oplyse deres put- og call-optionsbeholdninger. Da salgsoptioner generelt indikerer negativ stemning, og købsoptioner indikerer positiv stemning, kan vi få en fornemmelse af den overordnede institutionelle stemning ved at plotte forholdet mellem put og kald. Diagrammet til højre viser det historiske put/call-forhold for dette instrument.
Brug af Put/Call Ratio som en indikator for investorernes stemning overvinder en af de vigtigste mangler ved at bruge totalt institutionelt ejerskab, som er, at en betydelig mængde af aktiver under forvaltning investeres passivt for at spore indekser. Passivt forvaltede fonde køber typisk ikke optioner, så indikatoren for put/call-forholdet følger mere nøje følelsen af aktivt forvaltede fonde.
13D/G-arkivering
Vi præsenterer 13D/G ansøgninger separat fra 13F ansøgninger på grund af den forskellige behandling af SEC. 13D/G-ansøgninger kan indgives af grupper af investorer (med én ledende), hvorimod 13F-ansøgninger ikke kan. Dette resulterer i situationer, hvor en investor kan indsende en 13D/G, der rapporterer én værdi for de samlede aktier (der repræsenterer alle de aktier, der ejes af investorgruppen), men derefter indsender en 13F, der rapporterer en anden værdi for de samlede aktier (der udelukkende repræsenterer deres egne) ejendomsret). Det betyder, at aktieejerskab af 13D/G-arkiver og 13F-arkiveringer ofte ikke er direkte sammenlignelige, så vi præsenterer dem separat.
Bemærk: Fra den 16. maj 2021 viser vi ikke længere ejere, der ikke har indsendt en 13D/G inden for det seneste år. Tidligere viste vi den fulde historie af 13D/G-arkiver. Generelt skal enheder, der er forpligtet til at indgive 13D/G-ansøgninger, indgive mindst årligt, før de indsender en afsluttende ansøgning. Dog forlader fonde nogle gange positioner uden at indsende en afsluttende ansøgning (dvs. de afvikler), så visning af den fulde historie resulterede nogle gange i forvirring om det nuværende ejerskab. For at undgå forvirring viser vi nu kun 'aktuelle' ejere - det vil sige - ejere, der har anmeldt inden for det seneste år.
Upgrade to unlock premium data.
| Fil dato | Form | Investor | Forrige Aktier |
Seneste Aktier |
Δ Aktier (Procent) |
Ejendomsret (Procent) |
Δ Ejerskab (Procent) |
|
|---|---|---|---|---|---|---|---|---|
| 2026-01-14 | FIRST TRUST PORTFOLIOS LP | 2,996,543 | 2,624,486 | -12.42 | 8.56 | -16.41 |
13F og NPORT arkivering
Detaljer om 13F-arkivering er gratis. Detaljer om NP-ansøgninger kræver et premium-medlemskab. Grønne rækker angiver nye positioner. Røde rækker angiver lukkede positioner. Klik på linket ikon for at se den fulde transaktionshistorik.
Opgrader
for at låse premium-data op og eksportere til Excel ![]() .
.
| Fil dato | Kilde | Investor | Type | Gennemsnitlig pris (Øst) |
Aktier | Δ Aktier (%) |
Rapporteret Værdi ($1000) |
Δ Værdi (%) |
Port Alloc (%) |
|
|---|---|---|---|---|---|---|---|---|---|---|
| 2026-02-05 | 13F | BlueChip Wealth Advisors LLC | 16.700 | 0,00 | 365 | 0,28 | ||||
| 2026-01-23 | 13F | Farther Finance Advisors, LLC | 247.321 | 3,34 | 5.399 | 3,73 | ||||
| 2026-01-23 | 13F | DHJJ Financial Advisors, Ltd. | 5 | 0,00 | 0 | |||||
| 2026-01-09 | 13F | Marshall Financial Group LLC | 716.276 | 4,14 | 15.636 | 4,53 | ||||
| 2026-01-29 | 13F | Kestra Private Wealth Services, Llc | 32.407 | 8,79 | 707 | 9,27 | ||||
| 2026-02-06 | 13F | Pnc Financial Services Group, Inc. | 18.391 | 3,68 | 401 | 4,16 | ||||
| 2026-01-26 | 13F | AE Wealth Management LLC | 67.159 | -6,57 | 1.466 | -6,21 | ||||
| 2026-02-13 | 13F | Maia Wealth LLC | 35.803 | -16,91 | 794 | -16,07 | ||||
| 2026-02-06 | 13F | Larson Financial Group LLC | 2.200 | -17,57 | 48 | -17,24 | ||||
| 2026-02-14 | 13F | Rockefeller Capital Management L.P. | 26.801 | 1,99 | 585 | 2,45 | ||||
| 2026-02-03 | 13F | International Assets Investment Management, Llc | 1.201 | 26 | ||||||
| 2026-01-14 | 13F | Spire Wealth Management | 16.095 | 0,48 | 351 | 0,86 | ||||
| 2026-01-22 | 13F | Pinnacle Bancorp, Inc. | 3.026 | 310,58 | 66 | 312,50 | ||||
| 2026-02-09 | 13F | Harbour Investments, Inc. | 28.724 | 2,42 | 627 | 2,96 | ||||
| 2026-02-12 | 13F | Rossby Financial, LCC | 17.080 | -2,18 | 373 | -2,36 | ||||
| 2026-02-02 | 13F | Benjamin Edwards Inc | 179.679 | 47,91 | 3.923 | 48,49 | ||||
| 2026-02-11 | 13F | Janney Montgomery Scott LLC | 144.330 | -8,34 | 3 | 0,00 | ||||
| 2026-02-18 | 13F | KKM Financial LLC | 14.314 | 312 | ||||||
| 2026-02-11 | 13F | LPL Financial LLC | 3.889.011 | 11,51 | 84.897 | 11,92 | ||||
| 2026-01-21 | 13F | Sound Income Strategies, LLC | 6.191 | 135 | ||||||
| 2026-01-26 | 13F | Private Trust Co Na | 3.847 | 56,00 | 84 | 56,60 | ||||
| 2026-02-09 | 13F | Prospera Financial Services Inc | 138.769 | 6,76 | 3.029 | 7,18 | ||||
| 2026-01-14 | 13F | Centennial Wealth Advisory LLC | 188.773 | 0,47 | 4.121 | 0,83 | ||||
| 2026-01-26 | 13F | Cwm, Llc | 679 | 0,00 | 0 | |||||
| 2026-02-11 | 13F | Hilton Head Capital Partners, LLC | 22 | 0 | ||||||
| 2026-02-17 | 13F | Signature Equity Partners, LLC | 69 | 2 | ||||||
| 2025-11-07 | 13F | Beacon Capital Management, LLC | 0 | -100,00 | 0 | -100,00 | ||||
| 2026-02-13 | 13F | Smartleaf Asset Management LLC | 124 | -61,85 | 3 | -71,43 | ||||
| 2026-02-17 | 13F | Cetera Investment Advisers | 559.085 | 30,99 | 12.205 | 31,48 | ||||
| 2026-01-30 | 13F | Wagner Wealth Management, Llc | 80 | 1,27 | 2 | 0,00 | ||||
| 2026-02-12 | 13F | Jane Street Group, Llc | 0 | -100,00 | 0 | |||||
| 2025-11-14 | 13F | Susquehanna International Group, Llp | 0 | -100,00 | 0 | |||||
| 2026-02-18 | 13F | GWM Advisors LLC | 218.811 | -2,65 | 4.777 | -2,29 | ||||
| 2026-01-05 | 13F | Park Avenue Securities Llc | 21.122 | 17,23 | 0 | |||||
| 2025-11-14 | 13F | Old Mission Capital Llc | 0 | -100,00 | 0 | |||||
| 2026-01-29 | 13F | Sanctuary Advisors, LLC | 29.930 | 0,60 | 653 | 0,93 | ||||
| 2026-01-21 | 13F | Newbridge Financial Services Group, Inc. | 4.989 | 109 | ||||||
| 2025-11-14 | 13F | Goldman Sachs Group Inc | 0 | -100,00 | 0 | -100,00 | ||||
| 2026-01-29 | 13F | Quest 10 Wealth Builders, Inc. | 1.302 | 0,00 | 28 | 0,00 | ||||
| 2026-02-02 | 13F | Truist Financial Corp | 73.329 | 13,43 | 1.601 | 13,80 | ||||
| 2026-01-06 | 13F | Investors Research Corp | 65.213 | -2,32 | 1.424 | -2,00 | ||||
| 2026-02-13 | 13F | Stifel Financial Corp | 14.296 | 312 | ||||||
| 2026-02-09 | 13F | HBK Sorce Advisory LLC | 14.765 | 0,00 | 324 | -0,92 | ||||
| 2025-11-06 | 13F | Oppenheimer & Co Inc | 0 | -100,00 | 0 | |||||
| 2026-02-04 | 13F | Ameritas Advisory Services, LLC | 0 | -100,00 | 0 | |||||
| 2025-11-13 | 13F | Quadrature Capital Ltd | 0 | -100,00 | 0 | |||||
| 2026-02-09 | 13F | Kingsview Wealth Management, LLC | 310.968 | 378,99 | 6.788 | 380,74 | ||||
| 2026-01-12 | 13F | VisionPoint Advisory Group, LLC | 17.455 | 381 | ||||||
| 2026-01-23 | 13F | Financial Enhancement Group LLC | 773.034 | -27,71 | 16.806 | -28,14 | ||||
| 2026-02-13 | 13F | Kestra Advisory Services, LLC | 0 | -100,00 | 0 | |||||
| 2026-02-09 | 13F | Keating Financial Advisory Services, Inc. | 218 | 5 | ||||||
| 2026-01-20 | 13F | BAM Wealth Management, LLC | 9.795 | 214 | ||||||
| 2026-01-27 | 13F | PFG Advisors | 0 | -100,00 | 0 | -100,00 | ||||
| 2026-02-12 | 13F | StoneX Group Inc. | 0 | -100,00 | 0 | |||||
| 2026-02-17 | 13F | Mpwm Advisory Solutions, Llc | 0 | -100,00 | 0 | |||||
| 2026-01-20 | 13F | American National Bank | 262 | 0,00 | 6 | 0,00 | ||||
| 2026-02-24 | 13F | Anderson Financial Strategies, LLC | 335.797 | 3,61 | 7.330 | 3,99 | ||||
| 2026-02-13 | 13F | First Trust Advisors Lp | 259.278 | 21,82 | 5.660 | 22,27 | ||||
| 2026-02-17 | 13F | Bank Of America Corp /de/ | 0 | -100,00 | 0 | |||||
| 2025-10-16 | 13F | HBW Advisory Services LLC | 0 | -100,00 | 0 | -100,00 | ||||
| 2026-01-20 | 13F | Fundamentun, Llc | 756.610 | 2,91 | 16.517 | 3,29 | ||||
| 2026-02-13 | 13F | Integrated Wealth Concepts LLC | 655.358 | 4,14 | 14.306 | 4,52 | ||||
| 2026-02-17 | 13F | Royal Bank Of Canada | 1.856.245 | 3,91 | 40.521 | 4,29 | ||||
| 2026-01-20 | 13F | AdvisorNet Financial, Inc | 13 | 0,00 | 0 | |||||
| 2026-02-04 | 13F | Tsfg, Llc | 259.713 | 40,02 | 6 | 25,00 | ||||
| 2026-01-21 | 13F | Flagship Harbor Advisors, Llc | 96 | 2 | ||||||
| 2026-02-11 | 13F | Gateway Wealth Partners, LLC | 14.212 | -4,32 | 310 | -4,02 | ||||
| 2026-02-06 | 13F | Envestnet Portfolio Solutions, Inc. | 33.131 | 0,13 | 723 | 0,56 | ||||
| 2026-01-20 | 13F | Arvest Investments, Inc. | 161.565 | -43,29 | 3.527 | -43,09 | ||||
| 2026-02-10 | 13F | Bnp Paribas Arbitrage, Sa | 10 | 0 | ||||||
| 2026-02-17 | 13F | Ameriprise Financial Inc | 14.503 | -1,25 | 317 | -0,94 | ||||
| 2026-02-13 | 13F | Flow Traders U.s. Llc | 39.447 | 1 | ||||||
| 2026-02-13 | 13F | Tcfg Wealth Management, Llc | 78.283 | 0,09 | 1.709 | 0,41 | ||||
| 2026-02-17 | 13F | Gladstone Institutional Advisory LLC | 156.668 | -21,99 | 3.420 | -21,70 | ||||
| 2026-02-12 | 13F | Steward Partners Investment Advisory, Llc | 24.207 | 1,29 | 528 | 1,73 | ||||
| 2026-02-06 | 13F | Cullen/frost Bankers, Inc. | 368 | 1,10 | 8 | 14,29 | ||||
| 2026-02-11 | 13F | Jpmorgan Chase & Co | 16.810 | -1,15 | 367 | -0,81 | ||||
| 2026-01-21 | 13F | Walkner Condon Financial Advisors LLC | 842.312 | 24,35 | 18.388 | 24,81 | ||||
| 2026-02-06 | 13F | HighTower Advisors, LLC | 369.993 | -39,50 | 8.077 | -39,28 | ||||
| 2026-02-13 | 13F | Morgan Stanley | 1.224.161 | 4,83 | 26.723 | 5,21 | ||||
| 2026-01-15 | 13F | SILVER OAK SECURITIES, Inc | 40.080 | 1,45 | 880 | 2,33 | ||||
| 2026-02-10 | 13F | Bank of New York Mellon Corp | 60.096 | -4,01 | 1.312 | -3,67 | ||||
| 2025-11-13 | 13F | UBS Group AG | 0 | -100,00 | 0 | |||||
| 2026-01-29 | 13F | Nbc Securities, Inc. | 723 | 0,00 | 16 | 0,00 | ||||
| 2026-02-10 | 13F | IFG Advisory, LLC | 60.440 | 1.319 | ||||||
| 2026-02-13 | 13F | Pine Valley Investments Ltd Liability Co | 10.710 | 15,29 | 234 | 15,35 | ||||
| 2026-02-05 | 13F | Tucker Asset Management Llc | 5.016 | -30,76 | 109 | -30,57 | ||||
| 2025-10-22 | 13F | CoreCap Advisors, LLC | 0 | -100,00 | 0 | |||||
| 2026-01-29 | 13F | Concurrent Investment Advisors, LLC | 564.951 | 1.085,18 | 12.333 | 1.090,35 | ||||
| 2025-09-26 | NP | LMBS - First Trust Low Duration Opportunities ETF This fund is a listed as child fund of First Trust Advisors Lp and if that institution has disclosed ownership in this security, then these positions will not be double counted when calculating total shares and total value | 73.956 | 0,00 | 1.565 | -1,94 | ||||
| 2026-01-20 | 13F | Accel Wealth Management | 72.293 | 16,07 | 1.578 | 16,54 | ||||
| 2026-01-20 | 13F | Midwest Financial Group LLC | 121.514 | 33,53 | 2.653 | 34,01 | ||||
| 2026-01-28 | 13F | Geneos Wealth Management Inc. | 7.935 | 10,44 | 173 | 10,90 | ||||
| 2026-02-03 | 13F | We Are One Seven, LLC | 83.349 | 1.820 | ||||||
| 2026-02-12 | 13F | Brinker Capital Investments, LLC | 52.752 | 2,92 | 1.152 | 3,32 | ||||
| 2026-02-05 | 13F | Atria Investments Llc | 17.894 | 6,44 | 391 | 6,85 | ||||
| 2026-02-11 | 13F | Ameritas Investment Partners, Inc. | 44.184 | 965 | ||||||
| 2026-02-04 | 13F | Pensionmark Financial Group, Llc | 10.329 | 87 | ||||||
| 2026-02-10 | 13F | Envestnet Asset Management Inc | 720.153 | 6,13 | 15.721 | 6,51 | ||||
| 2026-02-17 | 13F | LaSalle St. Investment Advisors, LLC | 25.506 | -0,92 | 1 | |||||
| 2026-02-03 | 13F | RFG Advisory, LLC | 21.128 | 3,48 | 461 | 3,83 | ||||
| 2026-02-05 | 13F | Cambridge Investment Research Advisors, Inc. | 781.716 | -3,07 | 17 | 0,00 | ||||
| 2026-02-05 | 13F | Stephens Inc /ar/ | 671.371 | 2,95 | 14.656 | 3,33 | ||||
| 2026-02-17 | 13F | Advisory Services Network, LLC | 0 | -100,00 | 0 | |||||
| 2026-02-17 | 13F | Wiley Bros.-aintree Capital, Llc | 221.203 | -1,36 | 4.829 | -1,09 | ||||
| 2026-02-05 | 13F | Allworth Financial LP | 934 | 0,97 | 20 | 0,00 | ||||
| 2026-02-17 | 13F | Wealth Watch Advisors, INC | 3.135 | -0,70 | 68 | 0,00 | ||||
| 2026-02-06 | 13F | Lloyd Advisory Services, LLC. | 4 | 0 | ||||||
| 2026-01-27 | 13F | Belpointe Asset Management LLC | 29.883 | -22,12 | 652 | -21,82 | ||||
| 2025-10-21 | 13F | Brookwood Investment Group LLC | 0 | -100,00 | 0 | |||||
| 2026-02-03 | 13F | Fsb Premier Wealth Management, Inc. | 134.420 | 4,42 | 2.934 | 4,82 | ||||
| 2026-01-21 | 13F | Capital Investment Advisory Services, LLC | 22 | 0 | ||||||
| 2025-11-10 | 13F | IFS Group,LLC | 16.197 | 354 | ||||||
| 2026-02-17 | 13F | Pinnacle Family Advisors, LLC | 30.371 | -1,82 | 663 | -1,49 | ||||
| 2026-02-17 | 13F | Advisor Group Holdings, Inc. | 144.247 | -51,76 | 3.149 | -51,10 | ||||
| 2026-02-06 | 13F | Creative Financial Designs Inc /adv | 1.407 | 0,14 | 31 | 0,00 | ||||
| 2026-02-18 | 13F | Pacific Excel Wealth Advisors, Inc. | 14.002 | 306 | ||||||
| 2026-02-17 | 13F | Equitable Holdings, Inc. | 14.010 | 306 | ||||||
| 2025-11-12 | 13F | Transce3nd, LLC | 0 | -100,00 | 0 | |||||
| 2026-01-27 | 13F | Fortis Capital Advisors, LLC | 29.883 | -22,12 | 652 | -21,82 | ||||
| 2026-02-05 | 13F | Western Wealth Management, LLC | 30.136 | 14,29 | 658 | 14,66 | ||||
| 2026-01-07 | 13F | Holistic Financial Partners | 152.141 | 4,73 | 3.321 | 5,13 | ||||
| 2026-02-06 | 13F | IFP Advisors, Inc | 30.972 | -6,24 | 676 | -5,85 | ||||
| 2026-02-12 | 13F | Commonwealth Equity Services, Llc | 50.232 | -90,47 | 1.097 | 9.863,64 | ||||
| 2026-02-12 | 13F | Principal Securities, Inc. | 16.548 | 2,90 | 361 | 3,44 | ||||
| 2026-02-13 | 13F | Ambassador Advisors, LLC | 11.948 | 261 | ||||||
| 2026-01-26 | 13F | Iams Wealth Management, Llc | 100.328 | 90,67 | 2.190 | 91,43 | ||||
| 2026-01-30 | 13F | Sigma Planning Corp | 0 | -100,00 | 0 | |||||
| 2026-02-10 | 13F | Tidemark, LLC | 566.126 | 12.359 | ||||||
| 2026-01-26 | 13F | Ferguson Shapiro LLC | 0 | -100,00 | 0 | |||||
| 2026-01-20 | 13F | Wealth Management Associates, Inc. | 10.165 | 0,00 | 222 | 0,00 | ||||
| 2026-02-17 | 13F | Citadel Advisors Llc | 34.253 | -70,82 | 748 | -70,73 | ||||
| 2026-02-10 | 13F | Root Financial Partners, LLC | 175 | 0,00 | 4 | 0,00 | ||||
| 2026-02-17 | 13F | Raymond James Financial Inc | 1.255.655 | -25,18 | 27.411 | -24,91 | ||||
| 2026-02-02 | 13F | GDS Wealth Management | 1.045.275 | -2,47 | 22.818 | -2,11 | ||||
| 2026-02-10 | 13F | Comprehensive Wealth Management, LLC | 1.142.264 | -21,29 | 24.936 | -21,01 | ||||
| 2025-09-26 | NP | HISF - First Trust Strategic Income ETF This fund is a listed as child fund of First Trust Advisors Lp and if that institution has disclosed ownership in this security, then these positions will not be double counted when calculating total shares and total value | 119.554 | -26,16 | 2.530 | -27,61 | ||||
| 2026-02-13 | 13F | Wells Fargo & Company/mn | 9.535 | 1,52 | 208 | 1,96 | ||||
| 2025-10-14 | 13F | Private Client Services, Llc | 0 | -100,00 | 0 | |||||
| 2026-01-29 | 13F | Comerica Bank | 972 | -75,32 | 21 | -75,29 | ||||
| 2025-11-13 | 13F | GeoWealth Management, LLC | 0 | -100,00 | 0 | |||||
| 2025-10-17 | 13F | Apollon Wealth Management, LLC | 0 | -100,00 | 0 | -100,00 | ||||
| 2026-02-05 | 13F | Sequent Planning LLC | 124.471 | -2,58 | 2.717 | -2,20 | ||||
| 2026-02-13 | 13F | SRS Capital Advisors, Inc. | 33.885 | 740 | ||||||
| 2026-02-17 | 13F | Ameriflex Group, Inc. | 69 | -50,00 | 2 | -66,67 | ||||
| 2026-02-06 | 13F | Global Retirement Partners, LLC | 2.330 | -79,91 | 51 | -80,16 | ||||
| 2026-01-21 | 13F | Raleigh Capital Management Inc. | 1.467 | 1,03 | 32 | 3,23 | ||||
| 2026-01-21 | 13F | MBE Wealth Management, LLC | 10.149 | 0,00 | 222 | 0,45 | ||||
| 2026-01-30 | 13F | Us Bancorp \de\ | 19.051 | 27,78 | 416 | 28,09 | ||||
| 2026-02-03 | 13F | Legacy Wealth Managment, LLC/ID | 566 | 0,00 | 12 | 0,00 | ||||
| 2025-11-13 | 13F | Visionary Wealth Advisors | 0 | -100,00 | 0 | |||||
| 2026-01-16 | 13F | Perigon Wealth Management, LLC | 13.795 | 10,26 | 301 | 10,66 | ||||
| 2026-02-17 | 13F | Snowden Capital Advisors LLC | 38.377 | -1,02 | 838 | -0,71 | ||||
| 2026-02-17 | 13F | Coppell Advisory Solutions LLC | 25.487 | 9,43 | 559 | 10,26 | ||||
| 2026-02-13 | 13F | Asset Allocation Strategies LLC | 13.059 | 8,92 | 285 | 9,62 | ||||
| 2026-02-13 | 13F | Mml Investors Services, Llc | 18.786 | 10,41 | 410 | 10,81 | ||||
| 2026-02-06 | 13F | Csenge Advisory Group | 974.216 | 6,18 | 21.267 | 6,57 | ||||
| 2026-02-13 | 13F | Centaurus Financial, Inc. | 9.252 | 89,98 | 0 | |||||
| 2026-02-05 | 13F | Park Square Financial Group, LLC | 20.732 | -39,98 | 432 | -42,48 | ||||
| 2026-02-17 | 13F | Integrated Advisors Network LLC | 18.706 | -26,03 | 408 | -25,82 | ||||
| 2026-01-23 | 13F | Assetmark, Inc | 88.612 | -8,57 | 1.934 | -8,21 |