Grundlæggende statistik
| Institutionelle ejere | 79 total, 78 long only, 0 short only, 1 long/short - change of 6,76% MRQ |
| Gennemsnitlig porteføljeallokering | 0.1228 % - change of -10,13% MRQ |
| Institutionelle aktier (lange) | 6.151.241 (ex 13D/G) - change of -0,64MM shares -9,37% MRQ |
| Institutionel værdi (lang) | $ 81.226 USD ($1000) |
Institutionelt ejerskab og aktionærer
Invesco Exchange-Traded Fund Trust II - Invesco KBW High Dividend Yield Financial ETF (US:KBWD) har 79 institutionelle ejere og aktionærer, der har indsendt 13D/G- eller 13F-formularer til Securities Exchange Commission (SEC). Disse institutioner har i alt 6,151,241 aktier. Største aktionærer omfatter LPL Financial LLC, Morgan Stanley, Mission Hills Financial Advisory, LLC, Bank Of America Corp /de/, Wells Fargo & Company/mn, Gradient Investments LLC, ERNZ - TrueShares Active Yield ETF, Raymond James Financial Inc, UBS Group AG, and Commonwealth Equity Services, Llc .
Invesco Exchange-Traded Fund Trust II - Invesco KBW High Dividend Yield Financial ETF (NasdaqGM:KBWD) institutionel ejerskabsstruktur viser aktuelle positioner i virksomheden efter institutioner og fonde, samt seneste ændringer i positionsstørrelse. Større aktionærer kan omfatte individuelle investorer, investeringsforeninger, hedgefonde eller institutioner. Skema 13D angiver, at investoren besidder (eller besidder) mere end 5 % af virksomheden og har til hensigt (eller har til hensigt at) aktivt at forfølge en ændring i forretningsstrategi. Skema 13G indikerer en passiv investering på over 5%.
The share price as of September 12, 2025 is 14,11 / share. Previously, on September 13, 2024, the share price was 15,37 / share. This represents a decline of 8,20% over that period.

Fondens stemningsscore
Fund Sentiment Score (fka Ownership Accumulation Score) finder de aktier, der bliver mest købt af fonde. Det er resultatet af en sofistikeret, multi-faktor kvantitativ model, der identificerer virksomheder med de højeste niveauer af institutionel akkumulering. Scoringsmodellen bruger en kombination af den samlede stigning i oplyste ejere, ændringerne i porteføljeallokeringer i disse ejere og andre målinger. Tallet går fra 0 til 100, hvor højere tal indikerer et højere niveau af akkumulering for sine jævnaldrende, og 50 er gennemsnittet.
Opdateringsfrekvens: Dagligt
Se Ownership Explorer, som giver en liste over højest rangerende virksomheder.
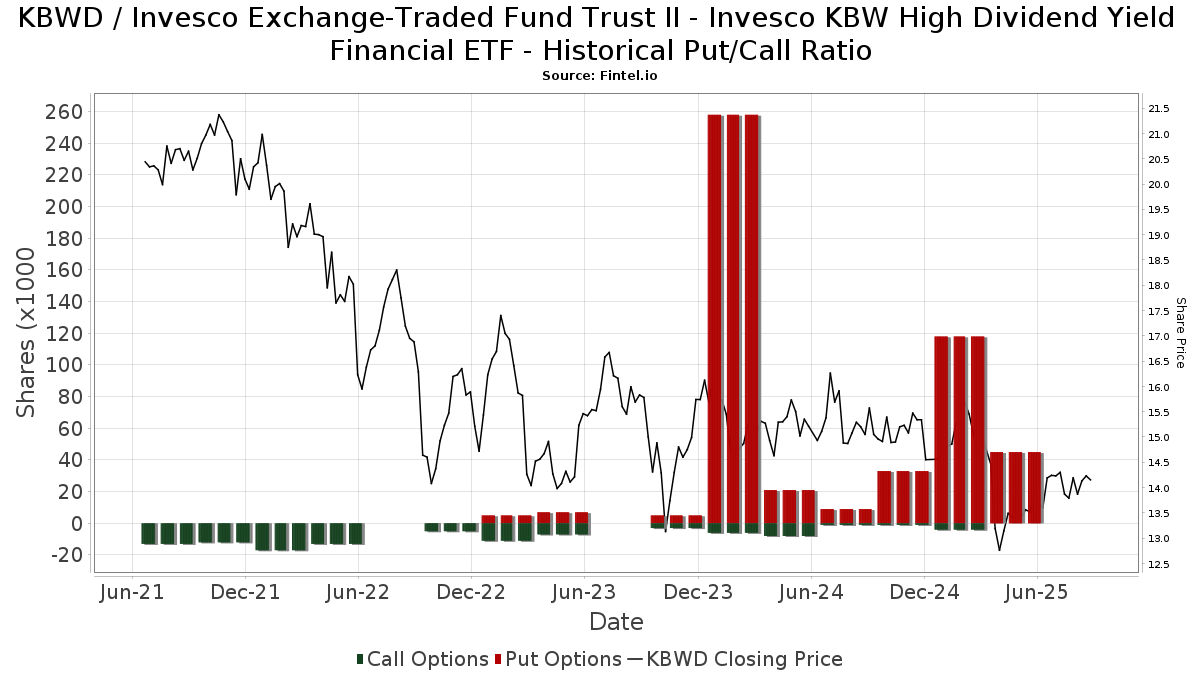
Institutionel Put/Call-forhold
Ud over at indberette standardaktie- og gældsudstedelser skal institutter med mere end 100 mill. aktiver under forvaltning også oplyse deres put- og call-optionsbeholdninger. Da salgsoptioner generelt indikerer negativ stemning, og købsoptioner indikerer positiv stemning, kan vi få en fornemmelse af den overordnede institutionelle stemning ved at plotte forholdet mellem put og kald. Diagrammet til højre viser det historiske put/call-forhold for dette instrument.
Brug af Put/Call Ratio som en indikator for investorernes stemning overvinder en af de vigtigste mangler ved at bruge totalt institutionelt ejerskab, som er, at en betydelig mængde af aktiver under forvaltning investeres passivt for at spore indekser. Passivt forvaltede fonde køber typisk ikke optioner, så indikatoren for put/call-forholdet følger mere nøje følelsen af aktivt forvaltede fonde.
13F og NPORT arkivering
Detaljer om 13F-arkivering er gratis. Detaljer om NP-ansøgninger kræver et premium-medlemskab. Grønne rækker angiver nye positioner. Røde rækker angiver lukkede positioner. Klik på linket ikon for at se den fulde transaktionshistorik.
Opgrader
for at låse premium-data op og eksportere til Excel ![]() .
.
| Fil dato | Kilde | Investor | Type | Gennemsnitlig pris (Øst) |
Aktier | Δ Aktier (%) |
Rapporteret Værdi ($1000) |
Δ Værdi (%) |
Port Alloc (%) |
|
|---|---|---|---|---|---|---|---|---|---|---|
| 2025-07-08 | 13F | Gradient Investments LLC | 523.842 | 8,31 | 7.266 | 3,96 | ||||
| 2025-08-15 | 13F | Tower Research Capital LLC (TRC) | 24.236 | 336 | ||||||
| 2025-08-14 | 13F | Raymond James Financial Inc | 161.894 | 229,26 | 2.245 | 216,20 | ||||
| 2025-07-17 | 13F | Janney Montgomery Scott LLC | 16.260 | -5,85 | 0 | |||||
| 2025-08-07 | 13F | Parkside Financial Bank & Trust | 0 | -100,00 | 0 | |||||
| 2025-08-01 | 13F | Rossby Financial, LCC | 1.631 | 0,00 | 23 | 4,76 | ||||
| 2025-08-12 | 13F | Founders Financial Alliance, LLC | 7.520 | 0,00 | 104 | -3,70 | ||||
| 2025-07-21 | 13F | Ameritas Advisory Services, LLC | 3.611 | 50 | ||||||
| 2025-07-25 | 13F | We Are One Seven, LLC | 10.716 | 0,00 | 149 | -3,90 | ||||
| 2025-08-14 | 13F | Bnp Paribas Arbitrage, Sa | 22 | 0 | ||||||
| 2025-08-14 | 13F | Qube Research & Technologies Ltd | 582 | 8 | ||||||
| 2025-08-14 | 13F | Wiley Bros.-aintree Capital, Llc | 10.121 | 0,01 | 140 | -3,45 | ||||
| 2025-08-05 | 13F | Simplex Trading, Llc | 2.986 | 0 | ||||||
| 2025-08-12 | 13F | Global Retirement Partners, LLC | 727 | -11,34 | 10 | -16,67 | ||||
| 2025-08-12 | 13F | Change Path, LLC | 14.330 | -50,60 | 199 | -52,74 | ||||
| 2025-08-14 | 13F | Mml Investors Services, Llc | 28.716 | 4,55 | 0 | |||||
| 2025-08-12 | 13F | BlackRock, Inc. | 1.325 | 0,00 | 18 | -5,26 | ||||
| 2025-05-15 | 13F | Talon Private Wealth, LLC | 0 | -100,00 | 0 | -100,00 | ||||
| 2025-07-28 | 13F | Harbour Investments, Inc. | 1.074 | 15 | ||||||
| 2025-08-04 | 13F | Adell Harriman & Carpenter Inc | 13.000 | -18,75 | 180 | -22,08 | ||||
| 2025-08-06 | 13F | Commonwealth Equity Services, Llc | 115.799 | -11,07 | 2 | 0,00 | ||||
| 2025-08-15 | 13F | Morgan Stanley | 858.980 | -7,70 | 11.914 | -11,40 | ||||
| 2025-08-14 | 13F | UBS Group AG | 140.165 | 2,68 | 1.944 | -1,42 | ||||
| 2025-08-08 | 13F | Capital Investment Advisory Services, LLC | 1.812 | 25 | ||||||
| 2025-07-30 | 13F | IMG Wealth Management, Inc. | 1.362 | 13,22 | 19 | 5,88 | ||||
| 2025-04-22 | 13F | Castleview Partners, Llc | 0 | -100,00 | 0 | |||||
| 2025-08-14 | 13F | Comerica Bank | 7.564 | -15,84 | 105 | -19,38 | ||||
| 2025-08-13 | 13F | EverSource Wealth Advisors, LLC | 590 | 0,00 | 8 | 0,00 | ||||
| 2025-05-12 | 13F | Providence First Trust Co | 0 | -100,00 | 0 | |||||
| 2025-08-04 | 13F | Kovack Advisors, Inc. | 12.080 | 0,00 | 168 | -4,02 | ||||
| 2025-05-12 | 13F | National Bank Of Canada /fi/ | 0 | -100,00 | 0 | -100,00 | ||||
| 2025-08-14 | 13F | Two Sigma Investments, Lp | 0 | -100,00 | 0 | |||||
| 2025-07-23 | 13F | Kingswood Wealth Advisors, Llc | 42.441 | 47,64 | 589 | 41,69 | ||||
| 2025-08-08 | 13F | Advyzon Investment Management, LLC | 10.838 | 3,26 | 150 | -0,66 | ||||
| 2025-08-13 | 13F | GeoWealth Management, LLC | 0 | -100,00 | 0 | |||||
| 2025-07-25 | 13F | Cwm, Llc | 28.846 | 3,90 | 0 | |||||
| 2025-07-11 | 13F | Farther Finance Advisors, LLC | 10.181 | 7,59 | 141 | 2,92 | ||||
| 2025-07-29 | 13F | TrueMark Investments, LLC | 0 | -100,00 | 0 | |||||
| 2025-08-14 | 13F | MGB Wealth Management, LLC | 275 | -26,67 | 4 | -40,00 | ||||
| 2025-08-12 | 13F | Waterloo Capital, L.P. | 27.719 | 0,00 | 384 | -4,00 | ||||
| 2025-08-14 | 13F | Citadel Advisors Llc | Put | 45.700 | -61,27 | 634 | -62,87 | |||
| 2025-07-25 | 13F | Atria Wealth Solutions, Inc. | 54.812 | 10,46 | 760 | 6,00 | ||||
| 2025-08-14 | 13F | Citadel Advisors Llc | 13.458 | 58,03 | 187 | 51,22 | ||||
| 2025-08-14 | 13F | Mpwm Advisory Solutions, Llc | 5.600 | 0,00 | 78 | -3,75 | ||||
| 2025-07-24 | 13F | IFP Advisors, Inc | 19.628 | 9,07 | 272 | 4,62 | ||||
| 2025-08-12 | 13F | Jpmorgan Chase & Co | 14.479 | -13,92 | 201 | -17,70 | ||||
| 2025-08-06 | 13F | AE Wealth Management LLC | 1.313 | -0,15 | 18 | -5,26 | ||||
| 2025-07-09 | 13F | Triumph Capital Management | 41.785 | 9,67 | 580 | 5,27 | ||||
| 2025-09-04 | 13F/A | Advisor Group Holdings, Inc. | 35.767 | -14,96 | 496 | -18,29 | ||||
| 2025-05-08 | NP | QALTX - Quantified Alternative Investment Fund Investor Class Shares | 0 | -100,00 | 0 | -100,00 | ||||
| 2025-07-25 | 13F | Endowment Wealth Management, Inc. | 41.152 | 13,63 | 571 | 8,99 | ||||
| 2025-08-13 | 13F | Rsm Us Wealth Management Llc | 45.714 | -20,90 | 634 | -24,07 | ||||
| 2025-07-30 | 13F | Brookstone Capital Management | 30.419 | -17,19 | 422 | -20,57 | ||||
| 2025-08-14 | 13F | GWM Advisors LLC | 756 | 1,20 | 10 | 0,00 | ||||
| 2025-08-14 | 13F | Smartleaf Asset Management LLC | 800 | 11 | ||||||
| 2025-05-08 | 13F | Us Bancorp \de\ | 0 | -100,00 | 0 | |||||
| 2025-08-14 | 13F | Wells Fargo & Company/mn | 529.778 | -48,95 | 7.348 | -51,00 | ||||
| 2025-07-29 | 13F | Stratos Wealth Partners, LTD. | 10.083 | 140 | ||||||
| 2025-08-14 | 13F/A | Rockefeller Capital Management L.P. | 35.665 | 3,38 | 495 | -0,80 | ||||
| 2025-04-22 | 13F | Prairie Wealth Advisors, Inc. | 0 | -100,00 | 0 | -100,00 | ||||
| 2025-08-08 | 13F | Avantax Advisory Services, Inc. | 14.456 | 4,88 | 201 | 0,50 | ||||
| 2025-08-08 | 13F | Pnc Financial Services Group, Inc. | 93.300 | 0,00 | 1.294 | -4,01 | ||||
| 2025-08-13 | 13F | Jones Financial Companies Lllp | 200 | 0,00 | 3 | 0,00 | ||||
| 2025-08-14 | 13F | Harvest Investment Services, LLC | 64.260 | 1,10 | 891 | -2,94 | ||||
| 2025-08-14 | 13F | Jane Street Group, Llc | 37.108 | 515 | ||||||
| 2025-07-10 | 13F | Oliver Lagore Vanvalin Investment Group | 2.400 | 0,00 | 35 | -2,86 | ||||
| 2025-05-09 | 13F | TD Waterhouse Canada Inc. | 0 | -100,00 | 0 | |||||
| 2025-07-16 | 13F | ORG Partners LLC | 0 | -100,00 | 0 | |||||
| 2025-05-06 | 13F | Advisors Preferred, LLC | 0 | -100,00 | 0 | |||||
| 2025-07-31 | 13F | Cambridge Investment Research Advisors, Inc. | 110.874 | 4,23 | 2 | 0,00 | ||||
| 2025-08-05 | 13F | Tsfg, Llc | 1.200 | 0,00 | 0 | |||||
| 2025-08-15 | 13F | WFA of San Diego, LLC | 2.400 | -48,11 | 33 | -52,86 | ||||
| 2025-07-21 | 13F | DHJJ Financial Advisors, Ltd. | 23 | 0,00 | 0 | |||||
| 2025-08-12 | 13F | LPL Financial LLC | 925.509 | 8,16 | 12.837 | 3,82 | ||||
| 2025-08-11 | 13F | Citigroup Inc | 800 | 0,00 | 11 | 0,00 | ||||
| 2025-08-11 | 13F | Principal Securities, Inc. | 87 | -64,49 | 1 | -66,67 | ||||
| 2025-07-28 | 13F | Mission Hills Financial Advisory, LLC | 649.190 | 22,95 | 9.004 | 18,02 | ||||
| 2025-08-14 | 13F | Citadel Advisors Llc | Call | 0 | -100,00 | 0 | ||||
| 2025-08-14 | 13F | CoreCap Advisors, LLC | 4.500 | 0,00 | 62 | -4,62 | ||||
| 2025-08-18 | 13F | Geneos Wealth Management Inc. | 138 | 0,00 | 2 | 0,00 | ||||
| 2025-08-08 | 13F | Good Life Advisors, LLC | 29.442 | 57,64 | 408 | 51,67 | ||||
| 2025-08-15 | 13F | Equitable Holdings, Inc. | 85.878 | 33,23 | 1.191 | 27,93 | ||||
| 2025-05-15 | 13F | Bnp Paribas | 0 | -100,00 | 0 | |||||
| 2025-07-17 | 13F | Sound Income Strategies, LLC | 100 | 0,00 | 1 | 0,00 | ||||
| 2025-08-14 | 13F | Royal Bank Of Canada | 18.818 | 9,78 | 261 | 5,24 | ||||
| 2025-04-09 | 13F | RFG Advisory, LLC | 0 | -100,00 | 0 | |||||
| 2025-08-14 | 13F | Fmr Llc | 226 | -55,95 | 3 | -57,14 | ||||
| 2025-08-08 | 13F | Cetera Investment Advisers | 47.041 | 39,85 | 652 | 34,16 | ||||
| 2025-05-14 | 13F | Northwestern Mutual Wealth Management Co | 0 | -100,00 | 0 | |||||
| 2025-08-12 | 13F | Proequities, Inc. | 0 | 0 | ||||||
| 2025-08-19 | 13F | National Asset Management, Inc. | 24.646 | 342 | ||||||
| 2025-07-29 | 13F | Koshinski Asset Management, Inc. | 18.221 | -0,26 | 253 | -4,18 | ||||
| 2025-07-29 | 13F | Mattson Financial Services, LLC | 0 | -100,00 | 0 | |||||
| 2025-07-29 | 13F | Private Trust Co Na | 651 | 0,00 | 9 | 0,00 | ||||
| 2025-07-30 | 13F | Cullen/frost Bankers, Inc. | 36.861 | -3,88 | 511 | -7,76 | ||||
| 2025-05-30 | NP | ERNZ - TrueShares Active Yield ETF | 280.134 | 4.048 | ||||||
| 2025-08-08 | 13F | Thrive Capital Management, LLC | 80.795 | 1.121 | ||||||
| 2025-08-04 | 13F | Integrity Alliance, Llc. | 0 | -100,00 | 0 | |||||
| 2025-08-14 | 13F | Bank Of America Corp /de/ | 543.336 | -9,43 | 7.536 | -13,06 | ||||
| 2025-08-01 | 13F | Envestnet Asset Management Inc | 32.298 | 212,30 | 448 | 200,00 | ||||
| 2025-08-12 | 13F | Winnow Wealth Llc | 0 | -100,00 | 0 | -100,00 | ||||
| 2025-05-13 | 13F | Russell Investments Group, Ltd. | 0 | -100,00 | 0 | |||||
| 2025-07-14 | 13F | U.S. Capital Wealth Advisors, LLC | 83.895 | -0,30 | 1.164 | -4,28 |