Grundlæggende statistik
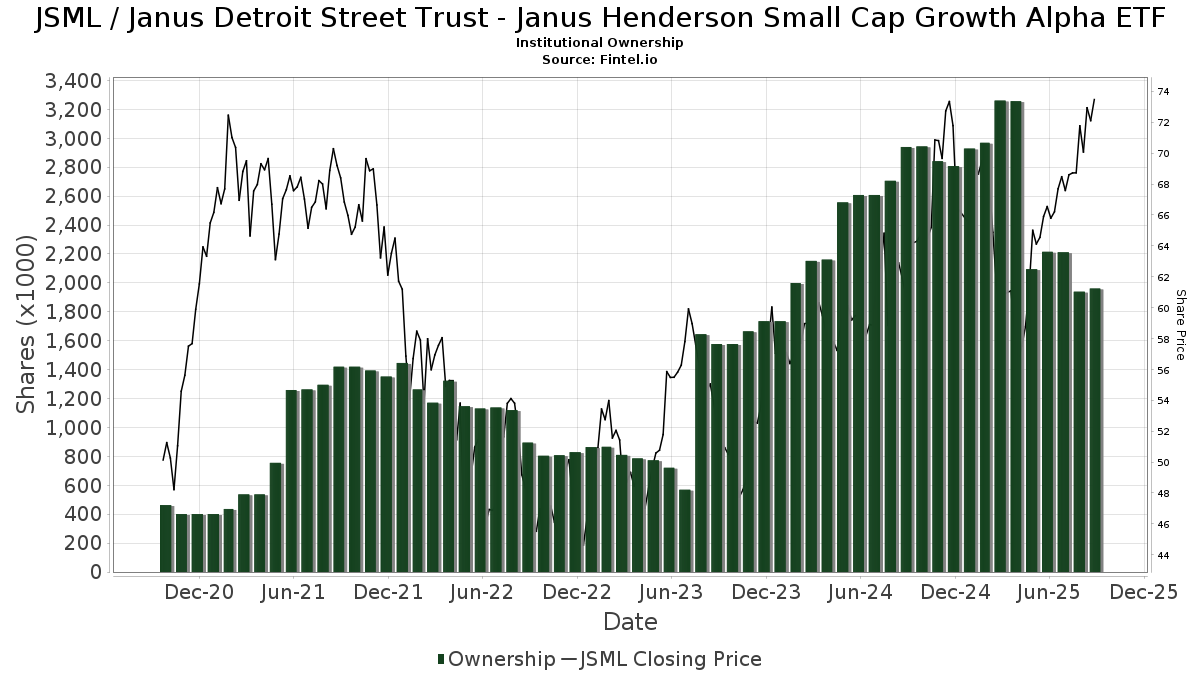
| Institutionelle ejere | 71 total, 71 long only, 0 short only, 0 long/short - change of -4,00% MRQ |
| Gennemsnitlig porteføljeallokering | 0.1769 % - change of 1,68% MRQ |
| Institutionelle aktier (lange) | 1.961.317 (ex 13D/G) - change of -0,25MM shares -11,35% MRQ |
| Institutionel værdi (lang) | $ 102.080 USD ($1000) |
Institutionelt ejerskab og aktionærer
Janus Detroit Street Trust - Janus Henderson Small Cap Growth Alpha ETF (US:JSML) har 71 institutionelle ejere og aktionærer, der har indsendt 13D/G- eller 13F-formularer til Securities Exchange Commission (SEC). Disse institutioner har i alt 1,961,317 aktier. Største aktionærer omfatter Cwm, Llc, Raymond James Financial Inc, LPL Financial LLC, Great Valley Advisor Group, Inc., Commonwealth Equity Services, Llc, Cambridge Investment Research Advisors, Inc., Royal Bank Of Canada, Northern Lights Fund Trust - PFG Janus Henderson(R) Balanced Strategy Class R Shares, Private Advisor Group, LLC, and Triangle Securities Wealth Management .
Janus Detroit Street Trust - Janus Henderson Small Cap Growth Alpha ETF (NasdaqGM:JSML) institutionel ejerskabsstruktur viser aktuelle positioner i virksomheden efter institutioner og fonde, samt seneste ændringer i positionsstørrelse. Større aktionærer kan omfatte individuelle investorer, investeringsforeninger, hedgefonde eller institutioner. Skema 13D angiver, at investoren besidder (eller besidder) mere end 5 % af virksomheden og har til hensigt (eller har til hensigt at) aktivt at forfølge en ændring i forretningsstrategi. Skema 13G indikerer en passiv investering på over 5%.
The share price as of September 12, 2025 is 74,74 / share. Previously, on September 12, 2024, the share price was 61,57 / share. This represents an increase of 21,39% over that period.
Fondens stemningsscore
Fund Sentiment Score (fka Ownership Accumulation Score) finder de aktier, der bliver mest købt af fonde. Det er resultatet af en sofistikeret, multi-faktor kvantitativ model, der identificerer virksomheder med de højeste niveauer af institutionel akkumulering. Scoringsmodellen bruger en kombination af den samlede stigning i oplyste ejere, ændringerne i porteføljeallokeringer i disse ejere og andre målinger. Tallet går fra 0 til 100, hvor højere tal indikerer et højere niveau af akkumulering for sine jævnaldrende, og 50 er gennemsnittet.
Opdateringsfrekvens: Dagligt
Se Ownership Explorer, som giver en liste over højest rangerende virksomheder.
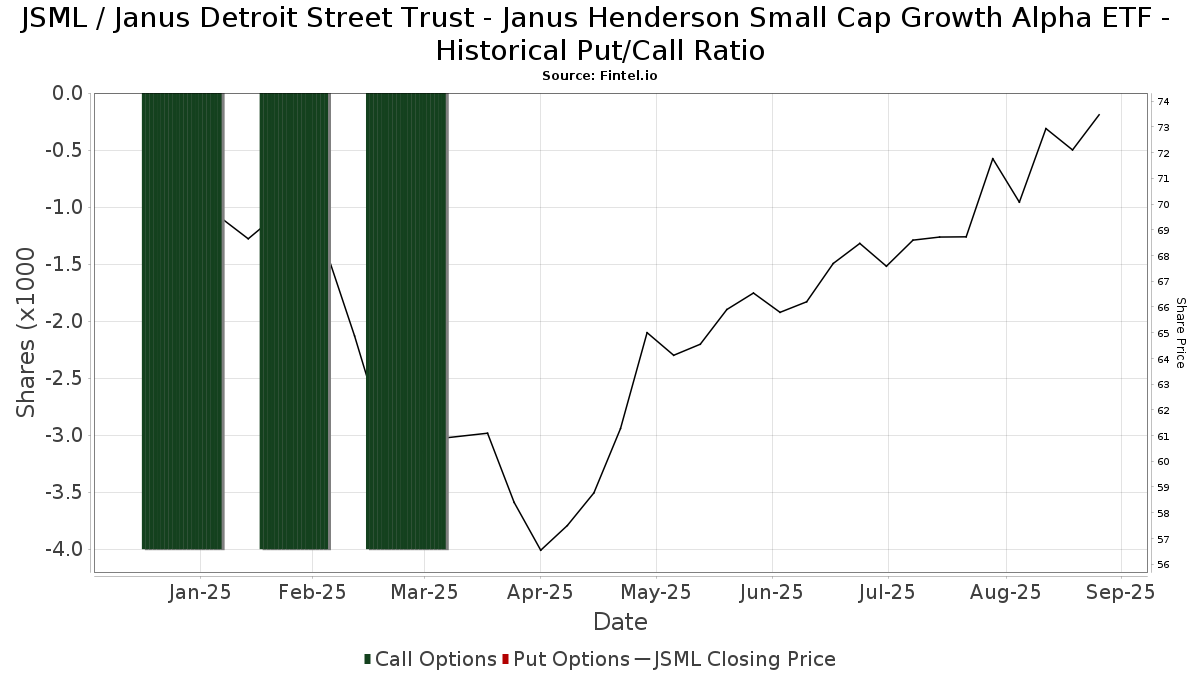
Institutionel Put/Call-forhold
Ud over at indberette standardaktie- og gældsudstedelser skal institutter med mere end 100 mill. aktiver under forvaltning også oplyse deres put- og call-optionsbeholdninger. Da salgsoptioner generelt indikerer negativ stemning, og købsoptioner indikerer positiv stemning, kan vi få en fornemmelse af den overordnede institutionelle stemning ved at plotte forholdet mellem put og kald. Diagrammet til højre viser det historiske put/call-forhold for dette instrument.
Brug af Put/Call Ratio som en indikator for investorernes stemning overvinder en af de vigtigste mangler ved at bruge totalt institutionelt ejerskab, som er, at en betydelig mængde af aktiver under forvaltning investeres passivt for at spore indekser. Passivt forvaltede fonde køber typisk ikke optioner, så indikatoren for put/call-forholdet følger mere nøje følelsen af aktivt forvaltede fonde.
13F og NPORT arkivering
Detaljer om 13F-arkivering er gratis. Detaljer om NP-ansøgninger kræver et premium-medlemskab. Grønne rækker angiver nye positioner. Røde rækker angiver lukkede positioner. Klik på linket ikon for at se den fulde transaktionshistorik.
Opgrader
for at låse premium-data op og eksportere til Excel ![]() .
.
| Fil dato | Kilde | Investor | Type | Gennemsnitlig pris (Øst) |
Aktier | Δ Aktier (%) |
Rapporteret Værdi ($1000) |
Δ Værdi (%) |
Port Alloc (%) |
|
|---|---|---|---|---|---|---|---|---|---|---|
| 2025-08-14 | 13F | Glen Eagle Advisors, LLC | 42 | 0,00 | 3 | 0,00 | ||||
| 2025-04-15 | 13F | Wealthcare Advisory Partners LLC | 0 | -100,00 | 0 | |||||
| 2025-08-14 | 13F | Janus Henderson Group Plc | 9.649 | -4,49 | 651 | 8,33 | ||||
| 2025-08-14 | 13F | Raymond James Financial Inc | 181.789 | -0,72 | 12.262 | 10,02 | ||||
| 2025-08-14 | 13F | Bank Of America Corp /de/ | 14.028 | -38,73 | 946 | -32,09 | ||||
| 2025-07-17 | 13F | KWB Wealth | 6.215 | -0,46 | 378 | -7,58 | ||||
| 2025-07-10 | 13F | Redhawk Wealth Advisors, Inc. | 27.689 | -1,26 | 1.868 | 9,44 | ||||
| 2025-08-14 | 13F | Ameriprise Financial Inc | 52.882 | 45,76 | 3.567 | 62,46 | ||||
| 2025-08-14 | 13F | Wells Fargo & Company/mn | 0 | 0 | ||||||
| 2025-05-08 | 13F | Us Bancorp \de\ | 0 | -100,00 | 0 | |||||
| 2025-08-13 | 13F | IAG Wealth Partners, LLC | 9.205 | 0,00 | 621 | 10,71 | ||||
| 2025-07-25 | 13F | Cwm, Llc | 193.140 | 2,01 | 13 | 18,18 | ||||
| 2025-08-14 | 13F | Great Valley Advisor Group, Inc. | 141.419 | -3,35 | 9.539 | 7,11 | ||||
| 2025-08-15 | 13F | Fidelity D & D Bancorp Inc | 25.067 | 27,18 | 1.691 | 40,95 | ||||
| 2025-08-01 | 13F | Belvedere Trading LLC | 0 | -100,00 | 0 | |||||
| 2025-08-11 | 13F | Western Wealth Management, LLC | 3.100 | 209 | ||||||
| 2025-07-15 | 13F | Unified Investment Management | 6.243 | 0,64 | 421 | 11,67 | ||||
| 2025-08-15 | 13F | Morgan Stanley | 1.585 | 0,06 | 107 | 10,42 | ||||
| 2025-07-21 | 13F | Ameriflex Group, Inc. | 0 | -100,00 | 0 | |||||
| 2025-05-12 | 13F | Jpmorgan Chase & Co | 0 | -100,00 | 0 | |||||
| 2025-07-31 | 13F | Cambridge Investment Research Advisors, Inc. | 112.932 | -7,43 | 8 | 0,00 | ||||
| 2025-05-14 | 13F | Van Hulzen Asset Management, LLC | 0 | -100,00 | 0 | |||||
| 2025-05-15 | 13F | GWM Advisors LLC | 0 | -100,00 | 0 | -100,00 | ||||
| 2025-07-28 | 13F | Axxcess Wealth Management, Llc | 0 | -100,00 | 0 | |||||
| 2025-08-29 | NP | JSPCX - Janus Henderson Global Allocation Fund - Conservative Class T | 1.096 | 0,18 | 74 | 10,61 | ||||
| 2025-07-11 | 13F | Farther Finance Advisors, LLC | 6.449 | 224,56 | 435 | 261,67 | ||||
| 2025-08-06 | 13F | Golden State Wealth Management, LLC | 3.733 | -1,14 | 252 | 9,61 | ||||
| 2025-05-14 | 13F | Dorsey & Whitney Trust CO LLC | 0 | -100,00 | 0 | -100,00 | ||||
| 2025-09-04 | 13F/A | Advisor Group Holdings, Inc. | 33.360 | -51,48 | 2.252 | -46,20 | ||||
| 2025-08-06 | 13F | AE Wealth Management LLC | 1 | 0 | ||||||
| 2025-08-04 | 13F | IFG Advisory, LLC | 3.691 | -11,93 | 249 | -2,75 | ||||
| 2025-07-11 | 13F | SILVER OAK SECURITIES, Inc | 8.821 | 64,57 | 595 | 87,11 | ||||
| 2025-08-29 | NP | JSPMX - Janus Henderson Global Allocation Fund - Moderate Class T | 2.457 | -0,45 | 166 | 10,00 | ||||
| 2025-08-11 | 13F | Bradley Foster & Sargent Inc/ct | 4.077 | 275 | ||||||
| 2025-07-22 | 13F | Willner & Heller, Llc | 13.932 | 2,74 | 940 | 13,82 | ||||
| 2025-07-30 | 13F | BlueChip Wealth Advisors LLC | 4.372 | 0,00 | 295 | 10,53 | ||||
| 2025-08-12 | 13F | Guerra Pan Advisors, Llc | 18.784 | -6,14 | 1.267 | 4,03 | ||||
| 2025-08-01 | 13F | Belvedere Trading LLC | Call | 0 | -100,00 | 0 | ||||
| 2025-07-10 | 13F | Sovran Advisors, LLC | 28.479 | -32,49 | 1.937 | -19,13 | ||||
| 2025-08-13 | 13F | Smith, Moore & Co. | 4.802 | 1,95 | 324 | 12,94 | ||||
| 2025-08-14 | 13F | Win Advisors, Inc | 6.132 | -42,60 | 414 | -36,46 | ||||
| 2025-08-18 | 13F | Geneos Wealth Management Inc. | 668 | 328,21 | 45 | 400,00 | ||||
| 2025-08-01 | 13F | Brookwood Investment Group LLC | 7.941 | 536 | ||||||
| 2025-03-31 | NP | PFTSX - PFG Tactical Income Strategy Fund Class R Shares | 30.514 | -5,15 | 2.103 | 1,64 | ||||
| 2025-07-25 | 13F | Atria Wealth Solutions, Inc. | 4.593 | -0,71 | 311 | 9,93 | ||||
| 2025-08-11 | 13F/A | Purus Wealth Management, LLC | 62.853 | -0,77 | 4.239 | 9,99 | ||||
| 2025-08-14 | 13F | Susquehanna International Group, Llp | 20.224 | 1.364 | ||||||
| 2025-05-02 | 13F | Napatree Capital Llc | 4.035 | 246 | ||||||
| 2025-07-16 | 13F | Independent Wealth Network Inc. | 11.050 | 6,41 | 745 | 18,07 | ||||
| 2025-08-12 | 13F | Global Retirement Partners, LLC | 25 | 0,00 | 2 | 0,00 | ||||
| 2025-08-04 | 13F | Creative Financial Designs Inc /adv | 650 | 4,00 | 44 | 13,16 | ||||
| 2025-08-08 | 13F | Avantax Advisory Services, Inc. | 17.584 | -6,77 | 1.186 | 3,40 | ||||
| 2025-08-14 | 13F | Fmr Llc | 410 | 583,33 | 28 | 800,00 | ||||
| 2025-07-10 | 13F | Triangle Securities Wealth Management | 67.601 | -4,04 | 4.560 | 6,34 | ||||
| 2025-07-22 | 13F | Valley National Advisers Inc | 63 | -89,23 | 0 | |||||
| 2025-08-06 | 13F | Commonwealth Equity Services, Llc | 136.774 | 3,15 | 9 | 12,50 | ||||
| 2025-08-14 | 13F | Mml Investors Services, Llc | 3.360 | -70,17 | 0 | |||||
| 2025-07-28 | 13F | Harbour Investments, Inc. | 809 | -56,27 | 55 | -51,79 | ||||
| 2025-08-12 | 13F | Quadcap Wealth Management, LLC | 46.584 | 30,56 | 3.142 | 44,73 | ||||
| 2025-08-14 | 13F | Two Sigma Investments, Lp | 6.600 | 445 | ||||||
| 2025-04-21 | 13F | Nelson, Van Denburg & Campbell Wealth Management Group, LLC | 0 | -100,00 | 0 | |||||
| 2025-08-14 | 13F | Royal Bank Of Canada | 97.713 | 114,11 | 6.591 | 137,34 | ||||
| 2025-08-08 | 13F | Capital Investment Advisory Services, LLC | 424 | -37,83 | 29 | -31,71 | ||||
| 2025-08-12 | 13F | LPL Financial LLC | 180.841 | -9,18 | 12.198 | 0,65 | ||||
| 2025-08-01 | 13F | Envestnet Asset Management Inc | 13.730 | -33,96 | 926 | -26,80 | ||||
| 2025-03-31 | NP | Northern Lights Fund Trust - PFG Janus Henderson(R) Balanced Strategy Class R Shares | 85.953 | -3,64 | 5.923 | 3,30 | ||||
| 2025-08-05 | 13F | Sigma Planning Corp | 0 | -100,00 | 0 | |||||
| 2025-07-07 | 13F | Dominguez Wealth Management Solutions, Inc. | 7.648 | 0,35 | 516 | 11,23 | ||||
| 2025-08-11 | 13F | Principal Securities, Inc. | 8.300 | 23,35 | 560 | 26,76 | ||||
| 2025-08-29 | NP | JSPGX - Janus Henderson Global Allocation Fund - Growth Class T | 4.102 | -1,80 | 277 | 8,66 | ||||
| 2025-08-08 | 13F | POM Investment Strategies, LLC | 85 | 0,00 | 6 | 0,00 | ||||
| 2025-08-14 | 13F | Citadel Advisors Llc | 0 | -100,00 | 0 | |||||
| 2025-07-14 | 13F | Main Line Retirement Advisors, LLC | 0 | -100,00 | 0 | |||||
| 2025-08-11 | 13F | Private Advisor Group, LLC | 82.926 | 13,45 | 5.593 | 25,74 | ||||
| 2025-08-14 | 13F | UBS Group AG | 19.914 | 9,44 | 1.343 | 21,32 | ||||
| 2025-07-11 | 13F | CX Institutional | 0 | -100,00 | 0 | |||||
| 2025-08-14 | 13F | Comerica Bank | 235 | 16 | ||||||
| 2025-08-12 | 13F | Proequities, Inc. | 0 | 0 | ||||||
| 2025-08-14 | 13F | IHT Wealth Management, LLC | 3.669 | 247 | ||||||
| 2025-08-14 | 13F | Wiley Bros.-aintree Capital, Llc | 3.827 | 0,47 | 258 | 14,16 | ||||
| 2025-07-15 | 13F | Colonial River Wealth Management, LLC | 0 | -100,00 | 0 | |||||
| 2025-07-31 | 13F | Whipplewood Advisors, LLC | 0 | -100,00 | 0 | |||||
| 2025-08-08 | 13F | Cetera Investment Advisers | 5.002 | -40,16 | 337 | -33,66 | ||||
| 2025-08-08 | 13F | Good Life Advisors, LLC | 5.153 | 348 | ||||||
| 2025-07-10 | 13F | Focus Financial Network, Inc. | 0 | -100,00 | 0 | |||||
| 2025-07-10 | 13F | HF Advisory Group, LLC | 10.509 | 9,53 | 709 | 21,44 | ||||
| 2025-07-24 | 13F | Capital Advisors, Ltd. LLC | 3.806 | 0,00 | 0 | |||||
| 2025-05-15 | 13F | CAPROCK Group, Inc. | 0 | -100,00 | 0 | |||||
| 2025-08-05 | 13F | Key FInancial Inc | 4.605 | 0,00 | 311 | 10,71 | ||||
| 2025-07-10 | 13F | Orgel Wealth Management, LLC | 44.334 | -44,03 | 2.990 | -37,98 | ||||
| 2025-07-10 | 13F | Wealth Enhancement Advisory Services, Llc | 24.760 | -19,02 | 1.702 | -8,55 | ||||
| 2025-07-24 | 13F | IFP Advisors, Inc | 6.272 | -33,36 | 423 | -26,05 |