Grundlæggende statistik
| Institutionelle ejere | 100 total, 100 long only, 0 short only, 0 long/short - change of -8,26% MRQ |
| Gennemsnitlig porteføljeallokering | 0.3174 % - change of 11,47% MRQ |
| Institutionelle aktier (lange) | 9.798.452 (ex 13D/G) - change of -0,60MM shares -5,73% MRQ |
| Institutionel værdi (lang) | $ 774.874 USD ($1000) |
Institutionelt ejerskab og aktionærer
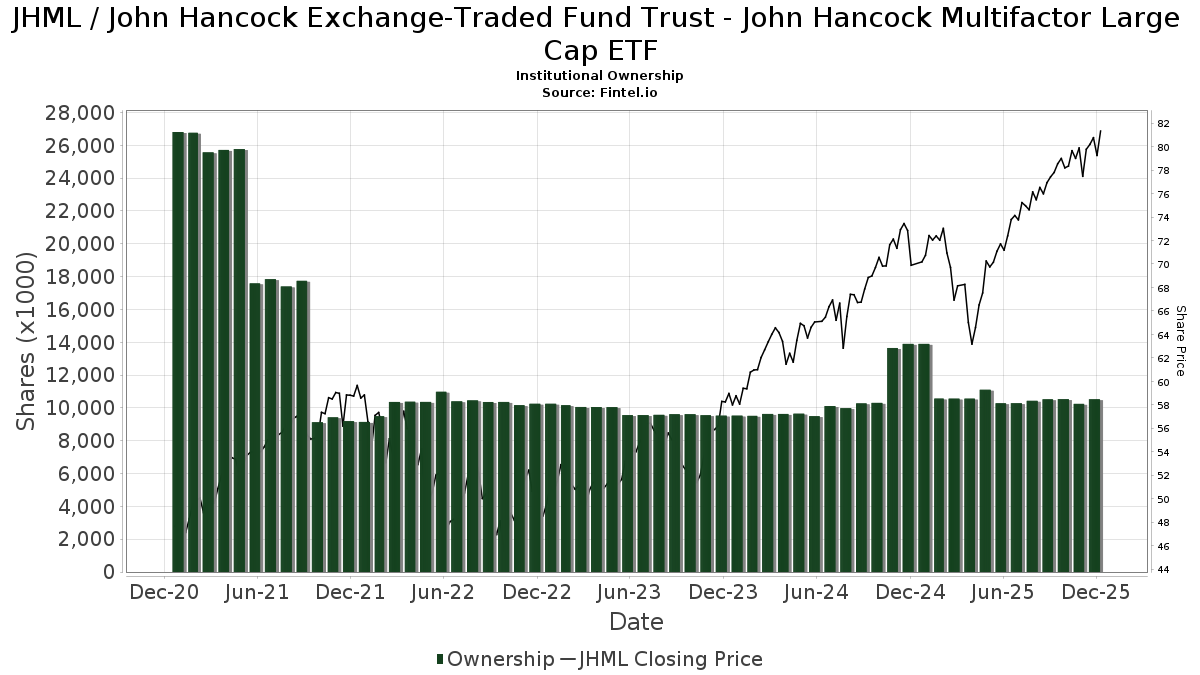
John Hancock Exchange-Traded Fund Trust - John Hancock Multifactor Large Cap ETF (US:JHML) har 100 institutionelle ejere og aktionærer, der har indsendt 13D/G- eller 13F-formularer til Securities Exchange Commission (SEC). Disse institutioner har i alt 9,798,452 aktier. Største aktionærer omfatter Grimes & Company, Inc., Ameriprise Financial Inc, LPL Financial LLC, Wells Fargo & Company/mn, Sanchez Wealth Management Group, Commonwealth Equity Services, Llc, Raymond James Financial Inc, Morgan Stanley, Envestnet Asset Management Inc, and Bank Of America Corp /de/ .
John Hancock Exchange-Traded Fund Trust - John Hancock Multifactor Large Cap ETF (ARCA:JHML) institutionel ejerskabsstruktur viser aktuelle positioner i virksomheden efter institutioner og fonde, samt seneste ændringer i positionsstørrelse. Større aktionærer kan omfatte individuelle investorer, investeringsforeninger, hedgefonde eller institutioner. Skema 13D angiver, at investoren besidder (eller besidder) mere end 5 % af virksomheden og har til hensigt (eller har til hensigt at) aktivt at forfølge en ændring i forretningsstrategi. Skema 13G indikerer en passiv investering på over 5%.
The share price as of April 29, 2026 is 84,26 / share. Previously, on April 30, 2025, the share price was 66,51 / share. This represents an increase of 26,69% over that period.
Fondens stemningsscore
Fund Sentiment Score (fka Ownership Accumulation Score) finder de aktier, der bliver mest købt af fonde. Det er resultatet af en sofistikeret, multi-faktor kvantitativ model, der identificerer virksomheder med de højeste niveauer af institutionel akkumulering. Scoringsmodellen bruger en kombination af den samlede stigning i oplyste ejere, ændringerne i porteføljeallokeringer i disse ejere og andre målinger. Tallet går fra 0 til 100, hvor højere tal indikerer et højere niveau af akkumulering for sine jævnaldrende, og 50 er gennemsnittet.
Opdateringsfrekvens: Dagligt
Se Ownership Explorer, som giver en liste over højest rangerende virksomheder.
AI+ Ask Fintel’s AI assistant about John Hancock Exchange-Traded Fund Trust - John Hancock Multifactor Large Cap ETF.
Select a question to share a public post with an AI-crafted answer.
Thinking of good questions…
Institutionel Put/Call-forhold
Ud over at indberette standardaktie- og gældsudstedelser skal institutter med mere end 100 mill. aktiver under forvaltning også oplyse deres put- og call-optionsbeholdninger. Da salgsoptioner generelt indikerer negativ stemning, og købsoptioner indikerer positiv stemning, kan vi få en fornemmelse af den overordnede institutionelle stemning ved at plotte forholdet mellem put og kald. Diagrammet til højre viser det historiske put/call-forhold for dette instrument.
Brug af Put/Call Ratio som en indikator for investorernes stemning overvinder en af de vigtigste mangler ved at bruge totalt institutionelt ejerskab, som er, at en betydelig mængde af aktiver under forvaltning investeres passivt for at spore indekser. Passivt forvaltede fonde køber typisk ikke optioner, så indikatoren for put/call-forholdet følger mere nøje følelsen af aktivt forvaltede fonde.
13F og NPORT arkivering
Detaljer om 13F-arkivering er gratis. Detaljer om NP-ansøgninger kræver et premium-medlemskab. Grønne rækker angiver nye positioner. Røde rækker angiver lukkede positioner. Klik på linket ikon for at se den fulde transaktionshistorik.
Opgrader
for at låse premium-data op og eksportere til Excel ![]() .
.
| Fil dato | Kilde | Investor | Type | Gennemsnitlig pris (Øst) |
Aktier | Δ Aktier (%) |
Rapporteret Værdi ($1000) |
Δ Værdi (%) |
Port Alloc (%) |
|
|---|---|---|---|---|---|---|---|---|---|---|
| 2026-04-23 | 13F | Farmers & Merchants Investments Inc | 0 | -100,00 | 0 | |||||
| 2026-02-17 | 13F | Perennial Investment Advisors, LLC | 10.740 | -7,89 | 858 | -6,24 | ||||
| 2026-02-13 | 13F | Mariner, LLC | 9.541 | 0,00 | 762 | 1,87 | ||||
| 2026-04-28 | 13F | Flagship Harbor Advisors, Llc | 0 | -100,00 | 0 | |||||
| 2025-11-13 | 13F | Total Investment Management Inc | 0 | -100,00 | 0 | |||||
| 2026-02-12 | 13F | Commonwealth Equity Services, Llc | 470.613 | -0,06 | 37.578 | 104.283,33 | ||||
| 2026-02-18 | 13F | Hershey Financial Advisers, LLC | 0 | -100,00 | 0 | -100,00 | ||||
| 2026-04-07 | 13F | Park Avenue Securities Llc | 4.211 | 0,00 | 0 | |||||
| 2026-04-15 | 13F | Parsons Capital Management Inc/ri | 45.322 | 5,00 | 3.547 | 2,93 | ||||
| 2026-04-23 | 13F | Columbia Advisory Partners Llc | 7.933 | -8,55 | 621 | -10,40 | ||||
| 2026-01-30 | 13F | Simplicity Wealth,LLC | 128.580 | 1,79 | 10.267 | 3,72 | ||||
| 2026-04-24 | 13F | ERn Financial, LLC | 132.924 | 1,08 | 10.404 | -0,92 | ||||
| 2026-02-06 | 13F | Global Retirement Partners, LLC | 75 | 0,00 | 6 | 0,00 | ||||
| 2026-02-10 | 13F | Tidemark, LLC | 586 | 0,69 | 47 | 2,22 | ||||
| 2026-01-26 | 13F | Cwm, Llc | 12.649 | 0,15 | 1 | |||||
| 2026-02-17 | 13F | Cetera Investment Advisers | 247.217 | 8,24 | 19.740 | 10,29 | ||||
| 2026-04-03 | 13F | Coastline Trust Co | 175 | 0,00 | 14 | 0,00 | ||||
| 2026-04-15 | 13F | Trust Point Inc. | 4.188 | 0,00 | 328 | -2,10 | ||||
| 2026-02-05 | 13F | Thrivent Financial For Lutherans | 4.782 | 0,00 | 0 | |||||
| 2026-02-13 | 13F | Kestra Advisory Services, LLC | 0 | -100,00 | 0 | |||||
| 2026-02-17 | 13F | Susquehanna International Group, Llp | 0 | -100,00 | 0 | |||||
| 2026-04-10 | 13F | Armstrong Advisory Group, Inc | 161 | 0,00 | 13 | 0,00 | ||||
| 2026-01-29 | 13F | Beirne Wealth Consulting Services, LLC | 6.942 | -8,26 | 554 | -6,58 | ||||
| 2026-04-23 | 13F | Oppenheimer & Co Inc | 15.423 | 0,83 | 1.207 | -1,15 | ||||
| 2026-02-11 | 13F | J.w. Cole Advisors, Inc. | 0 | -100,00 | 0 | |||||
| 2026-04-20 | 13F | Kestra Private Wealth Services, Llc | 3.469 | 3,12 | 272 | 1,12 | ||||
| 2026-04-24 | 13F | Bellevue Asset Management, Llc | 593 | 0,00 | 46 | -2,13 | ||||
| 2026-02-12 | 13F | Principal Securities, Inc. | 0 | -100,00 | 0 | -100,00 | ||||
| 2026-04-14 | 13F | SigFig Wealth Management, LLC | 16.512 | -1,30 | 1.292 | -3,22 | ||||
| 2026-01-13 | 13F | Mayflower Financial Advisors, LLC | 0 | -100,00 | 0 | |||||
| 2026-02-06 | 13F | Pnc Financial Services Group, Inc. | 0 | -100,00 | 0 | |||||
| 2026-04-27 | 13F | Mount Yale Investment Advisors, LLC | 164.836 | 173,93 | 12.902 | 168,55 | ||||
| 2026-04-13 | 13F | IFP Advisors, Inc | 644 | 50 | ||||||
| 2026-01-26 | 13F | Private Trust Co Na | 2.640 | 0,00 | 211 | 1,94 | ||||
| 2026-04-07 | 13F | Cooper Financial Group | 141.443 | 3,21 | 11.071 | 1,17 | ||||
| 2026-01-30 | 13F | Us Bancorp \de\ | 89 | 7 | ||||||
| 2026-02-11 | 13F | LPL Financial LLC | 1.053.840 | -0,49 | 84.149 | 1,39 | ||||
| 2026-04-24 | 13F | Private Advisor Group, LLC | 40.958 | 15,36 | 3.206 | 13,09 | ||||
| 2026-02-18 | 13F | GWM Advisors LLC | 0 | -100,00 | 0 | |||||
| 2026-01-29 | 13F | UBS Group AG | 162.726 | -2,10 | 12.994 | -0,25 | ||||
| 2026-02-13 | 13F | Morgan Stanley | 421.658 | -4,73 | 33.669 | -2,93 | ||||
| 2026-04-17 | 13F | James J. Burns & Company, LLC | 6.040 | 0,00 | 473 | -2,07 | ||||
| 2026-01-29 | 13F | Sanctuary Advisors, LLC | 24.099 | -9,66 | 1.924 | -7,94 | ||||
| 2026-04-29 | 13F | Envestnet Portfolio Solutions, Inc. | 12.390 | 64,54 | 970 | 61,23 | ||||
| 2026-02-05 | 13F | Rossmore Private Capital | 23.550 | -0,84 | 1.880 | 1,02 | ||||
| 2026-04-13 | 13F | Amplius Wealth Advisors, LLC | 11.750 | -5,00 | 920 | -6,89 | ||||
| 2026-02-17 | 13F | Advisor Group Holdings, Inc. | 25.278 | -18,60 | 2.019 | -16,13 | ||||
| 2026-02-03 | 13F | Crossmark Global Holdings, Inc. | 0 | -100,00 | 0 | |||||
| 2026-02-17 | 13F | Citadel Advisors Llc | 13.129 | 78,50 | 1.048 | 81,94 | ||||
| 2026-02-13 | 13F | Smartleaf Asset Management LLC | 1.031 | 0,00 | 83 | 2,50 | ||||
| 2026-02-10 | 13F | Goldman Sachs Group Inc | 0 | -100,00 | 0 | |||||
| 2025-10-30 | 13F | Avidian Wealth Solutions, LLC | 0 | -100,00 | 0 | |||||
| 2026-02-03 | 13F | International Assets Investment Management, Llc | 20.763 | -4,15 | 1.658 | 4,02 | ||||
| 2026-02-17 | 13F | Fmr Llc | 2.297 | -4,33 | 183 | -2,66 | ||||
| 2026-01-14 | 13F | Kraft, Davis & Associates, LLC | 5.200 | 0,00 | 425 | 3,66 | ||||
| 2026-04-21 | 13F | Grimes & Company, Inc. | 1.556.167 | -1,70 | 121.801 | -3,65 | ||||
| 2026-02-13 | 13F | Venture Visionary Partners LLC | 6.500 | 0,00 | 519 | 1,96 | ||||
| 2026-02-17 | 13F | Royal Bank Of Canada | 6.699 | -10,48 | 535 | -8,70 | ||||
| 2025-11-06 | 13F | Ameritas Advisory Services, LLC | 0 | -100,00 | 0 | -100,00 | ||||
| 2026-04-06 | 13F | Private Client Services, Llc | 2.734 | 0,00 | 214 | -2,29 | ||||
| 2026-02-05 | 13F | Cambridge Investment Research Advisors, Inc. | 6.552 | -33,86 | 1 | |||||
| 2026-04-23 | 13F | Foundry Financial Group, Inc. | 19.219 | -35,52 | 1.504 | -36,81 | ||||
| 2026-01-14 | 13F | ORG Partners LLC | 4.909 | -34,49 | 392 | -33,39 | ||||
| 2026-02-17 | 13F | VestGen Advisors, LLC | 0 | -100,00 | 0 | |||||
| 2025-11-14 | 13F | Gts Securities Llc | 0 | -100,00 | 0 | -100,00 | ||||
| 2025-11-12 | 13F | Steward Partners Investment Advisory, Llc | 0 | -100,00 | 0 | |||||
| 2026-04-29 | 13F | Sageworth Trust Co of South Dakota | 6.147 | 0,00 | 481 | -1,84 | ||||
| 2026-01-21 | 13F | Capital Investment Advisory Services, LLC | 62.992 | 1,15 | 5.030 | 3,05 | ||||
| 2026-04-21 | 13F | OneAscent Family Office, LLC | 3.134 | 0,00 | 245 | -2,00 | ||||
| 2026-01-20 | 13F | Independence Bank of Kentucky | 100 | 8 | ||||||
| 2026-02-14 | 13F | Rockefeller Capital Management L.P. | 36.661 | 10,55 | 2.927 | 12,62 | ||||
| 2025-11-19 | 13F | Sunbelt Securities, Inc. | 0 | -100,00 | 0 | |||||
| 2026-01-23 | 13F | Assetmark, Inc | 644 | 0,00 | 51 | 2,00 | ||||
| 2026-04-10 | 13F | Ebert Capital Management Inc. | 6.000 | 0,00 | 470 | -4,29 | ||||
| 2026-02-12 | 13F | Brinker Capital Investments, LLC | 6.278 | -0,16 | 501 | 1,83 | ||||
| 2026-02-17 | 13F | Raymond James Financial Inc | 440.622 | 0,46 | 35.184 | 2,35 | ||||
| 2026-02-13 | 13F | Avant Capital LLC | 6.541 | -0,53 | 522 | 1,36 | ||||
| 2026-02-11 | 13F | Jpmorgan Chase & Co | 10.837 | -16,80 | 865 | -15,20 | ||||
| 2026-02-10 | 13F | Godfrey Financial Associates, Inc. | 1.842 | 147 | ||||||
| 2026-04-29 | 13F | Sanchez Wealth Management Group | 503.947 | 1,11 | 39.444 | -0,89 | ||||
| 2026-01-22 | 13F | Hill Island Financial Llc | 3.664 | -26,98 | 293 | -25,70 | ||||
| 2026-02-17 | 13F | Jones Financial Companies Lllp | 170.776 | 23,85 | 13.636 | 26,94 | ||||
| 2026-02-11 | 13F | Fca Corp /tx | 35.104 | -9,34 | 2.803 | -7,61 | ||||
| 2026-02-17 | 13F | Equitable Holdings, Inc. | 11.496 | -5,09 | 918 | -3,37 | ||||
| 2026-02-17 | 13F | Tower Research Capital LLC (TRC) | 0 | -100,00 | 0 | |||||
| 2026-02-13 | 13F | Wells Fargo & Company/mn | 935.654 | -0,79 | 74.712 | 1,09 | ||||
| 2026-04-10 | 13F | IAM Advisory, LLC | 161.529 | -0,57 | 12.643 | -2,54 | ||||
| 2026-01-23 | 13F | Westside Investment Management, Inc. | 104 | 0,00 | 8 | 0,00 | ||||
| 2026-02-17 | 13F | IHT Wealth Management, LLC | 5.302 | -3,72 | 423 | -1,86 | ||||
| 2026-02-10 | 13F | REAP Financial Group, LLC | 447 | 36 | ||||||
| 2026-02-17 | 13F | Mercer Global Advisors Inc /adv | 41.567 | -4,14 | 3.319 | -2,32 | ||||
| 2026-04-15 | 13F | Journey Strategic Wealth Llc | 23.445 | -6,17 | 1.835 | -8,02 | ||||
| 2026-02-17 | 13F | Advisory Services Network, LLC | 0 | -100,00 | 0 | |||||
| 2026-04-16 | 13F | Capital Advisors, Ltd. LLC | 4.482 | 0,00 | 0 | |||||
| 2026-02-12 | 13F | Chilton Capital Management Llc | 10.986 | -4,34 | 877 | -2,56 | ||||
| 2026-01-16 | 13F | Trust Co Of Vermont | 777 | 62 | ||||||
| 2026-02-17 | 13F | Bank Of America Corp /de/ | 281.445 | -1,88 | 22.473 | -0,02 | ||||
| 2026-02-17 | 13F | Blair William & Co/il | 650 | 0,00 | 52 | 2,00 | ||||
| 2026-02-06 | 13F | Vestmark Advisory Solutions, Inc. | 60.003 | 11,53 | 4.791 | 13,64 | ||||
| 2026-02-17 | 13F | Ameriprise Financial Inc | 1.353.498 | 0,62 | 108.072 | 2,49 | ||||
| 2026-04-07 | 13F | CoreCap Advisors, LLC | 61.842 | 13,86 | 4.840 | 11,62 | ||||
| 2026-03-04 | 13F | SHP Wealth Management | 294 | 23 | ||||||
| 2026-04-21 | 13F | OneAscent Wealth Management LLC | 3.987 | 0,00 | 312 | -1,89 | ||||
| 2026-04-07 | 13F | Farther Finance Advisors, LLC | 4.263 | 58,95 | 336 | 56,54 | ||||
| 2026-02-12 | 13F | Schneider Downs Wealth Management Advisors, LP | 65.963 | 2,90 | 5.267 | 4,86 | ||||
| 2026-04-22 | 13F | Goodman Advisory Group, LLC | 15.292 | -16,30 | 1.197 | -17,97 | ||||
| 2026-04-22 | 13F | Financially in Tune, LLC | 12.447 | -5,13 | 974 | -6,97 | ||||
| 2025-11-06 | 13F | Atria Investments Llc | 0 | -100,00 | 0 | |||||
| 2026-01-26 | 13F | AE Wealth Management LLC | 3.136 | 8,93 | 250 | 11,11 | ||||
| 2026-02-13 | 13F | Stifel Financial Corp | 3.409 | 0,32 | 272 | 2,26 | ||||
| 2026-02-10 | 13F/A | Northwestern Mutual Wealth Management Co | 63.535 | -6,79 | 5.073 | -5,02 | ||||
| 2026-02-09 | 13F | Harbour Investments, Inc. | 0 | -100,00 | 0 | |||||
| 2025-11-05 | 13F | Moloney Securities Asset Management, LLC | 21.022 | -4,25 | 1.647 | 2,30 | ||||
| 2026-02-13 | 13F | Arkadios Wealth Advisors | 10.222 | -5,26 | 816 | -3,43 | ||||
| 2026-02-10 | 13F | Envestnet Asset Management Inc | 350.116 | -31,46 | 27.957 | -30,16 | ||||
| 2026-04-14 | 13F | Well Done, LLC | 2.800 | 0,00 | 219 | -1,79 | ||||
| 2026-04-24 | 13F | Medallion Wealth Advisors, LLC | 519 | 0,00 | 41 | -2,44 | ||||
| 2026-04-17 | 13F | PMG Wealth Management, Inc. | 78.077 | 76,75 | 6.111 | 73,26 | ||||
| 2026-01-07 | 13F | Gilbert & Cook, Inc. | 2.824 | 0,00 | 225 | 1,81 | ||||
| 2026-04-15 | 13F | Arlington Financial Advisors, LLC | 3.268 | 256 | ||||||
| 2026-04-20 | 13F | Segment Wealth Management, LLC | 2.630 | -42,07 | 206 | -43,37 | ||||
| 2026-01-27 | 13F | Institute for Wealth Management, LLC. | 0 | -100,00 | 0 | |||||
| 2026-02-06 | 13F | HighTower Advisors, LLC | 44.936 | 0,41 | 3.588 | 2,31 | ||||
| 2026-04-13 | 13F | Bank & Trust Co | 1.419 | 0,00 | 111 | -1,77 |