Grundlæggende statistik
| Institutionelle ejere | 114 total, 114 long only, 0 short only, 0 long/short - change of 10,68% MRQ |
| Gennemsnitlig porteføljeallokering | 0.0735 % - change of 1,63% MRQ |
| Institutionelle aktier (lange) | 3.042.370 (ex 13D/G) - change of 1,32MM shares 76,87% MRQ |
| Institutionel værdi (lang) | $ 319.628 USD ($1000) |
Institutionelt ejerskab og aktionærer
iShares Trust - iShares Global Comm Services ETF (US:IXP) har 114 institutionelle ejere og aktionærer, der har indsendt 13D/G- eller 13F-formularer til Securities Exchange Commission (SEC). Disse institutioner har i alt 3,042,370 aktier. Største aktionærer omfatter Hsbc Holdings Plc, Green Harvest Asset Management LLC, Bank Of America Corp /de/, Pictet Asset Management Holding SA, Morgan Stanley, Money Design Co.,Ltd., BlackRock, Inc., Destination Wealth Management, AE Wealth Management LLC, and Wells Fargo & Company/mn .
iShares Trust - iShares Global Comm Services ETF (ARCA:IXP) institutionel ejerskabsstruktur viser aktuelle positioner i virksomheden efter institutioner og fonde, samt seneste ændringer i positionsstørrelse. Større aktionærer kan omfatte individuelle investorer, investeringsforeninger, hedgefonde eller institutioner. Skema 13D angiver, at investoren besidder (eller besidder) mere end 5 % af virksomheden og har til hensigt (eller har til hensigt at) aktivt at forfølge en ændring i forretningsstrategi. Skema 13G indikerer en passiv investering på over 5%.
The share price as of September 12, 2025 is 124,36 / share. Previously, on September 16, 2024, the share price was 90,47 / share. This represents an increase of 37,46% over that period.

Fondens stemningsscore
Fund Sentiment Score (fka Ownership Accumulation Score) finder de aktier, der bliver mest købt af fonde. Det er resultatet af en sofistikeret, multi-faktor kvantitativ model, der identificerer virksomheder med de højeste niveauer af institutionel akkumulering. Scoringsmodellen bruger en kombination af den samlede stigning i oplyste ejere, ændringerne i porteføljeallokeringer i disse ejere og andre målinger. Tallet går fra 0 til 100, hvor højere tal indikerer et højere niveau af akkumulering for sine jævnaldrende, og 50 er gennemsnittet.
Opdateringsfrekvens: Dagligt
Se Ownership Explorer, som giver en liste over højest rangerende virksomheder.
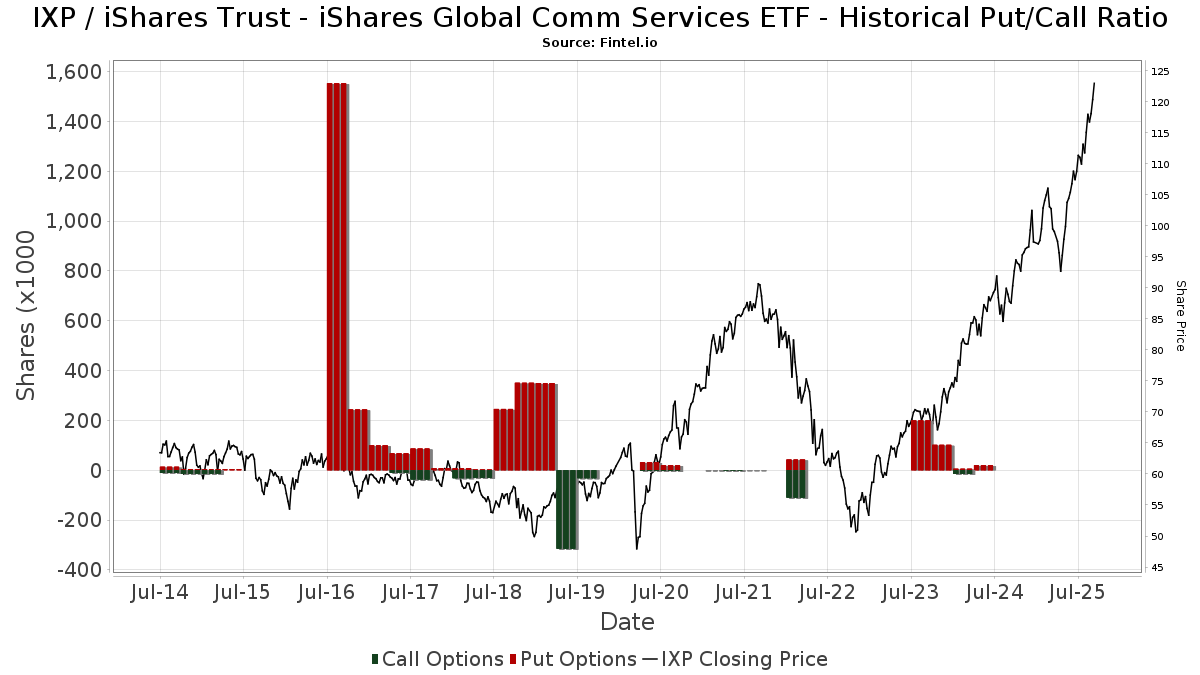
Institutionel Put/Call-forhold
Ud over at indberette standardaktie- og gældsudstedelser skal institutter med mere end 100 mill. aktiver under forvaltning også oplyse deres put- og call-optionsbeholdninger. Da salgsoptioner generelt indikerer negativ stemning, og købsoptioner indikerer positiv stemning, kan vi få en fornemmelse af den overordnede institutionelle stemning ved at plotte forholdet mellem put og kald. Diagrammet til højre viser det historiske put/call-forhold for dette instrument.
Brug af Put/Call Ratio som en indikator for investorernes stemning overvinder en af de vigtigste mangler ved at bruge totalt institutionelt ejerskab, som er, at en betydelig mængde af aktiver under forvaltning investeres passivt for at spore indekser. Passivt forvaltede fonde køber typisk ikke optioner, så indikatoren for put/call-forholdet følger mere nøje følelsen af aktivt forvaltede fonde.
13F og NPORT arkivering
Detaljer om 13F-arkivering er gratis. Detaljer om NP-ansøgninger kræver et premium-medlemskab. Grønne rækker angiver nye positioner. Røde rækker angiver lukkede positioner. Klik på linket ikon for at se den fulde transaktionshistorik.
Opgrader
for at låse premium-data op og eksportere til Excel ![]() .
.
| Fil dato | Kilde | Investor | Type | Gennemsnitlig pris (Øst) |
Aktier | Δ Aktier (%) |
Rapporteret Værdi ($1000) |
Δ Værdi (%) |
Port Alloc (%) |
|
|---|---|---|---|---|---|---|---|---|---|---|
| 2025-04-09 | 13F | RFG Advisory, LLC | 0 | -100,00 | 0 | |||||
| 2025-07-31 | 13F | Money Design Co.,Ltd. | 92.136 | -3,00 | 10 | 11,11 | ||||
| 2025-07-30 | 13F | Wbh Advisory Inc | 4.254 | 70,30 | 478 | 97,11 | ||||
| 2025-09-04 | 13F/A | Advisor Group Holdings, Inc. | 5.331 | 25,97 | 599 | 46,10 | ||||
| 2025-08-19 | 13F | Advisory Services Network, LLC | 11.470 | 1.302 | ||||||
| 2025-08-13 | 13F | Flow Traders U.s. Llc | 41.874 | 50,59 | 5 | 100,00 | ||||
| 2025-08-14 | 13F | Integrated Wealth Concepts LLC | 15.652 | 3,27 | 1.758 | 19,59 | ||||
| 2025-08-14 | 13F | Alliancebernstein L.p. | 1.932 | 217 | ||||||
| 2025-08-18 | 13F | Goodman Advisory Group, LLC | 0 | -100,00 | 0 | |||||
| 2025-04-30 | 13F | Allworth Financial LP | 0 | -100,00 | 0 | |||||
| 2025-08-14 | 13F | Destination Wealth Management | 80.951 | 0,04 | 9.092 | 15,82 | ||||
| 2025-08-01 | 13F | Financial Counselors Inc | 0 | -100,00 | 0 | |||||
| 2025-08-01 | 13F | Corrado Advisors, Llc | 35.723 | 7,20 | 4.012 | 24,10 | ||||
| 2025-08-07 | 13F | HC Advisors, LLC | 27.989 | -3,72 | 3.144 | 11,45 | ||||
| 2025-07-15 | 13F | North Star Investment Management Corp. | 1.205 | 0,17 | 135 | 16,38 | ||||
| 2025-08-07 | 13F | Cascade Financial Partners, LLC | 3.000 | 337 | ||||||
| 2025-07-16 | 13F | Meridian Investment Counsel Inc. | 6.700 | 0,00 | 753 | 15,69 | ||||
| 2025-08-12 | 13F | Proequities, Inc. | 0 | 0 | ||||||
| 2025-08-13 | 13F | Per Stirling Capital Management, LLC. | 14.838 | 0,19 | 1.667 | 16,02 | ||||
| 2025-08-12 | 13F | CIBC Private Wealth Group, LLC | 0 | -100,00 | 0 | |||||
| 2025-08-01 | 13F | Transcend Wealth Collective, Llc | 2.489 | 4,06 | 280 | 20,26 | ||||
| 2025-08-06 | 13F | Commonwealth Equity Services, Llc | 18.809 | -0,92 | 2 | 100,00 | ||||
| 2025-07-14 | 13F | U.S. Capital Wealth Advisors, LLC | 11.285 | 1,81 | 1.268 | 17,86 | ||||
| 2025-07-10 | 13F | Rockland Trust Co | 38.781 | -3,34 | 4.356 | 11,90 | ||||
| 2025-07-23 | 13F | Slow Capital, Inc. | 20.722 | -1,74 | 2.328 | 13,73 | ||||
| 2025-05-01 | 13F | Quest 10 Wealth Builders, Inc. | 1 | 0,00 | 0 | |||||
| 2025-08-12 | 13F | Jpmorgan Chase & Co | 25.183 | 21,15 | 2.829 | 40,28 | ||||
| 2025-08-01 | 13F | Bessemer Group Inc | 5.142 | 0,00 | 1 | |||||
| 2025-07-23 | 13F | Independent Solutions Wealth Management, LLC | 2.490 | 4,71 | 280 | 21,30 | ||||
| 2025-07-24 | 13F | Us Bancorp \de\ | 6.113 | 0,00 | 687 | 15,68 | ||||
| 2025-08-08 | 13F | Family Firm, Inc. | 0 | -100,00 | 0 | |||||
| 2025-07-23 | 13F | Bellevue Asset Management, Llc | 0 | -100,00 | 0 | |||||
| 2025-08-06 | 13F | AE Wealth Management LLC | 77.629 | 8,03 | 8.719 | 25,06 | ||||
| 2025-08-13 | 13F | Kayne Anderson Rudnick Investment Management Llc | 130 | 15 | ||||||
| 2025-08-08 | 13F | Union Savings Bank | 73 | 0,00 | 8 | 14,29 | ||||
| 2025-08-12 | 13F | Gladstone Institutional Advisory LLC | 4.576 | 30,48 | 514 | 50,88 | ||||
| 2025-08-14 | 13F | Royal Bank Of Canada | 3.547 | -12,59 | 398 | 1,02 | ||||
| 2025-08-05 | 13F | Bank Of Montreal /can/ | 542 | -60,38 | 61 | -54,55 | ||||
| 2025-08-15 | 13F | Semmax Financial Advisors Inc. | 12 | 0,00 | 1 | 0,00 | ||||
| 2025-08-14 | 13F | Wiley Bros.-aintree Capital, Llc | 1.804 | 203 | ||||||
| 2025-05-16 | 13F | Laidlaw Wealth Management LLC | 0 | -100,00 | 0 | |||||
| 2025-07-25 | 13F | NorthRock Partners, LLC | 998 | 0,00 | 112 | 16,67 | ||||
| 2025-08-12 | 13F | Journey Strategic Wealth Llc | 23.808 | 16,34 | 2.674 | 34,71 | ||||
| 2025-08-14 | 13F | Mml Investors Services, Llc | 13.649 | -15,23 | 2 | 0,00 | ||||
| 2025-08-11 | 13F | Aptus Capital Advisors, LLC | 14 | 0,00 | 2 | 0,00 | ||||
| 2025-04-21 | 13F | Beacon Capital Management, LLC | 0 | -100,00 | 0 | |||||
| 2025-05-05 | 13F | Mandatum Life Insurance Co Ltd | 0 | -100,00 | 0 | |||||
| 2025-08-08 | 13F | SBI Securities Co., Ltd. | 952 | 19,75 | 107 | 37,66 | ||||
| 2025-07-21 | 13F | Ameritas Advisory Services, LLC | 15 | 2 | ||||||
| 2025-07-17 | 13F | Sound Income Strategies, LLC | 77 | 0,00 | 9 | 14,29 | ||||
| 2025-08-06 | 13F | Moors & Cabot, Inc. | 1.869 | 210 | ||||||
| 2025-07-17 | 13F | Janney Montgomery Scott LLC | 7.389 | 4,31 | 1 | |||||
| 2025-08-06 | 13F | New Millennium Group LLC | 7 | 0,00 | 1 | |||||
| 2025-07-24 | 13F | Ronald Blue Trust, Inc. | 130 | 0,00 | 15 | 16,67 | ||||
| 2025-08-01 | 13F | Envestnet Asset Management Inc | 9.555 | 3,96 | 1.073 | 20,43 | ||||
| 2025-08-14 | 13F | Stifel Financial Corp | 2.564 | 1,67 | 288 | 18,03 | ||||
| 2025-08-13 | 13F | Jones Financial Companies Lllp | 7.090 | 55,93 | 792 | 79,37 | ||||
| 2025-08-04 | 13F | Pensionmark Financial Group, Llc | 15.989 | 40,28 | 1.796 | 62,44 | ||||
| 2025-08-08 | 13F | Avantax Advisory Services, Inc. | 17.542 | -10,51 | 1.970 | 3,63 | ||||
| 2025-08-14 | 13F | Susquehanna International Group, Llp | 4.103 | -69,31 | 461 | -64,53 | ||||
| 2025-05-13 | 13F | HighTower Advisors, LLC | 0 | -100,00 | 0 | -100,00 | ||||
| 2025-08-13 | 13F | Hsbc Holdings Plc | 700.747 | 78.708 | ||||||
| 2025-08-13 | 13F | Northern Trust Corp | 3.953 | 444 | ||||||
| 2025-07-21 | 13F | Ntv Asset Management Llc | 1.900 | 213 | ||||||
| 2025-08-13 | 13F | Marshall Wace, Llp | 2.368 | -31,14 | 266 | -20,42 | ||||
| 2025-08-13 | 13F | GeoWealth Management, LLC | 15.455 | 1.736 | ||||||
| 2025-08-14 | 13F | Jane Street Group, Llc | 0 | -100,00 | 0 | |||||
| 2025-08-12 | 13F | J.w. Cole Advisors, Inc. | 2.510 | 282 | ||||||
| 2025-08-14 | 13F | Quantinno Capital Management LP | 36.252 | 1,59 | 4.072 | 17,59 | ||||
| 2025-04-17 | 13F | Grimes & Company, Inc. | 0 | -100,00 | 0 | |||||
| 2025-08-18 | 13F/A | National Bank Of Canada /fi/ | 788 | -46,97 | 88 | -38,89 | ||||
| 2025-08-04 | 13F | Assetmark, Inc | 34 | 0,00 | 4 | 0,00 | ||||
| 2025-08-15 | 13F | CI Private Wealth, LLC | 32.911 | 92,66 | 3.697 | 123,05 | ||||
| 2025-08-14 | 13F | Bank Of America Corp /de/ | 295.753 | 427,49 | 33.219 | 510,74 | ||||
| 2025-05-13 | 13F | Hartland & Co., LLC | 0 | -100,00 | 0 | |||||
| 2025-08-07 | 13F | Parkside Financial Bank & Trust | 462 | 52 | ||||||
| 2025-08-08 | 13F | Creative Planning | 2.135 | 0,00 | 240 | 15,46 | ||||
| 2025-07-30 | 13F | LGT Financial Advisors LLC | 126 | 0,00 | 14 | 16,67 | ||||
| 2025-08-13 | 13F | Pictet Asset Management Holding SA | 288.000 | 333,08 | 32.155 | 398,30 | ||||
| 2025-08-13 | 13F | Continuum Advisory, LLC | 0 | -100,00 | 0 | |||||
| 2025-07-31 | 13F | CVA Family Office, LLC | 700 | 0,00 | 79 | 16,42 | ||||
| 2025-08-04 | 13F | Arkadios Wealth Advisors | 1.914 | 215 | ||||||
| 2025-07-24 | 13F | Blair William & Co/il | 85 | 0,00 | 10 | 12,50 | ||||
| 2025-08-13 | 13F | Cerity Partners LLC | 18.011 | 4,65 | 2.023 | 21,15 | ||||
| 2025-07-15 | 13F | Fifth Third Bancorp | 1.108 | 0,00 | 124 | 15,89 | ||||
| 2025-08-04 | 13F | Creative Financial Designs Inc /adv | 2.305 | 0,00 | 259 | 15,70 | ||||
| 2025-08-18 | 13F | Front Row Advisors LLC | 718 | -16,32 | 81 | -3,61 | ||||
| 2025-07-17 | 13F | Youngs Advisory Group, Inc. | 2.825 | 10,57 | 318 | 28,23 | ||||
| 2025-07-24 | 13F | IFP Advisors, Inc | 51 | -45,16 | 6 | -44,44 | ||||
| 2025-03-21 | 13F | Prostatis Group LLC | 0 | -100,00 | 0 | |||||
| 2025-08-13 | 13F | Cresset Asset Management, LLC | 15.842 | -7,29 | 1.779 | 7,36 | ||||
| 2025-08-14 | 13F | Hrt Financial Lp | 0 | -100,00 | 0 | |||||
| 2025-08-14 | 13F | Comerica Bank | 463 | 0,00 | 52 | 18,18 | ||||
| 2025-08-12 | 13F | Global Retirement Partners, LLC | 77 | 9 | ||||||
| 2025-08-12 | 13F | MAI Capital Management | 6.881 | 0,01 | 773 | 15,74 | ||||
| 2025-08-14 | 13F | Wells Fargo & Company/mn | 75.678 | -1,43 | 8.500 | 14,12 | ||||
| 2025-08-14 | 13F | UBS Group AG | 28.017 | -17,21 | 3.147 | -4,17 | ||||
| 2025-08-12 | 13F | BlackRock, Inc. | 81.399 | 0,21 | 9.143 | 16,02 | ||||
| 2025-08-12 | 13F | AlphaCore Capital LLC | 11 | 0,00 | 1 | 0,00 | ||||
| 2025-08-14 | 13F | Vivaldi Capital Management, LLC | 2.135 | 240 | ||||||
| 2025-08-26 | 13F/A | Thrivent Financial For Lutherans | 10.966 | -7,46 | 1 | 0,00 | ||||
| 2025-08-14 | 13F | Fmr Llc | 1.065 | 8,45 | 120 | 25,26 | ||||
| 2025-08-14 | 13F | CoreCap Advisors, LLC | 119 | 0,00 | 13 | 18,18 | ||||
| 2025-08-12 | 13F | One Charles Private Wealth Services, LLC | 3.988 | 5,39 | 448 | 21,80 | ||||
| 2025-08-04 | 13F | Spire Wealth Management | 175 | 0,00 | 20 | 18,75 | ||||
| 2025-04-29 | 13F | Raleigh Capital Management Inc. | 0 | -100,00 | 0 | |||||
| 2025-07-09 | 13F | Breakwater Investment Management | 201 | 0,00 | 23 | 15,79 | ||||
| 2025-08-14 | 13F | Federation des caisses Desjardins du Quebec | 3.332 | 0,00 | 374 | 15,79 | ||||
| 2025-08-15 | 13F | Morgan Stanley | 194.359 | 3,35 | 21.830 | 19,65 | ||||
| 2025-08-11 | 13F | Principal Securities, Inc. | 0 | 0 | ||||||
| 2025-08-11 | 13F | Independent Advisor Alliance | 0 | -100,00 | 0 | |||||
| 2025-08-11 | 13F | Citigroup Inc | 96 | 0,00 | 11 | 11,11 | ||||
| 2025-08-12 | 13F | Laurel Wealth Advisors LLC | 2.161 | 10.705,00 | 0 | -100,00 | ||||
| 2025-07-08 | 13F | Nbc Securities, Inc. | 316 | -3,66 | 0 | |||||
| 2025-08-14 | 13F | Gotham Asset Management, LLC | 2.037 | 229 | ||||||
| 2025-08-07 | 13F | Winch Advisory Services, LLC | 137 | 0,00 | 15 | 15,38 | ||||
| 2025-08-12 | 13F | Pathstone Holdings, LLC | 6.132 | 0,00 | 689 | 15,82 | ||||
| 2025-07-25 | 13F | Atria Wealth Solutions, Inc. | 0 | -100,00 | 0 | |||||
| 2025-07-02 | 13F | Central Pacific Bank - Trust Division | 61 | 0,00 | 7 | 20,00 | ||||
| 2025-07-25 | 13F | Sequoia Financial Advisors, LLC | 2.403 | 270 | ||||||
| 2025-08-14 | 13F | Gen-Wealth Partners Inc | 100 | 0,00 | 11 | 22,22 | ||||
| 2025-07-31 | 13F | Cambridge Investment Research Advisors, Inc. | 1.800 | 0 | ||||||
| 2025-07-08 | 13F | Parallel Advisors, LLC | 1.270 | 104,84 | 143 | 136,67 | ||||
| 2025-07-17 | 13F | Global Trust Asset Management, LLC | 22 | 0,00 | 2 | 0,00 | ||||
| 2025-08-11 | 13F | TD Waterhouse Canada Inc. | 225 | 0,00 | 25 | 19,05 | ||||
| 2025-07-16 | 13F/A | CX Institutional | 92 | 0 | ||||||
| 2025-08-12 | 13F | LPL Financial LLC | 66.129 | 14,81 | 7.428 | 32,91 | ||||
| 2025-08-07 | 13F | Bradley & Co. Private Wealth Management, LLC | 350 | 0,00 | 39 | 18,18 | ||||
| 2025-08-14 | 13F | Raymond James Financial Inc | 12.726 | 3,09 | 1.429 | 19,38 | ||||
| 2025-08-13 | 13F | Northwestern Mutual Wealth Management Co | 152 | 17 | ||||||
| 2025-07-25 | 13F | Johnson Investment Counsel Inc | 2.400 | 0,00 | 270 | 15,95 | ||||
| 2025-08-14 | 13F | GWM Advisors LLC | 30.022 | 611,08 | 3.372 | 724,45 | ||||
| 2025-08-13 | 13F | Green Harvest Asset Management LLC | 399.185 | 25,28 | 44.836 | 45,04 | ||||
| 2025-08-14 | 13F | Sunbelt Securities, Inc. | 2.451 | 22,06 | 237 | 21,65 | ||||
| 2025-08-07 | 13F | Midwest Trust Co | 6.250 | 702 | ||||||
| 2025-08-11 | 13F | Capital Square, LLC | 1.900 | 209 | ||||||
| 2025-08-14 | 13F | Citadel Advisors Llc | 0 | -100,00 | 0 | |||||
| 2025-04-22 | 13F | Synergy Financial Management, LLC | 0 | -100,00 | 0 |
Other Listings
| MX:IXP |