Grundlæggende statistik
| Institutionelle ejere | 138 total, 138 long only, 0 short only, 0 long/short - change of -2,82% MRQ |
| Gennemsnitlig porteføljeallokering | 0.1787 % - change of -34,39% MRQ |
| Institutionelle aktier (lange) | 15.213.222 (ex 13D/G) - change of 0,50MM shares 3,42% MRQ |
| Institutionel værdi (lang) | $ 622.176 USD ($1000) |
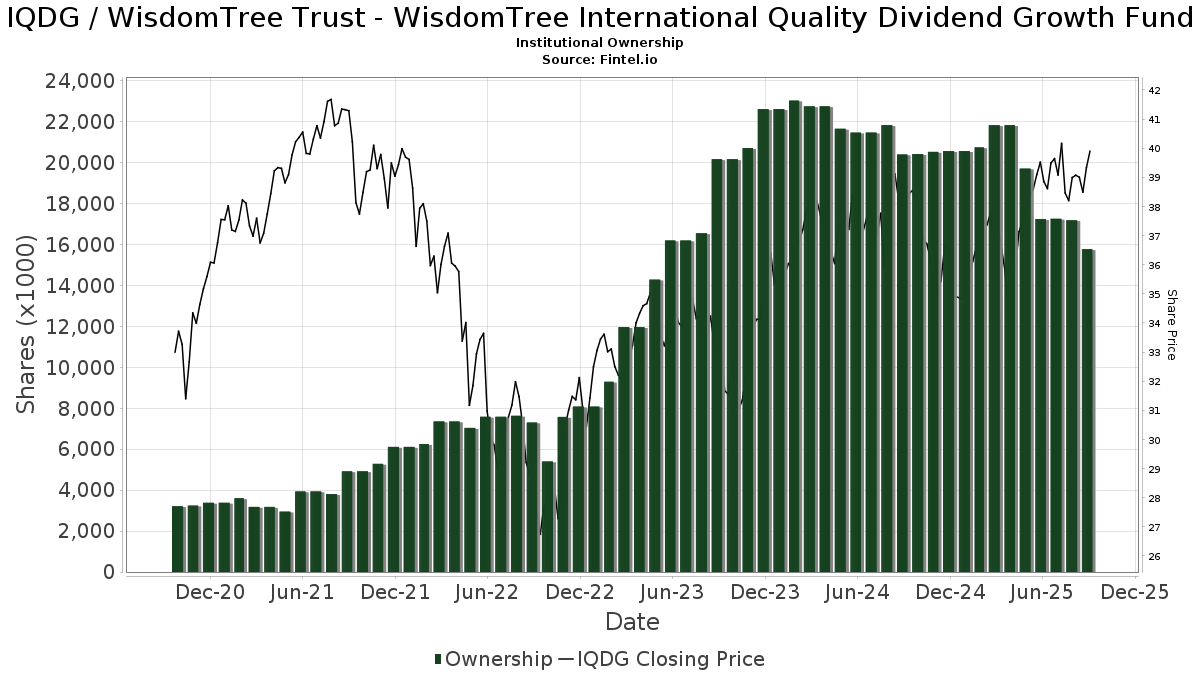
Institutionelt ejerskab og aktionærer
WisdomTree Trust - WisdomTree International Quality Dividend Growth Fund (US:IQDG) har 138 institutionelle ejere og aktionærer, der har indsendt 13D/G- eller 13F-formularer til Securities Exchange Commission (SEC). Disse institutioner har i alt 15,213,222 aktier. Største aktionærer omfatter Bank Of America Corp /de/, Morgan Stanley, AlphaCore Capital LLC, SPC Financial, Inc., LPL Financial LLC, Envestnet Asset Management Inc, UBS Group AG, Cetera Investment Advisers, HighTower Advisors, LLC, and Revolve Wealth Partners, LLC .
WisdomTree Trust - WisdomTree International Quality Dividend Growth Fund (BATS:IQDG) institutionel ejerskabsstruktur viser aktuelle positioner i virksomheden efter institutioner og fonde, samt seneste ændringer i positionsstørrelse. Større aktionærer kan omfatte individuelle investorer, investeringsforeninger, hedgefonde eller institutioner. Skema 13D angiver, at investoren besidder (eller besidder) mere end 5 % af virksomheden og har til hensigt (eller har til hensigt at) aktivt at forfølge en ændring i forretningsstrategi. Skema 13G indikerer en passiv investering på over 5%.
The share price as of March 4, 2026 is 42,57 / share. Previously, on March 5, 2025, the share price was 37,80 / share. This represents an increase of 12,62% over that period.
Fondens stemningsscore
Fund Sentiment Score (fka Ownership Accumulation Score) finder de aktier, der bliver mest købt af fonde. Det er resultatet af en sofistikeret, multi-faktor kvantitativ model, der identificerer virksomheder med de højeste niveauer af institutionel akkumulering. Scoringsmodellen bruger en kombination af den samlede stigning i oplyste ejere, ændringerne i porteføljeallokeringer i disse ejere og andre målinger. Tallet går fra 0 til 100, hvor højere tal indikerer et højere niveau af akkumulering for sine jævnaldrende, og 50 er gennemsnittet.
Opdateringsfrekvens: Dagligt
Se Ownership Explorer, som giver en liste over højest rangerende virksomheder.
AI+ Ask Fintel’s AI assistant about WisdomTree Trust - WisdomTree International Quality Dividend Growth Fund.
Select a question to share a public post with an AI-crafted answer.
Thinking of good questions…
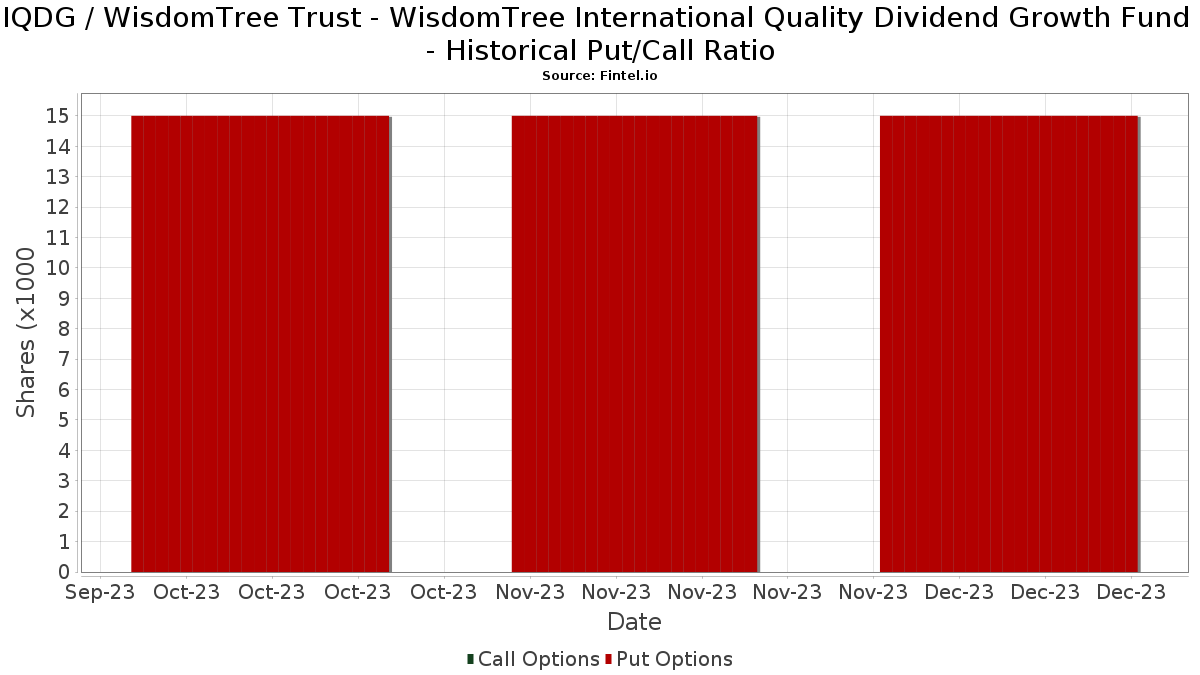
Institutionel Put/Call-forhold
Ud over at indberette standardaktie- og gældsudstedelser skal institutter med mere end 100 mill. aktiver under forvaltning også oplyse deres put- og call-optionsbeholdninger. Da salgsoptioner generelt indikerer negativ stemning, og købsoptioner indikerer positiv stemning, kan vi få en fornemmelse af den overordnede institutionelle stemning ved at plotte forholdet mellem put og kald. Diagrammet til højre viser det historiske put/call-forhold for dette instrument.
Brug af Put/Call Ratio som en indikator for investorernes stemning overvinder en af de vigtigste mangler ved at bruge totalt institutionelt ejerskab, som er, at en betydelig mængde af aktiver under forvaltning investeres passivt for at spore indekser. Passivt forvaltede fonde køber typisk ikke optioner, så indikatoren for put/call-forholdet følger mere nøje følelsen af aktivt forvaltede fonde.
13F og NPORT arkivering
Detaljer om 13F-arkivering er gratis. Detaljer om NP-ansøgninger kræver et premium-medlemskab. Grønne rækker angiver nye positioner. Røde rækker angiver lukkede positioner. Klik på linket ikon for at se den fulde transaktionshistorik.
Opgrader
for at låse premium-data op og eksportere til Excel ![]() .
.
| Fil dato | Kilde | Investor | Type | Gennemsnitlig pris (Øst) |
Aktier | Δ Aktier (%) |
Rapporteret Værdi ($1000) |
Δ Værdi (%) |
Port Alloc (%) |
|
|---|---|---|---|---|---|---|---|---|---|---|
| 2026-01-05 | 13F | Park Avenue Securities Llc | 6.860 | 12,75 | 0 | |||||
| 2026-02-13 | 13F | Journey Strategic Wealth Llc | 117.578 | -24,90 | 4.877 | -21,88 | ||||
| 2026-02-05 | 13F | Mission Wealth Management, Lp | 10.184 | 422 | ||||||
| 2026-02-17 | 13F | Susquehanna International Group, Llp | 113.242 | 412,85 | 4.697 | 433,75 | ||||
| 2026-03-04 | 13F | SHP Wealth Management | 17 | 1 | ||||||
| 2026-01-21 | 13F | Flagship Harbor Advisors, Llc | 699 | 29 | ||||||
| 2026-02-17 | 13F | Fmr Llc | 10.050 | -2,71 | 417 | 1,22 | ||||
| 2026-01-13 | 13F | CoreCap Advisors, LLC | 2.678 | 0,00 | 111 | 4,72 | ||||
| 2026-02-04 | 13F | Fourth Dimension Wealth, LLC | 101.450 | 1,75 | 4.208 | 5,84 | ||||
| 2026-02-09 | 13F | Harbour Investments, Inc. | 112 | 0,00 | 5 | 0,00 | ||||
| 2026-02-13 | 13F | Kestra Advisory Services, LLC | 0 | -100,00 | 0 | |||||
| 2026-01-22 | 13F | Triad Wealth Partners, LLC | 5.304 | 0,51 | 220 | 4,76 | ||||
| 2026-02-17 | 13F | Quantinno Capital Management LP | 9.436 | 391 | ||||||
| 2026-01-08 | 13F | Wealth Enhancement Advisory Services, Llc | 0 | -100,00 | 0 | -100,00 | ||||
| 2026-01-23 | 13F | Financial Enhancement Group LLC | 33.056 | 3,17 | 1.411 | 9,13 | ||||
| 2026-02-10 | 13F | Bank of New York Mellon Corp | 7.298 | 1,36 | 303 | 5,23 | ||||
| 2026-02-13 | 13F | Morgan Stanley | 1.902.500 | -1,44 | 78.916 | 2,51 | ||||
| 2025-11-14 | 13F | Virtu Financial LLC | 0 | -100,00 | 0 | |||||
| 2026-02-13 | 13F | Arkadios Wealth Advisors | 18.314 | -4,02 | 760 | -0,13 | ||||
| 2026-02-06 | 13F | HighTower Advisors, LLC | 554.170 | 4,13 | 22.987 | 8,30 | ||||
| 2026-02-17 | 13F | Advisor Group Holdings, Inc. | 16.003 | -5,95 | 664 | 0,00 | ||||
| 2026-01-29 | 13F | Quest 10 Wealth Builders, Inc. | 0 | -100,00 | 0 | |||||
| 2026-02-18 | 13F | GWM Advisors LLC | 0 | -100,00 | 0 | |||||
| 2026-01-26 | 13F | Cwm, Llc | 3.688 | 23,97 | 0 | |||||
| 2026-02-11 | 13F | LPL Financial LLC | 1.030.236 | 0,20 | 42.734 | 4,22 | ||||
| 2026-02-11 | 13F | Buckingham Strategic Partners | 0 | -100,00 | 0 | |||||
| 2026-01-05 | 13F | Garrett Investment Advisors LLC | 447.451 | -13,39 | 18.560 | -9,92 | ||||
| 2026-02-11 | 13F | O'shaughnessy Asset Management, Llc | 13.452 | 5,56 | 558 | 9,65 | ||||
| 2026-01-23 | 13F | Assetmark, Inc | 208 | 0,00 | 9 | 0,00 | ||||
| 2026-01-29 | 13F | Resonant Capital Advisors, LLC | 42.649 | 0,01 | 1.769 | 4,06 | ||||
| 2026-02-14 | 13F | Rockefeller Capital Management L.P. | 139.078 | 238,37 | 5.769 | 251,92 | ||||
| 2026-02-11 | 13F | Jpmorgan Chase & Co | 14.453 | -16,36 | 600 | -13,06 | ||||
| 2026-01-22 | 13F | Premier Path Wealth Partners, LLC | 148.965 | -5,66 | 6.179 | -1,87 | ||||
| 2026-02-17 | 13F | Royal Bank Of Canada | 138.808 | 23,62 | 5.758 | 28,61 | ||||
| 2026-01-22 | 13F | Venturi Wealth Management, LLC | 165.216 | 0,13 | 6.853 | 4,15 | ||||
| 2026-02-12 | 13F | Mason Investment Advisory Services, Inc. | 7.748 | 0,00 | 321 | 4,22 | ||||
| 2026-02-06 | 13F | Kingdom Financial Group LLC. | 6.159 | 255 | ||||||
| 2026-02-10 | 13F | Avestar Capital, LLC | 20.049 | -0,30 | 832 | 3,75 | ||||
| 2026-02-11 | 13F | Capital Analysts, Inc. | 4.571 | -81,83 | 0 | -100,00 | ||||
| 2026-01-28 | 13F | Hobbs Group Advisors, LLC | 39.360 | -1,61 | 1.633 | 2,32 | ||||
| 2026-01-26 | 13F | Merit Financial Group, LLC | 213.386 | 8.851 | ||||||
| 2026-01-21 | 13F | Prime Capital Investment Advisors, LLC | 224.503 | 0,58 | 9.312 | 4,62 | ||||
| 2026-02-05 | 13F | Atria Investments Llc | 89.999 | 3,12 | 3.733 | 7,27 | ||||
| 2026-01-27 | 13F | TD Waterhouse Canada Inc. | 5.185 | 1,97 | 215 | 5,39 | ||||
| 2026-02-17 | 13F | Jones Financial Companies Lllp | 145 | 6 | ||||||
| 2026-02-17 | 13F | Bank Of America Corp /de/ | 2.264.066 | -2,68 | 93.913 | 1,23 | ||||
| 2026-01-26 | 13F | United Advisor Group, LLC | 5.895 | 0,19 | 245 | 4,27 | ||||
| 2026-01-29 | 13F | Sanctuary Advisors, LLC | 15.559 | -1,12 | 645 | 2,87 | ||||
| 2026-02-17 | 13F | Private Advisor Group, LLC | 12.861 | -1,10 | 533 | 2,90 | ||||
| 2025-11-14 | 13F | Mariner, LLC | 0 | -100,00 | 0 | |||||
| 2026-01-14 | 13F | Wealthcare Advisory Partners LLC | 7.352 | -15,79 | 305 | -12,64 | ||||
| 2026-01-20 | 13F | Stratos Wealth Partners, LTD. | 32.404 | 7,29 | 1.344 | 11,63 | ||||
| 2026-02-06 | 13F | GPS Wealth Strategies Group, LLC | 0 | -100,00 | 0 | -100,00 | ||||
| 2026-02-17 | 13F | Per Stirling Capital Management, LLC. | 23.107 | 0,00 | 958 | 4,02 | ||||
| 2026-02-17 | 13F | Raymond James Financial Inc | 89.435 | 51,54 | 3.710 | 57,63 | ||||
| 2026-02-20 | 13F | Sunbelt Securities, Inc. | 53 | 0,00 | 2 | 0,00 | ||||
| 2026-02-12 | 13F | Bank Of Montreal /can/ | 9.858 | -39,37 | 409 | -37,04 | ||||
| 2026-01-22 | 13F | Trilogy Capital Inc. | 8.969 | -17,93 | 372 | -14,48 | ||||
| 2026-02-05 | 13F | Western Wealth Management, LLC | 48.174 | 5,92 | 1.998 | 10,20 | ||||
| 2026-01-20 | 13F | Revolve Wealth Partners, LLC | 466.981 | 1,64 | 19.370 | 5,71 | ||||
| 2026-02-25 | 13F | Thryve Wealth Management Llc | 15.755 | 654 | ||||||
| 2025-11-05 | 13F | SPC Financial, Inc. | 1.095.888 | 3,94 | 43.704 | 4,57 | ||||
| 2026-01-20 | 13F | Sovran Advisors, LLC | 0 | -100,00 | 0 | |||||
| 2026-02-10 | 13F | Goldman Sachs Group Inc | 0 | -100,00 | 0 | |||||
| 2025-11-05 | 13F | B.O.S.S. Retirement Advisors, LLC | 0 | -100,00 | 0 | |||||
| 2026-01-12 | 13F | World Equity Group, Inc. | 9.525 | 6,35 | 395 | 10,64 | ||||
| 2026-01-12 | 13F | Uhlmann Price Securities, Llc | 9.179 | 0,58 | 381 | 4,68 | ||||
| 2026-02-12 | 13F | Saiph Capital, LLC | 0 | -100,00 | 0 | |||||
| 2026-02-12 | 13F | Investor's Fiduciary Advisor Network, LLC | 9.692 | 14,40 | 0 | |||||
| 2026-01-13 | 13F | Kathmere Capital Management, LLC | 107.604 | -1,45 | 4.463 | 2,50 | ||||
| 2026-01-21 | 13F | Cidel Asset Management Inc | 6.698 | 0,89 | 278 | 4,92 | ||||
| 2026-02-06 | 13F | Pnc Financial Services Group, Inc. | 794 | 0,00 | 33 | 3,23 | ||||
| 2026-02-13 | 13F | Golden State Wealth Management, LLC | 66.653 | 2,34 | 2.765 | 6,43 | ||||
| 2026-02-17 | 13F | Gladstone Institutional Advisory LLC | 8.671 | 6,52 | 360 | 10,80 | ||||
| 2026-01-07 | 13F | Impact Capital Partners LLC | 63.151 | 1,21 | 2.620 | 5,27 | ||||
| 2026-01-29 | 13F | UBS Group AG | 604.379 | 3,12 | 25.070 | 7,26 | ||||
| 2025-11-12 | 13F | Principal Securities, Inc. | 0 | -100,00 | 0 | |||||
| 2026-01-29 | 13F | Comerica Bank | 7.361 | -0,51 | 305 | 3,39 | ||||
| 2026-01-20 | 13F | Princeton Global Asset Management LLC | 22.779 | -1,35 | 945 | 2,61 | ||||
| 2025-11-12 | 13F | Armis Advisers, LLC | 0 | -100,00 | 0 | |||||
| 2026-02-12 | 13F | Strive Asset Management, LLC | 0 | -100,00 | 0 | |||||
| 2026-02-19 | 13F | CI Private Wealth, LLC | 111.753 | 42,16 | 52 | -98,34 | ||||
| 2025-11-12 | 13F | Transce3nd, LLC | 0 | -100,00 | 0 | |||||
| 2026-02-02 | 13F | Mutual Advisors, LLC | 6.059 | -1,16 | 251 | 2,03 | ||||
| 2026-02-12 | 13F | Commonwealth Equity Services, Llc | 46.249 | -84,55 | 1.918 | 17.336,36 | ||||
| 2026-01-12 | 13F | Foster Group, Inc. | 4.931 | 205 | ||||||
| 2026-01-26 | 13F | Private Trust Co Na | 3.309 | 11,83 | 137 | 16,10 | ||||
| 2026-02-17 | 13F | Qube Research & Technologies Ltd | 3.041 | -13,66 | 126 | -10,00 | ||||
| 2026-02-13 | 13F | Wells Fargo & Company/mn | 571 | 79,00 | 24 | 91,67 | ||||
| 2026-01-23 | 13F | Westside Investment Management, Inc. | 4.391 | 0,00 | 184 | 3,98 | ||||
| 2026-02-06 | 13F | Creative Financial Designs Inc /adv | 2.616 | -3,25 | 109 | 0,93 | ||||
| 2026-02-10 | 13F | REAP Financial Group, LLC | 2.325 | -5,26 | 96 | -1,03 | ||||
| 2026-02-09 | 13F | Key FInancial Inc | 10.837 | 13,01 | 450 | 16,32 | ||||
| 2026-01-29 | 13F | Golden State Equity Partners | 24.626 | -54,60 | 1.022 | -52,80 | ||||
| 2026-01-21 | 13F | Capital Advisors, Ltd. LLC | 2.600 | 295,14 | 0 | |||||
| 2026-02-06 | 13F | IFP Advisors, Inc | 52.902 | 0,22 | 2.194 | 4,23 | ||||
| 2026-02-13 | 13F | Flow Traders U.s. Llc | 0 | -100,00 | 0 | |||||
| 2026-01-16 | 13F | SigFig Wealth Management, LLC | 68.576 | 11,59 | 2.845 | 16,80 | ||||
| 2026-02-17 | 13F | VestGen Advisors, LLC | 16.928 | 702 | ||||||
| 2026-02-13 | 13F | National Bank Of Canada /fi/ | 3.999 | -35,19 | 166 | -32,93 | ||||
| 2026-02-13 | 13F | Citigroup Inc | 2.228 | 92 | ||||||
| 2026-02-13 | 13F | Arete Wealth Advisors, LLC | 7.491 | -7,15 | 0 | |||||
| 2025-11-14 | 13F | Mml Investors Services, Llc | 0 | -100,00 | 0 | |||||
| 2025-11-12 | 13F | FSA Advisors, Inc. | 0 | -100,00 | 0 | |||||
| 2026-02-10 | 13F/A | Northwestern Mutual Wealth Management Co | 167.240 | 14,95 | 6.937 | 19,56 | ||||
| 2026-02-13 | 13F | Ausdal Financial Partners, Inc. | 33.700 | -31,60 | 1.398 | -28,87 | ||||
| 2026-02-12 | 13F | Jane Street Group, Llc | 24.490 | -71,00 | 1.016 | -69,85 | ||||
| 2026-01-26 | 13F | AE Wealth Management LLC | 7.246 | 17,21 | 301 | 21,95 | ||||
| 2026-02-05 | 13F | Cambridge Investment Research Advisors, Inc. | 5.558 | 0 | ||||||
| 2026-02-17 | 13F | Captrust Financial Advisors | 181.716 | 11,73 | 7.538 | 16,22 | ||||
| 2026-01-29 | 13F | Mendel Money Management | 26.785 | 16,34 | 1.111 | 21,02 | ||||
| 2026-02-02 | 13F | Vantage Point Financial LLC | 6.645 | -1,23 | 276 | 2,61 | ||||
| 2026-02-04 | 13F | Tsfg, Llc | 14.391 | -85,24 | 1 | -100,00 | ||||
| 2026-02-06 | 13F | Global Retirement Partners, LLC | 212 | 0,47 | 9 | 0,00 | ||||
| 2026-01-26 | 13F | Oxinas Partners Wealth Management LLC | 7.468 | 5,42 | 310 | 9,57 | ||||
| 2026-02-06 | 13F | Vestmark Advisory Solutions, Inc. | 42.531 | 4,76 | 1.764 | 8,96 | ||||
| 2026-02-13 | 13F | Gts Securities Llc | 15.870 | 77,10 | 658 | 84,31 | ||||
| 2025-11-06 | 13F | Financial Advocates Investment Management | 7.256 | -96,63 | 289 | -96,62 | ||||
| 2026-02-13 | 13F | Integrity Financial Corp /WA | 0 | -100,00 | 0 | |||||
| 2026-02-17 | 13F | Cahill Financial Advisors Inc | 9.511 | -3,40 | 395 | 0,51 | ||||
| 2026-01-15 | 13F | Trust Co | 3.664 | 152 | ||||||
| 2026-01-29 | 13F | D.a. Davidson & Co. | 65.538 | -11,89 | 2.719 | -8,36 | ||||
| 2026-01-09 | 13F | Breakwater Capital Group | 6.343 | 2,16 | 263 | 6,48 | ||||
| 2026-02-05 | 13F | AlphaCore Capital LLC | 1.097.734 | 1.097.634,00 | 45.534 | 1.517.700,00 | ||||
| 2026-01-13 | 13F | Team Financial Group, LLC | 2.195 | 0,50 | 91 | 4,60 | ||||
| 2026-02-10 | 13F | CIBC World Markets Inc. | 15.147 | -2,57 | 628 | 1,29 | ||||
| 2026-02-11 | 13F | Howard Bailey Securities, Llc | 11.716 | -92,07 | 486 | -91,77 | ||||
| 2026-02-10 | 13F | One Capital Management, LLC | 371.208 | -39,60 | 15.398 | -37,18 | ||||
| 2026-02-12 | 13F | Insigneo Advisory Services, Llc | 0 | -100,00 | 0 | -100,00 | ||||
| 2026-02-10 | 13F | Future Fund LLC | 0 | -100,00 | 0 | |||||
| 2026-02-13 | 13F | Stifel Financial Corp | 41.868 | 3,20 | 1.737 | 7,36 | ||||
| 2026-02-13 | 13F | Invenio Wealth Partners Llc | 33.944 | -25,52 | 1.408 | -22,56 | ||||
| 2026-02-23 | 13F | Beaird Harris Wealth Management, LLC | 1.440 | 0,00 | 60 | 3,51 | ||||
| 2026-01-23 | 13F | Farther Finance Advisors, LLC | 151 | 6 | ||||||
| 2026-02-17 | 13F | Cetera Investment Advisers | 593.998 | 2,88 | 24.639 | 7,01 | ||||
| 2026-02-17 | 13F | Old Mission Capital Llc | 0 | -100,00 | 0 | |||||
| 2026-02-10 | 13F | Evolution Wealth Management Inc. | 7.335 | -7,90 | 304 | -4,10 | ||||
| 2026-02-13 | 13F | Smartleaf Asset Management LLC | 35 | 1 | ||||||
| 2026-01-12 | 13F | Bulwark Capital Corp | 0 | -100,00 | 0 | |||||
| 2026-02-03 | 13F | International Assets Investment Management, Llc | 654 | -94,03 | 27 | |||||
| 2026-01-05 | 13F | City Center Advisors, LLC | 15.571 | 6,14 | 646 | 10,26 | ||||
| 2026-01-30 | 13F | Axis Wealth Partners, LLC | 5.807 | 6,24 | 241 | 10,60 | ||||
| 2026-02-06 | 13F | Axxcess Wealth Management, Llc | 15.118 | 17,00 | 627 | 21,75 | ||||
| 2026-01-26 | 13F | Nations Financial Group Inc, /ia/ /adv | 10.241 | -3,77 | 425 | 0,00 | ||||
| 2026-02-20 | 13F | Catalyst Investment Management LLC | 139.017 | 5.766 | ||||||
| 2026-01-29 | 13F | Nbc Securities, Inc. | 10.465 | -19,08 | 434 | -15,73 | ||||
| 2026-02-12 | 13F | Rossby Financial, LCC | 15.376 | 638 | ||||||
| 2026-02-17 | 13F | Creative Planning | 24.119 | -22,50 | 1.000 | -19,42 | ||||
| 2025-10-14 | 13F | Security Financial Services, INC. | 0 | -100,00 | 0 | |||||
| 2026-01-29 | 13F | Kestra Private Wealth Services, Llc | 6.766 | 12,62 | 281 | 17,15 | ||||
| 2026-02-17 | 13F | Citadel Advisors Llc | 260.078 | 982,89 | 10.788 | 1.027,27 | ||||
| 2026-02-17 | 13F | IHT Wealth Management, LLC | 9.583 | 16,31 | 397 | 21,04 | ||||
| 2026-01-13 | 13F | Sharkey, Howes & Javer | 14.164 | -37,24 | 588 | -34,71 | ||||
| 2026-01-20 | 13F | AdvisorNet Financial, Inc | 267 | 0,00 | 11 | 10,00 | ||||
| 2026-02-04 | 13F | D'Orazio & Associates, Inc. | 15.048 | 0,00 | 624 | 4,00 | ||||
| 2026-01-30 | 13F | Kondo Wealth Advisors, Inc. | 11.917 | -1,26 | 494 | 2,70 | ||||
| 2026-02-11 | 13F | Janney Montgomery Scott LLC | 5.459 | 6,85 | 0 | |||||
| 2026-02-13 | 13F | Aptus Capital Advisors, LLC | 1.129 | 0,00 | 47 | 2,22 | ||||
| 2026-02-18 | 13F | Caitlin John, LLC | 108 | 0,00 | 4 | 0,00 | ||||
| 2026-02-09 | 13F | Frazier Financial Advisors, LLC | 2.207 | 0,00 | 92 | 3,41 | ||||
| 2026-01-28 | 13F | Emprise Bank | 6.325 | 0,00 | 262 | 3,97 | ||||
| 2026-01-08 | 13F | Signet Financial Management, Llc | 48.174 | 4,11 | 1.998 | 8,29 | ||||
| 2026-02-10 | 13F | Envestnet Asset Management Inc | 740.159 | -5,48 | 30.702 | -1,69 |