Grundlæggende statistik
| Institutionelle ejere | 115 total, 115 long only, 0 short only, 0 long/short - change of -3,36% MRQ |
| Gennemsnitlig porteføljeallokering | 0.0883 % - change of -5,66% MRQ |
| Institutionelle aktier (lange) | 37.968.578 (ex 13D/G) - change of -1,25MM shares -3,19% MRQ |
| Institutionel værdi (lang) | $ 179.103 USD ($1000) |
Institutionelt ejerskab og aktionærer
CBRE Global Real Estate Income Fund (US:IGR) har 115 institutionelle ejere og aktionærer, der har indsendt 13D/G- eller 13F-formularer til Securities Exchange Commission (SEC). Disse institutioner har i alt 37,968,578 aktier. Største aktionærer omfatter Morgan Stanley, UBS Group AG, Penserra Capital Management LLC, YYY - Amplify High Income ETF, Flagship Harbor Advisors, Llc, Bank Of America Corp /de/, Wells Fargo & Company/mn, Ameriprise Financial Inc, LPL Financial LLC, and Pacific Wealth Strategies Group, Inc. .
CBRE Global Real Estate Income Fund (NYSE:IGR) institutionel ejerskabsstruktur viser aktuelle positioner i virksomheden efter institutioner og fonde, samt seneste ændringer i positionsstørrelse. Større aktionærer kan omfatte individuelle investorer, investeringsforeninger, hedgefonde eller institutioner. Skema 13D angiver, at investoren besidder (eller besidder) mere end 5 % af virksomheden og har til hensigt (eller har til hensigt at) aktivt at forfølge en ændring i forretningsstrategi. Skema 13G indikerer en passiv investering på over 5%.
The share price as of September 12, 2025 is 5,15 / share. Previously, on September 16, 2024, the share price was 6,62 / share. This represents a decline of 22,21% over that period.

Fondens stemningsscore
Fund Sentiment Score (fka Ownership Accumulation Score) finder de aktier, der bliver mest købt af fonde. Det er resultatet af en sofistikeret, multi-faktor kvantitativ model, der identificerer virksomheder med de højeste niveauer af institutionel akkumulering. Scoringsmodellen bruger en kombination af den samlede stigning i oplyste ejere, ændringerne i porteføljeallokeringer i disse ejere og andre målinger. Tallet går fra 0 til 100, hvor højere tal indikerer et højere niveau af akkumulering for sine jævnaldrende, og 50 er gennemsnittet.
Opdateringsfrekvens: Dagligt
Se Ownership Explorer, som giver en liste over højest rangerende virksomheder.
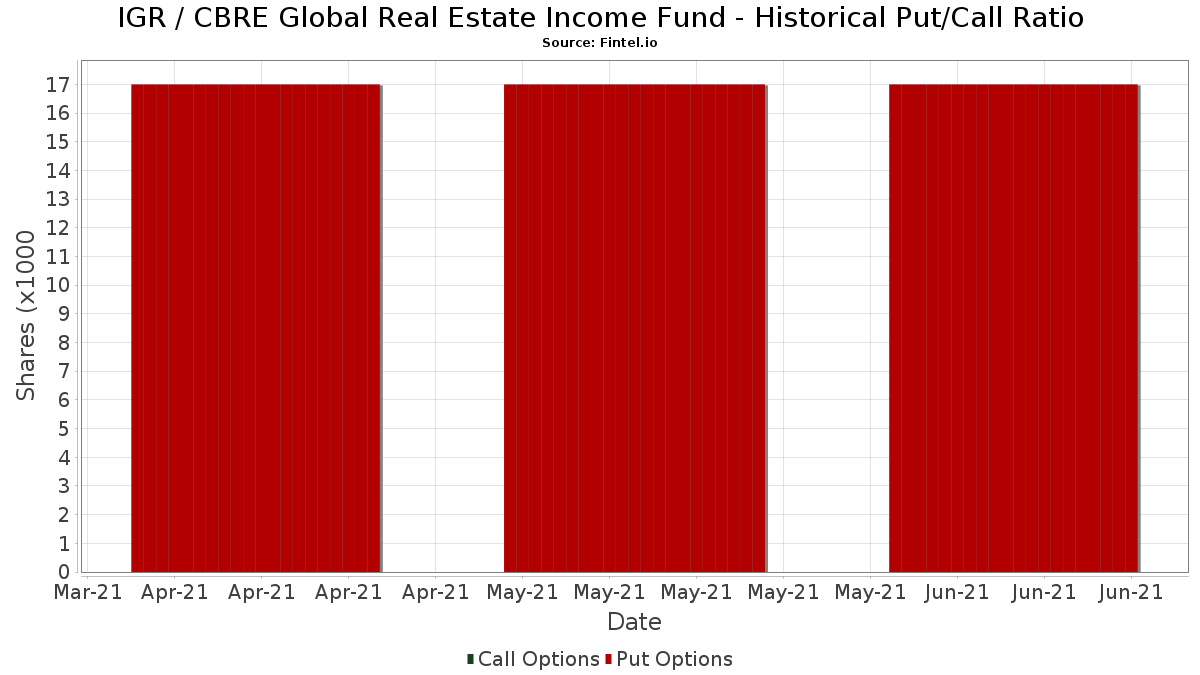
Institutionel Put/Call-forhold
Ud over at indberette standardaktie- og gældsudstedelser skal institutter med mere end 100 mill. aktiver under forvaltning også oplyse deres put- og call-optionsbeholdninger. Da salgsoptioner generelt indikerer negativ stemning, og købsoptioner indikerer positiv stemning, kan vi få en fornemmelse af den overordnede institutionelle stemning ved at plotte forholdet mellem put og kald. Diagrammet til højre viser det historiske put/call-forhold for dette instrument.
Brug af Put/Call Ratio som en indikator for investorernes stemning overvinder en af de vigtigste mangler ved at bruge totalt institutionelt ejerskab, som er, at en betydelig mængde af aktiver under forvaltning investeres passivt for at spore indekser. Passivt forvaltede fonde køber typisk ikke optioner, så indikatoren for put/call-forholdet følger mere nøje følelsen af aktivt forvaltede fonde.
13F og NPORT arkivering
Detaljer om 13F-arkivering er gratis. Detaljer om NP-ansøgninger kræver et premium-medlemskab. Grønne rækker angiver nye positioner. Røde rækker angiver lukkede positioner. Klik på linket ikon for at se den fulde transaktionshistorik.
Opgrader
for at låse premium-data op og eksportere til Excel ![]() .
.
| Fil dato | Kilde | Investor | Type | Gennemsnitlig pris (Øst) |
Aktier | Δ Aktier (%) |
Rapporteret Værdi ($1000) |
Δ Værdi (%) |
Port Alloc (%) |
|
|---|---|---|---|---|---|---|---|---|---|---|
| 2025-08-11 | 13F | Private Advisor Group, LLC | 14.953 | 0,00 | 79 | 2,60 | ||||
| 2025-08-07 | 13F | Kestra Private Wealth Services, Llc | 24.600 | 0,00 | 130 | 3,17 | ||||
| 2025-05-08 | 13F | Harbour Investments, Inc. | 0 | -100,00 | 0 | |||||
| 2025-05-08 | 13F | XTX Topco Ltd | 0 | -100,00 | 0 | |||||
| 2025-08-01 | 13F | Transcend Wealth Collective, Llc | 0 | -100,00 | 0 | |||||
| 2025-08-06 | 13F | Golden State Wealth Management, LLC | 900 | 0,00 | 5 | 0,00 | ||||
| 2025-08-14 | 13F | IHT Wealth Management, LLC | 97.489 | -0,96 | 516 | 1,58 | ||||
| 2025-07-11 | 13F | Seacrest Wealth Management, Llc | 42.345 | 7,77 | 224 | 10,89 | ||||
| 2025-08-14 | 13F | Royal Bank Of Canada | 479.852 | 31,38 | 2.538 | 34,64 | ||||
| 2025-08-07 | 13F | Samalin Investment Counsel, LLC | 90.111 | 2,12 | 477 | 4,62 | ||||
| 2025-08-14 | 13F | Mercer Global Advisors Inc /adv | 0 | -100,00 | 0 | |||||
| 2025-08-13 | 13F | Rsm Us Wealth Management Llc | 76.339 | -10,17 | 404 | -7,99 | ||||
| 2025-07-18 | 13F | Cooper Financial Group | 236.055 | 3,12 | 1.249 | 5,67 | ||||
| 2025-08-18 | 13F | Geneos Wealth Management Inc. | 40.688 | -13,00 | 215 | -10,79 | ||||
| 2025-07-22 | 13F | Merit Financial Group, LLC | 78.690 | 33,71 | 416 | 37,29 | ||||
| 2025-07-18 | 13F | SOA Wealth Advisors, LLC. | 174 | 3,57 | 1 | |||||
| 2025-05-13 | 13F | HighTower Advisors, LLC | 0 | -100,00 | 0 | -100,00 | ||||
| 2025-07-09 | 13F | Sunpointe, LLC | 84.900 | 449 | ||||||
| 2025-08-05 | 13F | Pacific Wealth Strategies Group, Inc. | 635.083 | -10,06 | 3.074 | -15,65 | ||||
| 2025-08-14 | 13F | Stifel Financial Corp | 225.100 | 1,94 | 1.191 | 4,48 | ||||
| 2025-08-14 | 13F | Ameriprise Financial Inc | 945.863 | 5,35 | 5.004 | 8,03 | ||||
| 2025-07-21 | 13F | Future Financial Wealth Managment LLC | 10.000 | 0,00 | 53 | 1,96 | ||||
| 2025-08-12 | 13F | LPL Financial LLC | 943.534 | 11,16 | 4.991 | 13,98 | ||||
| 2025-08-04 | 13F | Spire Wealth Management | 523 | 0,00 | 3 | 0,00 | ||||
| 2025-08-12 | 13F | Jpmorgan Chase & Co | 0 | -100,00 | 0 | |||||
| 2025-07-14 | 13F | Pacifica Partners Inc. | 550 | 0,00 | 3 | 0,00 | ||||
| 2025-08-11 | 13F | One Capital Management, LLC | 13.552 | 0,00 | 72 | 2,90 | ||||
| 2025-08-12 | 13F | Coldstream Capital Management Inc | 0 | -100,00 | 0 | |||||
| 2025-08-13 | 13F | Colonial Trust Advisors | 2.750 | 15 | ||||||
| 2025-08-19 | 13F | National Asset Management, Inc. | 21.093 | 1,34 | 112 | 11,00 | ||||
| 2025-08-15 | 13F | Prevail Innovative Wealth Advisors, Llc | 316.674 | 11,55 | 1.675 | 14,41 | ||||
| 2025-08-11 | 13F | PFG Private Wealth Management, LLC | 0 | -100,00 | 0 | |||||
| 2025-07-10 | 13F | Stolper Co | 105.933 | 8,33 | 1 | |||||
| 2025-08-14 | 13F | EP Wealth Advisors, Inc. | 35.249 | 0,00 | 186 | 2,76 | ||||
| 2025-07-16 | 13F | Investment Partners Asset Management, Inc. | 173.024 | -0,21 | 915 | 2,35 | ||||
| 2025-07-25 | 13F | Cwm, Llc | 3.621 | 0,00 | 0 | |||||
| 2025-08-14 | 13F | Mariner, LLC | 85.415 | 3,60 | 452 | 6,12 | ||||
| 2025-08-14 | 13F | Moneta Group Investment Advisors Llc | 0 | -100,00 | 0 | |||||
| 2025-05-12 | 13F | Fmr Llc | 0 | -100,00 | 0 | |||||
| 2025-08-05 | 13F | Bank of New York Mellon Corp | 0 | -100,00 | 0 | |||||
| 2025-08-12 | 13F | Evelyn Partners Asset Management Ltd | 2.823 | 15 | ||||||
| 2025-08-14 | 13F | Two Sigma Securities, Llc | 0 | -100,00 | 0 | |||||
| 2025-08-04 | 13F | Flagship Harbor Advisors, Llc | 1.916.196 | 3,34 | 10.137 | 5,94 | ||||
| 2025-07-25 | 13F | Hazlett, Burt & Watson, Inc. | 1.000 | 0,00 | 0 | |||||
| 2025-05-13 | 13F | SFI Advisors, LLC | 0 | -100,00 | 0 | |||||
| 2025-07-31 | 13F | 180 Wealth Advisors, Llc | 165.457 | -0,37 | 875 | 2,58 | ||||
| 2025-08-13 | 13F | Fiduciary Group LLC | 15.953 | 6,50 | 84 | 9,09 | ||||
| 2025-08-14 | 13F | GWM Advisors LLC | 42.605 | 123,18 | 225 | 129,59 | ||||
| 2025-07-24 | 13F | Leo Wealth, LLC | 13.981 | 3,60 | 74 | 5,80 | ||||
| 2025-08-14 | 13F | Bank Of America Corp /de/ | 1.845.097 | 0,13 | 9.761 | 2,65 | ||||
| 2025-07-21 | 13F | Ameriflex Group, Inc. | 4.200 | -85,31 | 22 | -85,71 | ||||
| 2025-05-14 | 13F | Susquehanna International Group, Llp | 0 | -100,00 | 0 | |||||
| 2025-08-08 | 13F | Larson Financial Group LLC | 6.000 | 0,00 | 32 | 3,33 | ||||
| 2025-08-11 | 13F | Citigroup Inc | 2 | 0,00 | 0 | |||||
| 2025-08-15 | 13F | Captrust Financial Advisors | 39.877 | 211 | ||||||
| 2025-08-11 | 13F | Actinver Wealth Management, Inc. | 22.442 | 30,43 | 119 | 34,09 | ||||
| 2025-07-23 | 13F | Clear Creek Financial Management, LLC | 0 | -100,00 | 0 | |||||
| 2025-08-13 | 13F | Baird Financial Group, Inc. | 60.734 | -8,60 | 321 | -6,14 | ||||
| 2025-07-10 | 13F | Wealth Enhancement Advisory Services, Llc | 66.389 | -1,71 | 356 | 2,01 | ||||
| 2025-08-12 | 13F | MAI Capital Management | 1.286 | 365,94 | 7 | 500,00 | ||||
| 2025-08-13 | 13F | Guggenheim Capital Llc | 64.197 | -2,40 | 340 | 0,00 | ||||
| 2025-05-12 | 13F | Peapack Gladstone Financial Corp | 0 | -100,00 | 0 | |||||
| 2025-09-09 | 13F | NWF Advisory Services Inc. | 273.500 | -0,94 | 1.447 | 1,54 | ||||
| 2025-08-12 | 13F | J.w. Cole Advisors, Inc. | 431.757 | 2,81 | 2.284 | 5,35 | ||||
| 2025-08-07 | 13F | Addison Advisors LLC | 61 | 0,00 | 0 | |||||
| 2025-08-11 | 13F | Nations Financial Group Inc, /ia/ /adv | 14.436 | 0,00 | 76 | 2,70 | ||||
| 2025-08-18 | 13F/A | National Bank Of Canada /fi/ | 55.845 | 1.560,08 | 295 | 1.629,41 | ||||
| 2025-08-06 | 13F | Commonwealth Equity Services, Llc | 80.608 | -39,27 | 0 | |||||
| 2025-04-30 | 13F | Heritage Wealth Management, Inc. /CA/ | 0 | -100,00 | 0 | |||||
| 2025-07-07 | 13F | Nova Wealth Management, Inc. | 7.897 | 0,00 | 42 | 2,50 | ||||
| 2025-08-06 | 13F | AE Wealth Management LLC | 12.700 | 67 | ||||||
| 2025-04-16 | 13F | Caldwell Securities, Inc | 0 | -100,00 | 0 | |||||
| 2025-08-04 | 13F | Creative Financial Designs Inc /adv | 1.315 | 0,00 | 7 | 0,00 | ||||
| 2025-07-17 | 13F | Janney Montgomery Scott LLC | 53.273 | 0,61 | 0 | |||||
| 2025-08-13 | 13F | Northwestern Mutual Wealth Management Co | 7.766 | 41 | ||||||
| 2025-07-31 | 13F | Cambridge Investment Research Advisors, Inc. | 52.563 | -2,92 | 0 | |||||
| 2025-08-28 | NP | YYY - Amplify High Income ETF | 3.658.899 | 2,00 | 19.356 | 4,57 | ||||
| 2025-05-16 | 13F | Jones Financial Companies Lllp | 0 | -100,00 | 0 | |||||
| 2025-08-12 | 13F | Proequities, Inc. | 0 | 0 | ||||||
| 2025-04-24 | 13F | Decker Retirement Planning Inc. | 0 | -100,00 | 0 | |||||
| 2025-07-29 | 13F | Stephens Inc /ar/ | 10.278 | -2,59 | 54 | 0,00 | ||||
| 2025-08-04 | 13F | Assetmark, Inc | 144 | 0,00 | 1 | |||||
| 2025-07-30 | 13F | Blume Capital Management, Inc. | 3.000 | 0,00 | 16 | 0,00 | ||||
| 2025-05-14 | 13F | Landscape Capital Management, L.l.c. | 0 | -100,00 | 0 | |||||
| 2025-08-08 | 13F | Schwarz Dygos Wheeler Investment Advisors Llc | 291.921 | 8,65 | 1.544 | 11,40 | ||||
| 2025-07-25 | 13F | We Are One Seven, LLC | 18.336 | 9,93 | 97 | 11,63 | ||||
| 2025-07-30 | 13F | Roman Butler Fullerton & Co | 257.529 | 1,18 | 1.282 | 6,74 | ||||
| 2025-07-14 | 13F | Sowell Financial Services LLC | 11.798 | -55,79 | 62 | -54,74 | ||||
| 2025-05-19 | 13F/A | Jane Street Group, Llc | 0 | -100,00 | 0 | -100,00 | ||||
| 2025-07-14 | 13F | GAMMA Investing LLC | 12 | 0 | ||||||
| 2025-08-15 | 13F | Tower Research Capital LLC (TRC) | 45 | 0 | ||||||
| 2025-08-14 | 13F | CoreCap Advisors, LLC | 2.153 | 0,00 | 11 | 0,00 | ||||
| 2025-08-14 | 13F | Atomi Financial Group, Inc. | 100.808 | -0,67 | 533 | 1,91 | ||||
| 2025-08-14 | 13F | Comerica Bank | 31.339 | -9,92 | 166 | -7,82 | ||||
| 2025-04-14 | 13F | Daymark Wealth Partners, Llc | 0 | -100,00 | 0 | |||||
| 2025-07-17 | 13F/A | Capital Investment Advisors, LLC | 12.982 | -7,44 | 69 | -5,56 | ||||
| 2025-07-10 | 13F | Atticus Wealth Management, Llc | 7.340 | 41,05 | 39 | 46,15 | ||||
| 2025-07-25 | 13F | Atria Wealth Solutions, Inc. | 53.750 | 0,00 | 285 | 2,53 | ||||
| 2025-07-14 | 13F | Occidental Asset Management, LLC | 15.844 | -11,42 | 84 | -9,78 | ||||
| 2025-08-13 | 13F | Level Four Advisory Services, Llc | 14.409 | -35,90 | 76 | -33,91 | ||||
| 2025-05-14 | 13F | Walleye Capital LLC | 0 | -100,00 | 0 | |||||
| 2025-08-14 | 13F | Hrt Financial Lp | 0 | -100,00 | 0 | |||||
| 2025-08-11 | 13F | Elequin Capital Lp | 0 | -100,00 | 0 | |||||
| 2025-08-14 | 13F | Raymond James Financial Inc | 166.585 | 7,17 | 881 | 9,85 | ||||
| 2025-05-09 | 13F | Shaker Financial Services, LLC | 0 | -100,00 | 0 | |||||
| 2025-05-16 | 13F | Coppell Advisory Solutions LLC | 0 | -100,00 | 0 | |||||
| 2025-05-20 | 13F/A | Colony Group, LLC | 0 | -100,00 | 0 | -100,00 | ||||
| 2025-08-11 | 13F | United Capital Financial Advisers, Llc | 10.447 | 0,00 | 55 | 3,77 | ||||
| 2025-08-08 | 13F | Good Life Advisors, LLC | 14.181 | -0,43 | 75 | 2,74 | ||||
| 2025-08-13 | 13F | WealthTrust Axiom LLC | 352.815 | 0,18 | 1.866 | 2,70 | ||||
| 2025-09-04 | 13F/A | Advisor Group Holdings, Inc. | 506.876 | 4,21 | 2.681 | 6,86 | ||||
| 2025-08-12 | 13F | Steward Partners Investment Advisory, Llc | 13.104 | -24,86 | 69 | -22,47 | ||||
| 2025-07-10 | 13F | Kozak & Associates, Inc. | 1.931 | 10 | ||||||
| 2025-08-05 | 13F | Holistic Financial Partners | 14.440 | 0,00 | 76 | 2,70 | ||||
| 2025-08-14 | 13F | Ieq Capital, Llc | 20.141 | -6,07 | 107 | -3,64 | ||||
| 2025-08-11 | 13F | WPG Advisers, LLC | 7.261 | -30,72 | 38 | -29,63 | ||||
| 2025-07-14 | 13F | Park Avenue Securities Llc | 41.403 | -13,00 | 0 | |||||
| 2025-07-21 | 13F | Ameritas Advisory Services, LLC | 19.010 | 79,17 | 101 | 92,31 | ||||
| 2025-05-09 | 13F | Cornerstone Advisors, LLC | 0 | -100,00 | 0 | -100,00 | ||||
| 2025-07-24 | 13F | Us Bancorp \de\ | 45.074 | 0,00 | 238 | 2,59 | ||||
| 2025-08-07 | 13F | Allworth Financial LP | 1.809 | 3.073,68 | 10 | |||||
| 2025-08-12 | 13F | Advisors Asset Management, Inc. | 121.136 | -60,95 | 641 | -60,00 | ||||
| 2025-08-06 | 13F | Mark Sheptoff Financial Planning, Llc | 1.000 | 0,00 | 5 | 0,00 | ||||
| 2025-07-28 | 13F | Axxcess Wealth Management, Llc | 16.538 | -4,81 | 87 | -2,25 | ||||
| 2025-08-05 | 13F | Sigma Planning Corp | 19.820 | 1,11 | 105 | 2,97 | ||||
| 2025-08-01 | 13F | Envestnet Asset Management Inc | 21.237 | 112 | ||||||
| 2025-07-30 | 13F | Whittier Trust Co | 5 | 0 | ||||||
| 2025-07-15 | 13F | Highland Financial Advisors, LLC | 11.600 | 61 | ||||||
| 2025-07-31 | 13F | Leavell Investment Management, Inc. | 12.500 | 0,00 | 66 | 3,13 | ||||
| 2025-08-29 | 13F | Centaurus Financial, Inc. | 0 | -100,00 | 0 | |||||
| 2025-07-29 | 13F | Private Trust Co Na | 1.000 | 0,00 | 5 | 0,00 | ||||
| 2025-07-25 | 13F | GFS Advisors, LLC | 0 | -100,00 | 0 | |||||
| 2025-08-06 | 13F | Moors & Cabot, Inc. | 73.113 | 2,48 | 387 | 4,89 | ||||
| 2025-08-12 | 13F | Global Retirement Partners, LLC | 22.286 | 0,02 | 118 | 9,35 | ||||
| 2025-05-02 | 13F | BlackRock, Inc. | 0 | -100,00 | 0 | |||||
| 2025-08-11 | 13F | Principal Securities, Inc. | 1.576 | 88,07 | 8 | 100,00 | ||||
| 2025-05-12 | 13F | Wolverine Asset Management Llc | 0 | -100,00 | 0 | |||||
| 2025-04-23 | 13F | Walkner Condon Financial Advisors LLC | 0 | -100,00 | 0 | |||||
| 2025-08-08 | 13F | Pnc Financial Services Group, Inc. | 36.662 | -21,09 | 194 | -19,25 | ||||
| 2025-08-15 | 13F | Morgan Stanley | 10.482.631 | -8,82 | 55.453 | -6,52 | ||||
| 2025-08-08 | 13F | Cetera Investment Advisers | 386.511 | 11,62 | 2.045 | 14,45 | ||||
| 2025-08-11 | 13F | Alteri Wealth LLC | 49.327 | 0,00 | 261 | 2,36 | ||||
| 2025-08-05 | 13F | Burney Co/ | 25.437 | 3,20 | 135 | 5,51 | ||||
| 2025-08-14 | 13F | Wells Fargo & Company/mn | 1.585.773 | 3,01 | 8.389 | 5,60 | ||||
| 2025-08-14 | 13F | UBS Group AG | 5.346.993 | -0,09 | 28.286 | 2,43 | ||||
| 2025-08-04 | 13F | Live Oak Private Wealth LLC | 54.884 | 0,00 | 290 | 2,47 | ||||
| 2025-08-05 | 13F | Tsfg, Llc | 1.500 | 0,00 | 0 | |||||
| 2025-05-06 | 13F | Readystate Asset Management Lp | 0 | -100,00 | 0 | -100,00 | ||||
| 2025-07-07 | 13F | Centurion Wealth Management LLC | 10.295 | 0,00 | 54 | 10,20 | ||||
| 2025-08-14 | 13F/A | Rockefeller Capital Management L.P. | 199.200 | 33,58 | 1.054 | 36,93 | ||||
| 2025-07-21 | 13F | Quattro Financial Advisors Llc | 40.291 | 0,00 | 213 | 2,90 | ||||
| 2025-08-06 | 13F | Penserra Capital Management LLC | 3.696.579 | 3,05 | 20 | 5,56 |