Grundlæggende statistik
| Institutionelle ejere | 56 total, 56 long only, 0 short only, 0 long/short - change of 9,80% MRQ |
| Gennemsnitlig porteføljeallokering | 0.0198 % - change of 7,19% MRQ |
| Institutionelle aktier (lange) | 2.084.706 (ex 13D/G) - change of 0,02MM shares 0,83% MRQ |
| Institutionel værdi (lang) | $ 53.274 USD ($1000) |
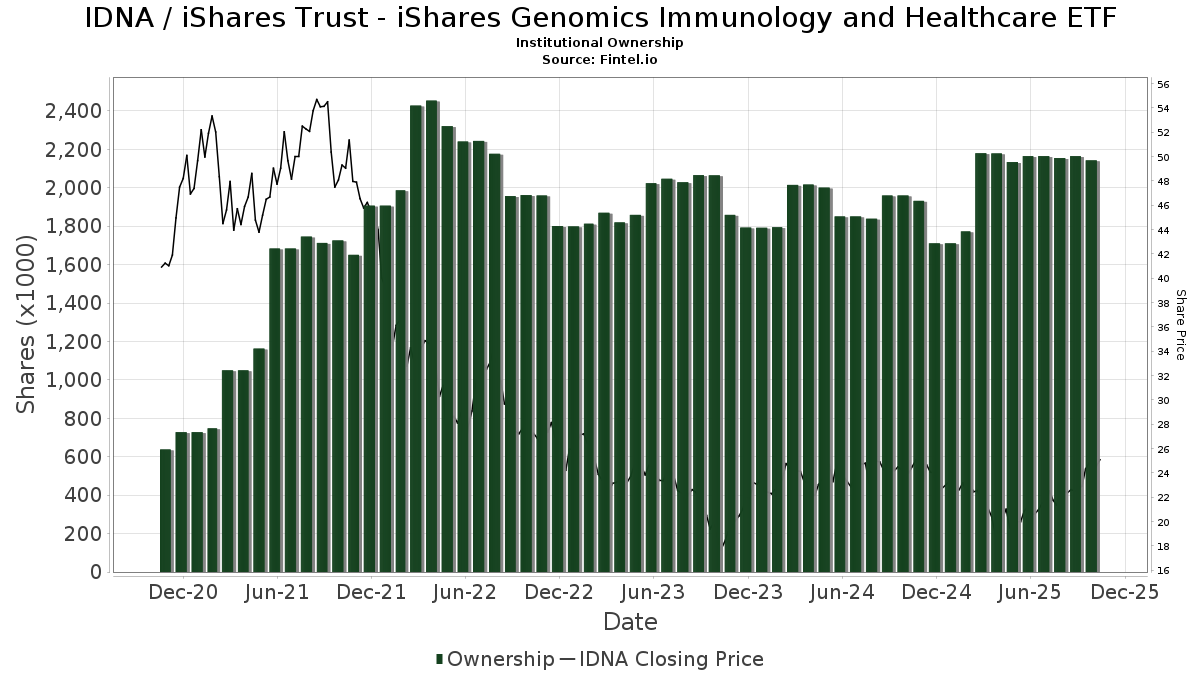
Institutionelt ejerskab og aktionærer
iShares Trust - iShares Genomics Immunology and Healthcare ETF (US:IDNA) har 56 institutionelle ejere og aktionærer, der har indsendt 13D/G- eller 13F-formularer til Securities Exchange Commission (SEC). Disse institutioner har i alt 2,084,706 aktier. Største aktionærer omfatter UBS Group AG, Bank Of America Corp /de/, Wharton Business Group, LLC, Raymond James Financial Inc, Portland Global Advisors LLC, Ameriprise Financial Inc, LPL Financial LLC, Morgan Stanley, Royal Bank Of Canada, and Jane Street Group, Llc .
iShares Trust - iShares Genomics Immunology and Healthcare ETF (ARCA:IDNA) institutionel ejerskabsstruktur viser aktuelle positioner i virksomheden efter institutioner og fonde, samt seneste ændringer i positionsstørrelse. Større aktionærer kan omfatte individuelle investorer, investeringsforeninger, hedgefonde eller institutioner. Skema 13D angiver, at investoren besidder (eller besidder) mere end 5 % af virksomheden og har til hensigt (eller har til hensigt at) aktivt at forfølge en ændring i forretningsstrategi. Skema 13G indikerer en passiv investering på over 5%.
The share price as of March 16, 2026 is 29,46 / share. Previously, on March 17, 2025, the share price was 22,18 / share. This represents an increase of 32,82% over that period.
Fondens stemningsscore
Fund Sentiment Score (fka Ownership Accumulation Score) finder de aktier, der bliver mest købt af fonde. Det er resultatet af en sofistikeret, multi-faktor kvantitativ model, der identificerer virksomheder med de højeste niveauer af institutionel akkumulering. Scoringsmodellen bruger en kombination af den samlede stigning i oplyste ejere, ændringerne i porteføljeallokeringer i disse ejere og andre målinger. Tallet går fra 0 til 100, hvor højere tal indikerer et højere niveau af akkumulering for sine jævnaldrende, og 50 er gennemsnittet.
Opdateringsfrekvens: Dagligt
Se Ownership Explorer, som giver en liste over højest rangerende virksomheder.
AI+ Ask Fintel’s AI assistant about iShares Trust - iShares Genomics Immunology and Healthcare ETF.
Select a question to share a public post with an AI-crafted answer.
Thinking of good questions…
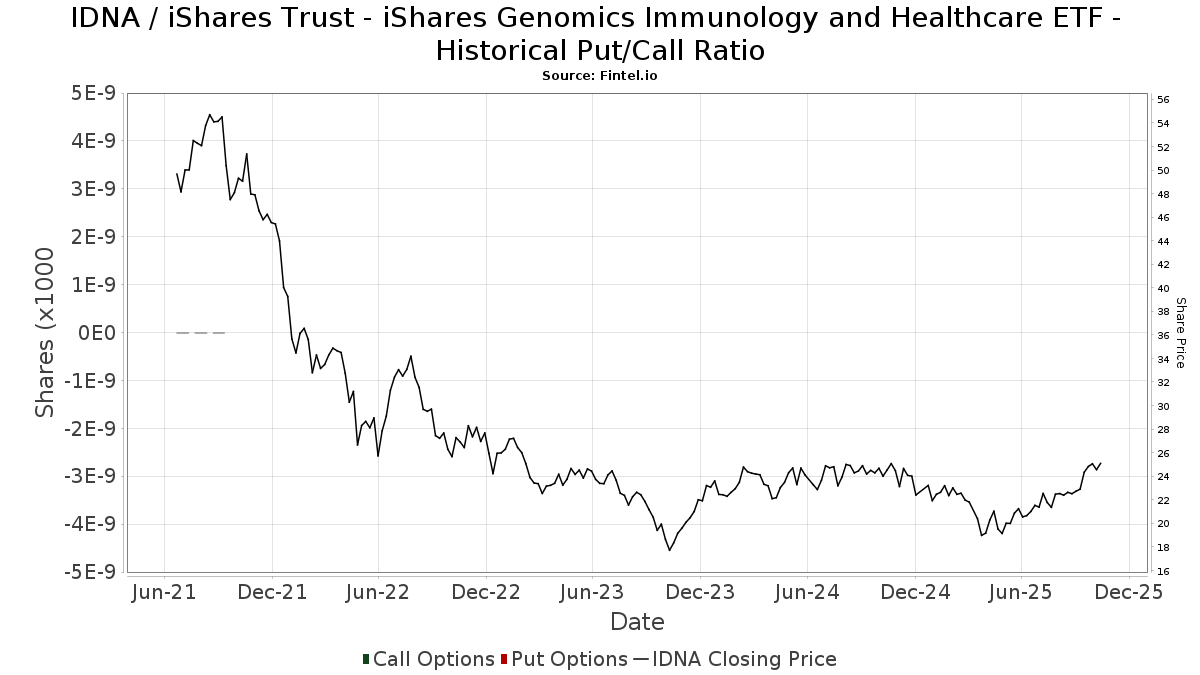
Institutionel Put/Call-forhold
Ud over at indberette standardaktie- og gældsudstedelser skal institutter med mere end 100 mill. aktiver under forvaltning også oplyse deres put- og call-optionsbeholdninger. Da salgsoptioner generelt indikerer negativ stemning, og købsoptioner indikerer positiv stemning, kan vi få en fornemmelse af den overordnede institutionelle stemning ved at plotte forholdet mellem put og kald. Diagrammet til højre viser det historiske put/call-forhold for dette instrument.
Brug af Put/Call Ratio som en indikator for investorernes stemning overvinder en af de vigtigste mangler ved at bruge totalt institutionelt ejerskab, som er, at en betydelig mængde af aktiver under forvaltning investeres passivt for at spore indekser. Passivt forvaltede fonde køber typisk ikke optioner, så indikatoren for put/call-forholdet følger mere nøje følelsen af aktivt forvaltede fonde.
13F og NPORT arkivering
Detaljer om 13F-arkivering er gratis. Detaljer om NP-ansøgninger kræver et premium-medlemskab. Grønne rækker angiver nye positioner. Røde rækker angiver lukkede positioner. Klik på linket ikon for at se den fulde transaktionshistorik.
Opgrader
for at låse premium-data op og eksportere til Excel ![]() .
.
| Fil dato | Kilde | Investor | Type | Gennemsnitlig pris (Øst) |
Aktier | Δ Aktier (%) |
Rapporteret Værdi ($1000) |
Δ Værdi (%) |
Port Alloc (%) |
|
|---|---|---|---|---|---|---|---|---|---|---|
| 2026-02-17 | 13F | Cetera Investment Advisers | 14.443 | 25,04 | 378 | 38,97 | ||||
| 2026-02-17 | 13F | Jones Financial Companies Lllp | 19.496 | 43,08 | 511 | 65,05 | ||||
| 2026-02-17 | 13F | Bank Of America Corp /de/ | 346.705 | 20,31 | 9.080 | 33,45 | ||||
| 2026-02-10 | 13F | Lido Advisors, LLC | 31.691 | 0,08 | 748 | 0,13 | ||||
| 2026-02-17 | 13F | Qube Research & Technologies Ltd | 330 | 9 | ||||||
| 2026-02-12 | 13F | Commonwealth Equity Services, Llc | 27.855 | -1,19 | 730 | |||||
| 2025-11-07 | 13F | Cora Capital Advisors Llc | 0 | -100,00 | 0 | |||||
| 2026-02-13 | 13F | Morgan Stanley | 62.518 | 13,02 | 1.637 | 25,34 | ||||
| 2026-01-23 | 13F | Farther Finance Advisors, LLC | 257 | 42,78 | 7 | 50,00 | ||||
| 2026-02-17 | 13F | Opal Capital Llc | 6.550 | 604 | ||||||
| 2026-02-12 | 13F | Jane Street Group, Llc | 52.452 | 2,41 | 1.374 | 13,56 | ||||
| 2026-01-20 | 13F | C2P Capital Advisory Group, LLC d.b.a. Prosperity Capital Advisors | 24.012 | -2,05 | 629 | 8,65 | ||||
| 2026-02-13 | 13F | 1 North Wealth Services Llc | 85 | 0,00 | 2 | 0,00 | ||||
| 2026-02-13 | 13F | Resources Investment Advisors, LLC. | 7.835 | 205 | ||||||
| 2026-01-06 | 13F | Nelson, Van Denburg & Campbell Wealth Management Group, LLC | 26.154 | -8,15 | 685 | 1,79 | ||||
| 2026-01-26 | 13F | AE Wealth Management LLC | 0 | -100,00 | 0 | |||||
| 2026-02-13 | 13F | Ally Invest Advisors Inc. | 8.311 | -13,02 | 218 | -3,56 | ||||
| 2025-10-23 | 13F | Evolution Wealth Management Inc. | 0 | -100,00 | 0 | |||||
| 2026-02-13 | 13F | Pacific Center for Financial Services | 550 | 0,00 | 13 | 0,00 | ||||
| 2026-02-04 | 13F | Summit Wealth Group Llc / Co | 0 | -100,00 | 0 | -100,00 | ||||
| 2026-02-20 | 13F | Sunbelt Securities, Inc. | 1.000 | 0,00 | 26 | 13,04 | ||||
| 2026-01-22 | 13F | HHM Wealth Advisors, LLC | 135 | 0,00 | 4 | 0,00 | ||||
| 2026-02-13 | 13F | Mml Investors Services, Llc | 8.827 | 231 | ||||||
| 2026-01-16 | 13F | Matauro, Llc | 0 | -100,00 | 0 | |||||
| 2026-02-10 | 13F | Envestnet Asset Management Inc | 9.398 | 246 | ||||||
| 2026-02-13 | 13F | Wells Fargo & Company/mn | 23.546 | 42,08 | 617 | 57,54 | ||||
| 2026-01-23 | 13F | U.S. Capital Wealth Advisors, LLC | 0 | -100,00 | 0 | -100,00 | ||||
| 2026-02-17 | 13F | Ameriprise Financial Inc | 100.267 | 40,29 | 2.626 | 55,60 | ||||
| 2026-02-17 | 13F | Raymond James Financial Inc | 140.424 | -5,19 | 3.678 | 5,15 | ||||
| 2026-02-12 | 13F | Triumph Capital Management | 1.263 | -14,72 | 33 | -2,94 | ||||
| 2026-02-06 | 13F | Pnc Financial Services Group, Inc. | 100 | 0,00 | 3 | 0,00 | ||||
| 2026-02-17 | 13F | Susquehanna International Group, Llp | 12.655 | 331 | ||||||
| 2026-02-17 | 13F | Royal Bank Of Canada | 60.855 | -14,39 | 1.594 | -5,01 | ||||
| 2026-02-09 | 13F | Clearwater Capital Advisors, LLC | 37.825 | -14,38 | 991 | -5,08 | ||||
| 2026-02-02 | 13F | Opes Wealth Management LLC | 14.445 | 0,00 | 378 | 10,85 | ||||
| 2026-02-11 | 13F | LPL Financial LLC | 63.448 | 27,52 | 1.662 | 41,48 | ||||
| 2026-02-05 | 13F | Allworth Financial LP | 40 | 1 | ||||||
| 2026-02-10 | 13F | Portland Global Advisors LLC | 103.004 | -0,00 | 2.698 | 10,90 | ||||
| 2026-02-13 | 13F | Golden State Wealth Management, LLC | 78 | 0,00 | 2 | 100,00 | ||||
| 2026-02-10 | 13F | Tidemark, LLC | 1.397 | 0,14 | 37 | 12,50 | ||||
| 2026-02-13 | 13F | SRS Capital Advisors, Inc. | 0 | -100,00 | 0 | |||||
| 2026-02-12 | 13F | Rossby Financial, LCC | 56 | -12,50 | 1 | 0,00 | ||||
| 2026-02-13 | 13F | Kestra Advisory Services, LLC | 2.963 | 78 | ||||||
| 2026-02-13 | 13F | Flow Traders U.s. Llc | 41.395 | 49,35 | 1 | |||||
| 2026-02-09 | 13F | Blue Bell Private Wealth Management, Llc | 55 | 0,00 | 1 | 0,00 | ||||
| 2026-01-30 | 13F | Archer Investment Corp | 248 | 0,00 | 6 | 20,00 | ||||
| 2026-02-11 | 13F | Wharton Business Group, LLC | 273.147 | -4,42 | 7.154 | 6,00 | ||||
| 2026-02-11 | 13F | Prudential Plc | 14.700 | -26,50 | 385 | -18,64 | ||||
| 2026-02-11 | 13F | Parallel Advisors, LLC | 200 | 5 | ||||||
| 2025-11-12 | 13F | Simplex Trading, Llc | 0 | -100,00 | 0 | |||||
| 2026-01-09 | 13F | First Heartland Consultants, Inc. | 8.722 | 0,51 | 228 | 11,76 | ||||
| 2026-02-12 | 13F | Principal Securities, Inc. | 0 | -100,00 | 0 | -100,00 | ||||
| 2026-01-28 | 13F | Geneos Wealth Management Inc. | 165 | 0,61 | 4 | 33,33 | ||||
| 2026-02-12 | 13F | Federation des caisses Desjardins du Quebec | 300 | 0,00 | 8 | 0,00 | ||||
| 2026-02-12 | 13F | Founders Financial Alliance, LLC | 3.412 | 0,35 | 89 | 11,25 | ||||
| 2026-02-10 | 13F | Murphy & Mullick Capital Management Corp | 275 | 0,00 | 7 | 16,67 | ||||
| 2026-02-06 | 13F | IFP Advisors, Inc | 291 | 0,00 | 8 | 16,67 | ||||
| 2026-02-17 | 13F | Advisor Group Holdings, Inc. | 8.720 | 11,71 | 228 | 25,27 | ||||
| 2026-01-29 | 13F | UBS Group AG | 485.985 | -13,19 | 12.728 | -3,73 | ||||
| 2026-02-17 | 13F | Citadel Advisors Llc | 11.490 | -52,62 | 301 | -47,55 | ||||
| 2026-02-14 | 13F | Rockefeller Capital Management L.P. | 2.322 | 12,12 | 61 | 25,00 | ||||
| 2026-02-05 | 13F | Cambridge Investment Research Advisors, Inc. | 21.494 | -13,90 | 1 | |||||
| 2026-02-05 | 13F | AlphaCore Capital LLC | 1 | 0 | ||||||
| 2026-02-10 | 13F/A | Northwestern Mutual Wealth Management Co | 520 | 14 | ||||||
| 2026-02-12 | 13F | Bank Of Montreal /can/ | 0 | -100,00 | 0 | |||||
| 2026-01-29 | 13F | Comerica Bank | 294 | 8 | ||||||
| 2025-11-06 | 13F | Ameritas Advisory Services, LLC | 0 | -100,00 | 0 | |||||
| 2026-02-12 | 13F | Wealthspire Advisors, LLC | 0 | -100,00 | 0 |