Grundlæggende statistik
| Institutionelle ejere | 89 total, 89 long only, 0 short only, 0 long/short - change of 15,38% MRQ |
| Gennemsnitlig porteføljeallokering | 0.4077 % - change of -8,52% MRQ |
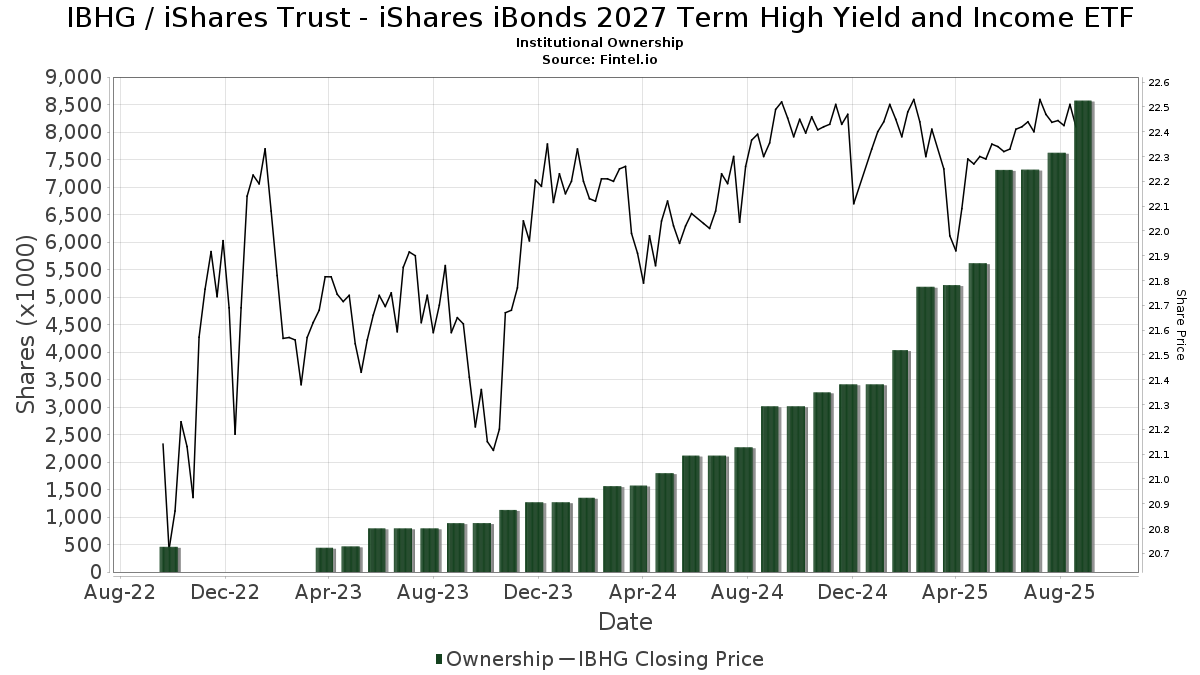
| Institutionelle aktier (lange) | 8.575.645 (ex 13D/G) - change of 1,26MM shares 17,24% MRQ |
| Institutionel værdi (lang) | $ 182.646 USD ($1000) |
Institutionelt ejerskab og aktionærer
iShares Trust - iShares iBonds 2027 Term High Yield and Income ETF (US:IBHG) har 89 institutionelle ejere og aktionærer, der har indsendt 13D/G- eller 13F-formularer til Securities Exchange Commission (SEC). Disse institutioner har i alt 8,575,645 aktier. Største aktionærer omfatter Lbmc Investment Advisors, Llc, Advisor Group Holdings, Inc., Northwestern Mutual Wealth Management Co, Wells Fargo & Company/mn, Keeler THomas Management LLC, LPL Financial LLC, Commonwealth Equity Services, Llc, HighTower Advisors, LLC, Commonwealth Financial Services, LLC, and Mutual Advisors, LLC .
iShares Trust - iShares iBonds 2027 Term High Yield and Income ETF (BATS:IBHG) institutionel ejerskabsstruktur viser aktuelle positioner i virksomheden efter institutioner og fonde, samt seneste ændringer i positionsstørrelse. Større aktionærer kan omfatte individuelle investorer, investeringsforeninger, hedgefonde eller institutioner. Skema 13D angiver, at investoren besidder (eller besidder) mere end 5 % af virksomheden og har til hensigt (eller har til hensigt at) aktivt at forfølge en ændring i forretningsstrategi. Skema 13G indikerer en passiv investering på over 5%.
The share price as of September 9, 2025 is 22,41 / share. Previously, on September 9, 2024, the share price was 22,34 / share. This represents an increase of 0,31% over that period.
Fondens stemningsscore
Fund Sentiment Score (fka Ownership Accumulation Score) finder de aktier, der bliver mest købt af fonde. Det er resultatet af en sofistikeret, multi-faktor kvantitativ model, der identificerer virksomheder med de højeste niveauer af institutionel akkumulering. Scoringsmodellen bruger en kombination af den samlede stigning i oplyste ejere, ændringerne i porteføljeallokeringer i disse ejere og andre målinger. Tallet går fra 0 til 100, hvor højere tal indikerer et højere niveau af akkumulering for sine jævnaldrende, og 50 er gennemsnittet.
Opdateringsfrekvens: Dagligt
Se Ownership Explorer, som giver en liste over højest rangerende virksomheder.
Institutionel Put/Call-forhold
Ud over at indberette standardaktie- og gældsudstedelser skal institutter med mere end 100 mill. aktiver under forvaltning også oplyse deres put- og call-optionsbeholdninger. Da salgsoptioner generelt indikerer negativ stemning, og købsoptioner indikerer positiv stemning, kan vi få en fornemmelse af den overordnede institutionelle stemning ved at plotte forholdet mellem put og kald. Diagrammet til højre viser det historiske put/call-forhold for dette instrument.
Brug af Put/Call Ratio som en indikator for investorernes stemning overvinder en af de vigtigste mangler ved at bruge totalt institutionelt ejerskab, som er, at en betydelig mængde af aktiver under forvaltning investeres passivt for at spore indekser. Passivt forvaltede fonde køber typisk ikke optioner, så indikatoren for put/call-forholdet følger mere nøje følelsen af aktivt forvaltede fonde.
13F og NPORT arkivering
Detaljer om 13F-arkivering er gratis. Detaljer om NP-ansøgninger kræver et premium-medlemskab. Grønne rækker angiver nye positioner. Røde rækker angiver lukkede positioner. Klik på linket ikon for at se den fulde transaktionshistorik.
Opgrader
for at låse premium-data op og eksportere til Excel ![]() .
.
| Fil dato | Kilde | Investor | Type | Gennemsnitlig pris (Øst) |
Aktier | Δ Aktier (%) |
Rapporteret Værdi ($1000) |
Δ Værdi (%) |
Port Alloc (%) |
|
|---|---|---|---|---|---|---|---|---|---|---|
| 2025-08-08 | 13F | Wrapmanager Inc | 50.879 | 1,53 | 1.147 | 2,50 | ||||
| 2025-07-29 | 13F | Stratos Wealth Partners, LTD. | 24.690 | 1,53 | 557 | 2,58 | ||||
| 2025-08-13 | 13F | Lido Advisors, LLC | 97.198 | -4,58 | 2.191 | -3,69 | ||||
| 2025-07-11 | 13F | Windsor Capital Management, LLC | 12.041 | -3,59 | 271 | -2,52 | ||||
| 2025-08-08 | 13F | Marble Harbor Investment Counsel, LLC | 17.730 | -10,01 | 400 | -9,11 | ||||
| 2025-08-11 | 13F | VSM Wealth Advisory, LLC | 398 | 0,00 | 9 | 0,00 | ||||
| 2025-07-24 | 13F | Robertson Stephens Wealth Management, LLC | 0 | -100,00 | 0 | |||||
| 2025-08-14 | 13F | Wells Fargo & Company/mn | 491.462 | 0,44 | 11.078 | 1,41 | ||||
| 2025-08-06 | 13F | Commonwealth Equity Services, Llc | 384.009 | -1,29 | 9 | 0,00 | ||||
| 2025-08-14 | 13F | Jane Street Group, Llc | 21.816 | -83,08 | 492 | -82,94 | ||||
| 2025-07-28 | 13F | Harbour Investments, Inc. | 570 | 2,15 | 13 | 0,00 | ||||
| 2025-08-14 | 13F | GWM Advisors LLC | 132.171 | -20,80 | 2.979 | -20,03 | ||||
| 2025-08-14 | 13F | Headinvest, Llc | 36.300 | -2,68 | 818 | -1,68 | ||||
| 2025-08-12 | 13F | Landing Point Financial Group, LLC | 22.271 | -51,39 | 502 | -50,98 | ||||
| 2025-07-22 | 13F | BridgePort Financial Solutions, LLC | 61.498 | -1,97 | 1.386 | -1,00 | ||||
| 2025-08-05 | 13F | Sigma Planning Corp | 35.007 | 5,92 | 789 | 7,06 | ||||
| 2025-08-11 | 13F | Principal Securities, Inc. | 902 | 0,00 | 20 | 0,00 | ||||
| 2025-08-15 | 13F | Captrust Financial Advisors | 11.921 | -28,15 | 269 | -27,57 | ||||
| 2025-08-19 | 13F | Advisory Services Network, LLC | 78.384 | 0,20 | 1.763 | 0,97 | ||||
| 2025-07-24 | 13F | Ronald Blue Trust, Inc. | 840 | 1,69 | 19 | 0,00 | ||||
| 2025-07-25 | 13F | Cwm, Llc | 1.840 | -11,62 | 0 | |||||
| 2025-08-11 | 13F | Summit Wealth Partners, LLC | 0 | -100,00 | 0 | |||||
| 2025-08-14 | 13F | Comerica Bank | 4.257 | -1,87 | 96 | -1,04 | ||||
| 2025-08-27 | 13F/A | Brinker Capital Investments, LLC | 54.572 | 6,48 | 1.230 | 7,52 | ||||
| 2025-08-06 | 13F | AE Wealth Management LLC | 37.928 | 5,55 | 855 | 6,48 | ||||
| 2025-07-24 | 13F/A | TFR Capital, LLC. | 11.086 | 250 | ||||||
| 2025-07-25 | 13F | Commonwealth Financial Services, LLC | 342.134 | 0,09 | 7.712 | 1,06 | ||||
| 2025-09-04 | 13F/A | Advisor Group Holdings, Inc. | 799.946 | 908,53 | 18.031 | 918,13 | ||||
| 2025-08-12 | 13F | Global Retirement Partners, LLC | 21.557 | 0,99 | 486 | 2,32 | ||||
| 2025-08-14 | 13F | UBS Group AG | 28.072 | -60,43 | 633 | -60,08 | ||||
| 2025-08-08 | 13F | Avantax Advisory Services, Inc. | 104.281 | 14,37 | 2.351 | 15,48 | ||||
| 2025-07-16 | 13F | Littlejohn Financial Services, Inc. | 12.239 | -9,49 | 276 | -8,64 | ||||
| 2025-08-05 | 13F | Cherry Tree Wealth Management, LLC | 225 | 0,00 | 5 | 0,00 | ||||
| 2025-08-14 | 13F | Fmr Llc | 65 | 1 | ||||||
| 2025-08-06 | 13F | Rialto Wealth Management, LLC | 9.038 | 12,72 | 204 | 13,41 | ||||
| 2025-08-13 | 13F | Beacon Pointe Advisors, LLC | 9.537 | -37,21 | 215 | -36,87 | ||||
| 2025-07-30 | 13F | Mid-American Wealth Advisory Group, Inc. | 1.120 | 25 | ||||||
| 2025-07-16 | 13F | Moisand Fitzgerald Tamayo, LLC | 800 | 0,00 | 18 | 5,88 | ||||
| 2025-08-01 | 13F | Envestnet Asset Management Inc | 13.016 | 293 | ||||||
| 2025-08-07 | 13F | Kestra Private Wealth Services, Llc | 87.051 | 9,05 | 1.962 | 10,10 | ||||
| 2025-07-17 | 13F | Baron Silver Stevens Financial Advisors, Llc | 12.739 | -15,81 | 287 | -14,84 | ||||
| 2025-08-12 | 13F | BlackRock, Inc. | 35.536 | -0,45 | 801 | 0,50 | ||||
| 2025-08-04 | 13F | Spire Wealth Management | 0 | -100,00 | 0 | |||||
| 2025-07-28 | 13F | Mutual Advisors, LLC | 299.434 | 1,72 | 6.733 | 2,61 | ||||
| 2025-08-13 | 13F | Northwestern Mutual Wealth Management Co | 778.916 | 1,06 | 17.557 | 2,03 | ||||
| 2025-05-14 | 13F | Van Hulzen Asset Management, LLC | 0 | -100,00 | 0 | |||||
| 2025-07-14 | 13F | GAMMA Investing LLC | 58.339 | -74,80 | 1.315 | -74,57 | ||||
| 2025-07-29 | 13F | Straight Path Wealth Management | 90.923 | 14,38 | 2.049 | 15,50 | ||||
| 2025-08-14 | 13F | Integrated Wealth Concepts LLC | 56.381 | 1,85 | 1.271 | 2,83 | ||||
| 2025-05-02 | 13F | Whittier Trust Co | 0 | -100,00 | 0 | |||||
| 2025-08-14 | 13F | 10Elms LLP | 4.757 | 0,00 | 107 | 0,94 | ||||
| 2025-07-23 | 13F | Ironwood Financial, llc | 54.159 | 0,00 | 1.209 | 0,00 | ||||
| 2025-08-14 | 13F | Stifel Financial Corp | 12.242 | 29,72 | 276 | 30,95 | ||||
| 2025-07-24 | 13F | IFP Advisors, Inc | 51.682 | -22,51 | 1.165 | -21,77 | ||||
| 2025-05-12 | 13F | C2P Capital Advisory Group, LLC d.b.a. Prosperity Capital Advisors | 0 | -100,00 | 0 | -100,00 | ||||
| 2025-08-26 | 13F/A | Thrivent Financial For Lutherans | 0 | -100,00 | 0 | |||||
| 2025-07-22 | 13F | Penobscot Investment Management Company, Inc. | 39.150 | 882 | ||||||
| 2025-08-01 | 13F | Austin Private Wealth, LLC | 23.347 | 29,52 | 526 | 30,85 | ||||
| 2025-07-31 | 13F | Keeler THomas Management LLC | 429.332 | 15,53 | 9.677 | 16,65 | ||||
| 2025-08-11 | 13F | Private Advisor Group, LLC | 19.173 | 38,76 | 432 | 40,26 | ||||
| 2025-08-08 | 13F | Thoroughbred Financial Services, Llc | 34.883 | -7,24 | 1 | |||||
| 2025-07-10 | 13F | Wealth Enhancement Advisory Services, Llc | 10.851 | 0,00 | 243 | 0,41 | ||||
| 2025-08-12 | 13F | Tableaux Llc | 3.185 | 426 | ||||||
| 2025-08-14 | 13F | EP Wealth Advisors, Inc. | 4.500 | 0,00 | 101 | 1,00 | ||||
| 2025-08-14 | 13F | Old Mission Capital Llc | 17.050 | 9,52 | 384 | 10,66 | ||||
| 2025-07-16 | 13F | Rebalance, Llc | 45.317 | 1,36 | 1.021 | 2,30 | ||||
| 2025-08-12 | 13F | Proequities, Inc. | 0 | 0 | ||||||
| 2025-08-14 | 13F | Bank Of America Corp /de/ | 219.592 | 1,05 | 4.950 | 2,02 | ||||
| 2025-08-06 | 13F | Summit Investment Advisors, Inc. | 97.610 | 8,05 | 2.185 | 8,87 | ||||
| 2025-08-12 | 13F | Boreal Capital Management LLC | 0 | 370 | ||||||
| 2025-05-15 | 13F/A | Orion Portfolio Solutions, LLC | 51.253 | 1.144 | ||||||
| 2025-08-14 | 13F | Hurley Capital, LLC | 27.990 | 261,58 | 631 | 266,28 | ||||
| 2025-06-23 | NP | LDRH - iShares iBonds 1-5 Year High Yield and Income Ladder ETF | 35.697 | 14,29 | 796 | 13,25 | ||||
| 2025-08-15 | 13F | Tower Research Capital LLC (TRC) | 35 | 1 | ||||||
| 2025-07-17 | 13F | Tempus Wealth Planning, LLC | 8.948 | 202 | ||||||
| 2025-08-19 | 13F | Newbridge Financial Services Group, Inc. | 1.580 | 0,00 | 36 | 0,00 | ||||
| 2025-08-12 | 13F | Steward Partners Investment Advisory, Llc | 888 | 20 | ||||||
| 2025-07-25 | 13F | Heartland Bank & Trust Co | 24.753 | 69,66 | 558 | 71,38 | ||||
| 2025-08-08 | 13F | Cetera Investment Advisers | 69.941 | -6,68 | 1.576 | -5,80 | ||||
| 2025-07-23 | 13F | High Note Wealth, LLC | 2.750 | 62 | ||||||
| 2025-04-22 | 13F | M3 Advisory Group, LLC | 0 | -100,00 | 0 | |||||
| 2025-08-12 | 13F | LPL Financial LLC | 406.036 | 44,73 | 9.152 | 46,13 | ||||
| 2025-08-13 | 13F | Baird Financial Group, Inc. | 14.436 | -0,50 | 325 | 0,62 | ||||
| 2025-08-14 | 13F | Royal Bank Of Canada | 50.503 | 5,92 | 1.138 | 6,95 | ||||
| 2025-07-10 | 13F | Klaas Financial Asset Advisors, LLC | 23.746 | -5,59 | 535 | -4,63 | ||||
| 2025-07-15 | 13F | Sightline Wealth Advisors, LLC | 69.284 | 2,37 | 1.562 | 3,38 | ||||
| 2025-08-12 | 13F | Jpmorgan Chase & Co | 2.085 | -20,63 | 47 | -20,69 | ||||
| 2025-08-14 | 13F | Mercer Global Advisors Inc /adv | 10.662 | 240 | ||||||
| 2025-08-11 | 13F | HighTower Advisors, LLC | 359.543 | -26,11 | 8.104 | -25,40 | ||||
| 2025-07-09 | 13F | Lbmc Investment Advisors, Llc | 1.165.621 | 35,99 | 26.273 | 37,30 | ||||
| 2025-07-31 | 13F | Cambridge Investment Research Advisors, Inc. | 62.926 | 6,56 | 1 | 0,00 | ||||
| 2025-07-08 | 13F | Parallel Advisors, LLC | 15.000 | 3,45 | 338 | 4,64 | ||||
| 2025-07-31 | 13F | Orion Capital Management LLC | 11.000 | 48,65 | 248 | 49,70 | ||||
| 2025-08-14 | 13F | Raymond James Financial Inc | 199.177 | 17,03 | 4.489 | 18,16 | ||||
| 2025-07-18 | 13F | Consolidated Portfolio Review Corp | 21.796 | 8,65 | 491 | 9,84 | ||||
| 2025-08-15 | 13F | Morgan Stanley | 239.382 | 56,17 | 5.396 | 57,66 | ||||
| 2025-08-05 | 13F | Bank Of Montreal /can/ | 1.794 | 40 | ||||||
| 2025-08-05 | 13F | Summit Investment Advisory Services, LLC | 93.176 | 2.100 | ||||||
| 2025-08-12 | 13F | J.w. Cole Advisors, Inc. | 187.694 | 4.231 |