Grundlæggende statistik
| Institutionelle ejere | 82 total, 82 long only, 0 short only, 0 long/short - change of 3,75% MRQ |
| Gennemsnitlig porteføljeallokering | 0.1229 % - change of 8,11% MRQ |
| Institutionelle aktier (lange) | 1.565.853 (ex 13D/G) - change of 0,18MM shares 13,09% MRQ |
| Institutionel værdi (lang) | $ 62.585 USD ($1000) |
Institutionelt ejerskab og aktionærer
iShares Trust - iShares ESG Advanced High Yield Corporate Bond ETF (US:HYXF) har 82 institutionelle ejere og aktionærer, der har indsendt 13D/G- eller 13F-formularer til Securities Exchange Commission (SEC). Disse institutioner har i alt 1,565,853 aktier. Største aktionærer omfatter SigFig Wealth Management, LLC, LPL Financial LLC, Colorado Capital Management, Inc., Commonwealth Equity Services, Llc, UBS Group AG, Balanced Rock Investment Advisor, Bank Of America Corp /de/, Impact Investors, Inc, Assetmark, Inc, and Advisor Group Holdings, Inc. .
iShares Trust - iShares ESG Advanced High Yield Corporate Bond ETF (NasdaqGM:HYXF) institutionel ejerskabsstruktur viser aktuelle positioner i virksomheden efter institutioner og fonde, samt seneste ændringer i positionsstørrelse. Større aktionærer kan omfatte individuelle investorer, investeringsforeninger, hedgefonde eller institutioner. Skema 13D angiver, at investoren besidder (eller besidder) mere end 5 % af virksomheden og har til hensigt (eller har til hensigt at) aktivt at forfølge en ændring i forretningsstrategi. Skema 13G indikerer en passiv investering på over 5%.
The share price as of March 6, 2026 is 46,56 / share. Previously, on March 10, 2025, the share price was 46,49 / share. This represents an increase of 0,15% over that period.

Fondens stemningsscore
Fund Sentiment Score (fka Ownership Accumulation Score) finder de aktier, der bliver mest købt af fonde. Det er resultatet af en sofistikeret, multi-faktor kvantitativ model, der identificerer virksomheder med de højeste niveauer af institutionel akkumulering. Scoringsmodellen bruger en kombination af den samlede stigning i oplyste ejere, ændringerne i porteføljeallokeringer i disse ejere og andre målinger. Tallet går fra 0 til 100, hvor højere tal indikerer et højere niveau af akkumulering for sine jævnaldrende, og 50 er gennemsnittet.
Opdateringsfrekvens: Dagligt
Se Ownership Explorer, som giver en liste over højest rangerende virksomheder.
AI+ Ask Fintel’s AI assistant about iShares Trust - iShares ESG Advanced High Yield Corporate Bond ETF.
Select a question to share a public post with an AI-crafted answer.
Thinking of good questions…
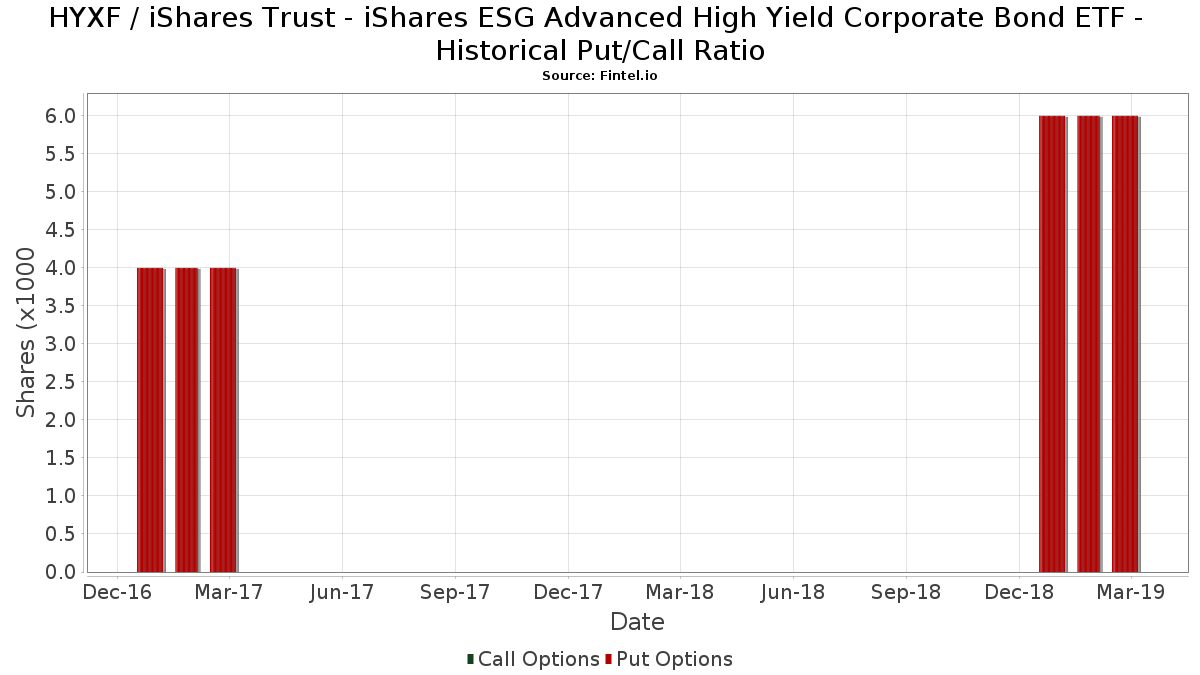
Institutionel Put/Call-forhold
Ud over at indberette standardaktie- og gældsudstedelser skal institutter med mere end 100 mill. aktiver under forvaltning også oplyse deres put- og call-optionsbeholdninger. Da salgsoptioner generelt indikerer negativ stemning, og købsoptioner indikerer positiv stemning, kan vi få en fornemmelse af den overordnede institutionelle stemning ved at plotte forholdet mellem put og kald. Diagrammet til højre viser det historiske put/call-forhold for dette instrument.
Brug af Put/Call Ratio som en indikator for investorernes stemning overvinder en af de vigtigste mangler ved at bruge totalt institutionelt ejerskab, som er, at en betydelig mængde af aktiver under forvaltning investeres passivt for at spore indekser. Passivt forvaltede fonde køber typisk ikke optioner, så indikatoren for put/call-forholdet følger mere nøje følelsen af aktivt forvaltede fonde.
13F og NPORT arkivering
Detaljer om 13F-arkivering er gratis. Detaljer om NP-ansøgninger kræver et premium-medlemskab. Grønne rækker angiver nye positioner. Røde rækker angiver lukkede positioner. Klik på linket ikon for at se den fulde transaktionshistorik.
Opgrader
for at låse premium-data op og eksportere til Excel ![]() .
.
| Fil dato | Kilde | Investor | Type | Gennemsnitlig pris (Øst) |
Aktier | Δ Aktier (%) |
Rapporteret Værdi ($1000) |
Δ Værdi (%) |
Port Alloc (%) |
|
|---|---|---|---|---|---|---|---|---|---|---|
| 2026-02-13 | 13F | Flow Traders U.s. Llc | 0 | -100,00 | 0 | |||||
| 2026-02-10 | 13F | One Capital Management, LLC | 18.753 | 5,56 | 886 | 5,10 | ||||
| 2026-02-10 | 13F | American Money Management, LLC | 9.024 | 426 | ||||||
| 2026-01-21 | 13F | Walkner Condon Financial Advisors LLC | 7.322 | -1,32 | 346 | -1,70 | ||||
| 2026-01-23 | 13F | Fifth Third Securities, Inc. | 4.917 | 2,20 | 232 | 1,75 | ||||
| 2026-02-05 | 13F | Allworth Financial LP | 18 | 0,00 | 1 | |||||
| 2026-02-12 | 13F | Moneta Group Investment Advisors Llc | 0 | -100,00 | 0 | |||||
| 2026-02-17 | 13F | Bank Of America Corp /de/ | 54.123 | 1,55 | 2.558 | 1,07 | ||||
| 2025-11-06 | 13F | Mandatum Life Insurance Co Ltd | 0 | -100,00 | 0 | |||||
| 2026-02-02 | 13F | Aurora Private Wealth, Inc. | 25.820 | 52,42 | 1 | |||||
| 2026-02-10 | 13F | Envestnet Asset Management Inc | 14.770 | -33,61 | 698 | -33,90 | ||||
| 2026-02-02 | 13F | Mutual Advisors, LLC | 4.791 | 226 | ||||||
| 2026-02-12 | 13F | Jane Street Group, Llc | 36.372 | 641,08 | 1.719 | 637,34 | ||||
| 2026-01-28 | 13F | Diversified Enterprises, LLC | 8.516 | 3,10 | 402 | 2,55 | ||||
| 2026-01-16 | 13F | PFS Partners, LLC | 632 | 285,37 | 30 | 314,29 | ||||
| 2026-02-06 | 13F | Larson Financial Group LLC | 5.352 | 0,15 | 253 | -0,40 | ||||
| 2026-02-10 | 13F | Baker Avenue Asset Management, LP | 5.711 | 14,82 | 270 | 13,98 | ||||
| 2026-02-13 | 13F | Morgan Stanley | 1 | 0,00 | 0 | |||||
| 2026-01-05 | 13F | Horizons Wealth Management | 1.299 | 0,00 | 61 | 0,00 | ||||
| 2026-02-12 | 13F | Sbe Llc Dba Cedar Cove Wealth Partners | 6.548 | 309 | ||||||
| 2026-02-10 | 13F | Glassy Mountain Advisors, Inc. | 672 | 0,00 | 32 | 0,00 | ||||
| 2026-02-17 | 13F | Modern Wealth Management, LLC | 7.118 | 336 | ||||||
| 2026-02-13 | 13F | Sofos Investments, Inc. | 5.113 | 0,51 | 242 | 0,00 | ||||
| 2026-02-17 | 13F | Advisory Services Network, LLC | 0 | -100,00 | 0 | |||||
| 2026-02-11 | 13F | LPL Financial LLC | 118.175 | 110,18 | 5.585 | 109,22 | ||||
| 2026-02-17 | 13F | Advisor Group Holdings, Inc. | 45.150 | -0,18 | 2.135 | -0,61 | ||||
| 2026-01-29 | 13F | UMA Financial Services, Inc. | 642 | -8,15 | 30 | -9,09 | ||||
| 2026-02-02 | 13F | Millstone Evans Group, LLC | 251 | 12 | ||||||
| 2026-01-26 | 13F | Cwm, Llc | 2.858 | 0,78 | 0 | |||||
| 2026-02-10 | 13F | Verus Capital Partners, Llc | 7.520 | -17,64 | 355 | -18,01 | ||||
| 2026-02-13 | 13F | Mml Investors Services, Llc | 5.186 | 0,41 | 245 | 0,00 | ||||
| 2026-01-28 | 13F | Cranbrook Wealth Management, LLC | 352 | 0,00 | 17 | 0,00 | ||||
| 2026-02-11 | 13F | IMA Wealth, Inc. | 1.485 | 2,06 | 69 | 1,47 | ||||
| 2025-12-15 | 13F | Farmers National Bank | 5.708 | 1,21 | 271 | 1,50 | ||||
| 2026-03-06 | 13F | Hsbc Holdings Plc | 24.000 | 0,00 | 1.134 | -0,44 | ||||
| 2026-02-17 | 13F | Cape Investment Advisory, Inc. | 867 | 0,00 | 41 | -2,44 | ||||
| 2026-01-23 | 13F | Cantor Fitzgerald Investment Adviser L.p. | 4.292 | 0,19 | 203 | -0,49 | ||||
| 2026-02-05 | 13F | iA Global Asset Management Inc. | 29.350 | 31,32 | 1 | 0,00 | ||||
| 2026-02-17 | 13F | Raymond James Financial Inc | 43.619 | 1,02 | 2.061 | 0,54 | ||||
| 2026-02-11 | 13F | Ameritas Investment Partners, Inc. | 13.380 | 632 | ||||||
| 2026-01-23 | 13F | Assetmark, Inc | 49.568 | 4,45 | 2.342 | 3,95 | ||||
| 2026-02-05 | 13F | High Note Wealth, LLC | 510 | 0,00 | 24 | 0,00 | ||||
| 2026-02-12 | 13F | Commonwealth Equity Services, Llc | 89.557 | 25,15 | 4.232 | 140.966,67 | ||||
| 2026-02-17 | 13F | Jones Financial Companies Lllp | 5.084 | 15,05 | 240 | 14,83 | ||||
| 2026-02-17 | 13F | Ameriprise Financial Inc | 5.481 | 259 | ||||||
| 2026-02-17 | 13F | Cetera Investment Advisers | 30.338 | 1,91 | 1.434 | 1,42 | ||||
| 2026-02-09 | 13F | Key FInancial Inc | 1.700 | 0,00 | 80 | 0,00 | ||||
| 2026-02-12 | 13F | Triumph Capital Management | 430 | 0,00 | 20 | 0,00 | ||||
| 2026-01-23 | 13F | Nbt Bank N A /ny | 717 | -12,77 | 34 | -15,38 | ||||
| 2026-02-09 | 13F | Marshall Investment Management, Llc | 5.545 | 7,54 | 262 | 7,38 | ||||
| 2026-01-29 | 13F | UBS Group AG | 80.365 | 4,74 | 3.798 | 4,23 | ||||
| 2026-02-09 | 13F | Harbour Investments, Inc. | 13.089 | -58,20 | 619 | -58,44 | ||||
| 2026-01-16 | 13F | SigFig Wealth Management, LLC | 239.468 | 4,20 | 11.317 | 3,74 | ||||
| 2026-02-12 | 13F | Financial Network Wealth Management LLC | 24.940 | -0,78 | 1 | 0,00 | ||||
| 2026-02-17 | 13F | Private Advisor Group, LLC | 5.677 | 1,88 | 268 | 1,52 | ||||
| 2026-01-30 | 13F | Us Bancorp \de\ | 3.459 | -26,65 | 163 | -26,91 | ||||
| 2025-11-06 | 13F | Ameritas Advisory Services, LLC | 0 | -100,00 | 0 | |||||
| 2026-02-09 | 13F | Huntington National Bank | 467 | -0,64 | ||||||
| 2026-02-12 | 13F | Rossby Financial, LCC | 701 | 6,70 | 33 | 6,45 | ||||
| 2026-02-10 | 13F | Bank of New York Mellon Corp | 0 | -100,00 | 0 | |||||
| 2026-02-11 | 13F | Jpmorgan Chase & Co | 177 | 0,00 | 8 | 0,00 | ||||
| 2026-02-13 | 13F | Balanced Rock Investment Advisor | 70.831 | 6,15 | 3.347 | 5,65 | ||||
| 2026-01-27 | 13F | TD Waterhouse Canada Inc. | 326 | 15 | ||||||
| 2026-02-17 | 13F | Gladstone Institutional Advisory LLC | 4.648 | 0,00 | 220 | -0,45 | ||||
| 2026-01-23 | 13F | Natural Investments, Llc | 10.064 | 0 | ||||||
| 2026-01-28 | 13F | Schmidt P J Investment Management Inc | 6.041 | 285 | ||||||
| 2026-02-09 | 13F | Topel & Distasi Wealth Management, LLC | 19.512 | 6,94 | 922 | 6,47 | ||||
| 2026-02-05 | 13F | Mason & Associates Inc | 6.998 | 6,63 | 331 | 6,11 | ||||
| 2026-02-05 | 13F | Cambridge Investment Research Advisors, Inc. | 23.043 | 18,45 | 1 | |||||
| 2026-02-18 | 13F | EP Wealth Advisors, Inc. | 15.344 | 725 | ||||||
| 2026-02-06 | 13F | HighTower Advisors, LLC | 28.522 | 3,47 | 1.348 | 2,98 | ||||
| 2026-02-19 | 13F | Birchwood Financial Partners, Inc. | 470 | 22 | ||||||
| 2026-02-06 | 13F | Summit Wealth Group, LLC | 15.817 | 4,42 | 747 | 3,89 | ||||
| 2026-02-17 | 13F | Royal Bank Of Canada | 21.508 | 17,50 | 1.016 | 16,92 | ||||
| 2025-11-12 | 13F | Ameriflex Group, Inc. | 0 | -100,00 | 0 | |||||
| 2026-02-12 | 13F | Wealthspire Advisors, LLC | 0 | -100,00 | 0 | |||||
| 2026-01-26 | 13F | AE Wealth Management LLC | 1.351 | -47,04 | 64 | -47,93 | ||||
| 2025-11-14 | 13F | Eqis Capital Management, Inc. | 0 | -100,00 | 0 | |||||
| 2026-01-21 | 13F | Impact Investors, Inc | 51.555 | -0,11 | 2.436 | -0,57 | ||||
| 2026-02-20 | 13F | Sunbelt Securities, Inc. | 100 | 0,00 | 5 | 0,00 | ||||
| 2026-01-23 | 13F | Financial Connections Group, Inc. | 31.193 | 1 | ||||||
| 2026-02-12 | 13F | Front Row Advisors LLC | 425 | 0,00 | 20 | 0,00 | ||||
| 2025-11-13 | 13F | Parallel Advisors, LLC | 0 | -100,00 | 0 | -100,00 | ||||
| 2026-02-13 | 13F | MAI Capital Management | 1.435 | -1,98 | 68 | -2,90 | ||||
| 2026-01-23 | 13F | Farther Finance Advisors, LLC | 1.897 | 38,77 | 90 | 39,06 | ||||
| 2026-01-23 | 13F | Curtis Advisory Group, LLC | 5.160 | 0,00 | 244 | -0,82 | ||||
| 2026-02-13 | 13F | Kestra Advisory Services, LLC | 0 | -100,00 | 0 | |||||
| 2026-01-23 | 13F | Colorado Capital Management, Inc. | 93.722 | 5,09 | 4 | 0,00 | ||||
| 2026-02-17 | 13F | Fmr Llc | 6.824 | 6,41 | 322 | 5,92 | ||||
| 2026-02-18 | 13F | GWM Advisors LLC | 0 | -100,00 | 0 | |||||
| 2026-02-18 | 13F | Garton & Associates Financial Advisors LLC | 210 | 10 | ||||||
| 2026-01-27 | 13F | Seeds Investor Llc | 36.498 | 30,37 | 1.725 | 29,72 | ||||
| 2026-02-06 | 13F | IFP Advisors, Inc | 477 | 211,76 | 23 | 214,29 | ||||
| 2026-02-11 | 13F | Milestone Investment Advisors LLC | 4.992 | -1,29 | 236 | -2,08 | ||||
| 2026-02-13 | 13F | Wells Fargo & Company/mn | 30.377 | 65,10 | 1.436 | 64,38 |