Grundlæggende statistik
| Institutionelle aktier (lange) | 7.786.507 - 53,87% (ex 13D/G) - change of -2,24MM shares -22,32% MRQ |
| Institutionel værdi (lang) | $ 221.025 USD ($1000) |
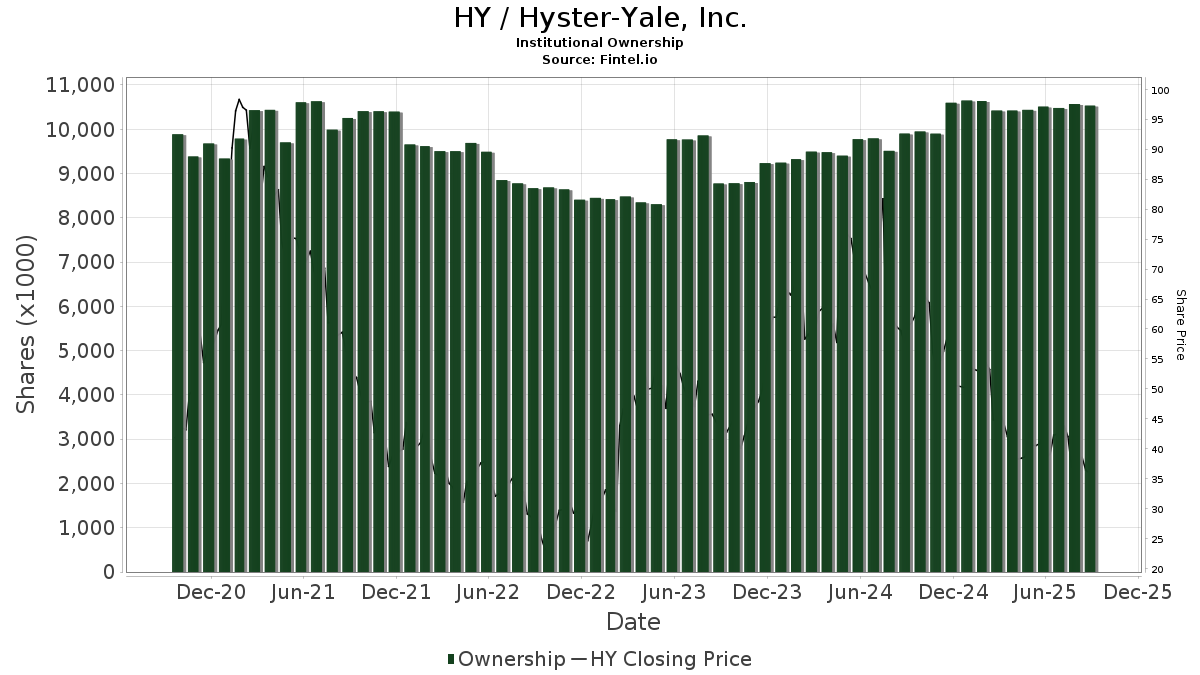
Institutionelt ejerskab og aktionærer
Hyster-Yale, Inc. (US:HY) har 146 institutionelle ejere og aktionærer, der har indsendt 13D/G- eller 13F-formularer til Securities Exchange Commission (SEC). Disse institutioner har i alt 7,786,507 aktier. Største aktionærer omfatter BlackRock, Inc., Gamco Investors, Inc. Et Al, Vanguard Group Inc, Dimensional Fund Advisors Lp, American Century Companies Inc, State Street Corp, Geode Capital Management, Llc, Millennium Management Llc, Acadian Asset Management Llc, and ProShare Advisors LLC .
Hyster-Yale, Inc. (NYSE:HY) institutionel ejerskabsstruktur viser aktuelle positioner i virksomheden efter institutioner og fonde, samt seneste ændringer i positionsstørrelse. Større aktionærer kan omfatte individuelle investorer, investeringsforeninger, hedgefonde eller institutioner. Skema 13D angiver, at investoren besidder (eller besidder) mere end 5 % af virksomheden og har til hensigt (eller har til hensigt at) aktivt at forfølge en ændring i forretningsstrategi. Skema 13G indikerer en passiv investering på over 5%.
The share price as of April 14, 2026 is 37,18 / share. Previously, on April 15, 2025, the share price was 38,12 / share. This represents a decline of 2,47% over that period.
Fondens stemningsscore
Fund Sentiment Score (fka Ownership Accumulation Score) finder de aktier, der bliver mest købt af fonde. Det er resultatet af en sofistikeret, multi-faktor kvantitativ model, der identificerer virksomheder med de højeste niveauer af institutionel akkumulering. Scoringsmodellen bruger en kombination af den samlede stigning i oplyste ejere, ændringerne i porteføljeallokeringer i disse ejere og andre målinger. Tallet går fra 0 til 100, hvor højere tal indikerer et højere niveau af akkumulering for sine jævnaldrende, og 50 er gennemsnittet.
Opdateringsfrekvens: Dagligt
Se Ownership Explorer, som giver en liste over højest rangerende virksomheder.
AI+ Ask Fintel’s AI assistant about Hyster-Yale, Inc..
Select a question to share a public post with an AI-crafted answer.
Thinking of good questions…
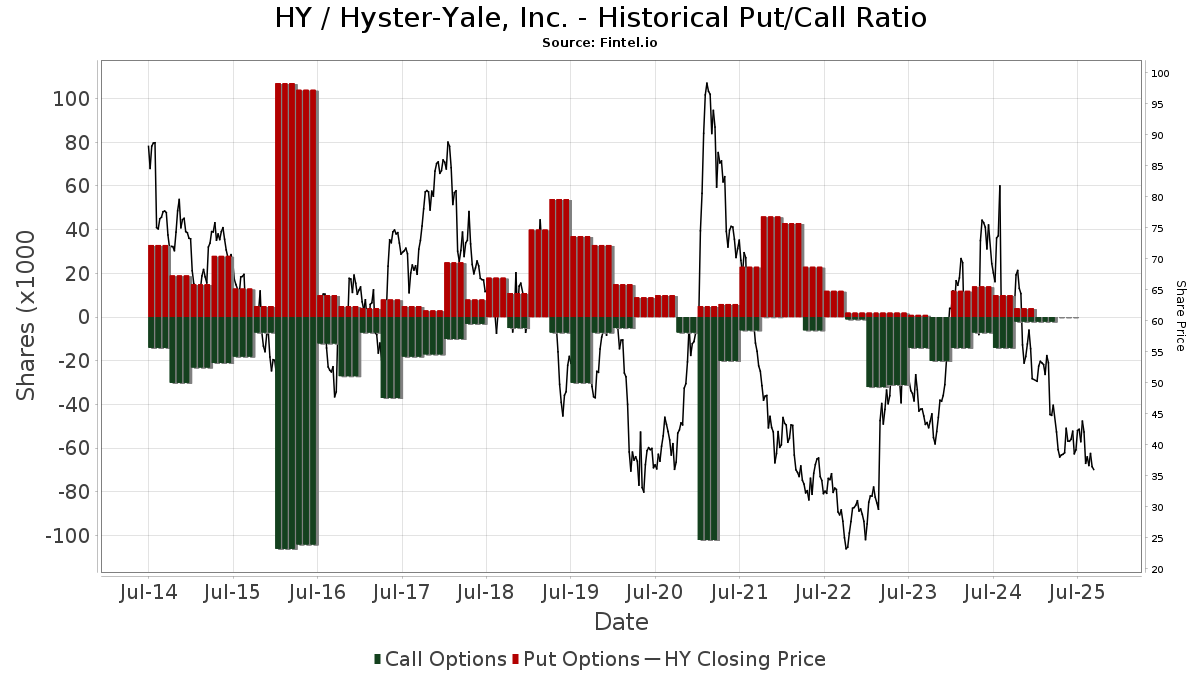
Institutionel Put/Call-forhold
Ud over at indberette standardaktie- og gældsudstedelser skal institutter med mere end 100 mill. aktiver under forvaltning også oplyse deres put- og call-optionsbeholdninger. Da salgsoptioner generelt indikerer negativ stemning, og købsoptioner indikerer positiv stemning, kan vi få en fornemmelse af den overordnede institutionelle stemning ved at plotte forholdet mellem put og kald. Diagrammet til højre viser det historiske put/call-forhold for dette instrument.
Brug af Put/Call Ratio som en indikator for investorernes stemning overvinder en af de vigtigste mangler ved at bruge totalt institutionelt ejerskab, som er, at en betydelig mængde af aktiver under forvaltning investeres passivt for at spore indekser. Passivt forvaltede fonde køber typisk ikke optioner, så indikatoren for put/call-forholdet følger mere nøje følelsen af aktivt forvaltede fonde.
13D/G-arkivering
Vi præsenterer 13D/G ansøgninger separat fra 13F ansøgninger på grund af den forskellige behandling af SEC. 13D/G-ansøgninger kan indgives af grupper af investorer (med én ledende), hvorimod 13F-ansøgninger ikke kan. Dette resulterer i situationer, hvor en investor kan indsende en 13D/G, der rapporterer én værdi for de samlede aktier (der repræsenterer alle de aktier, der ejes af investorgruppen), men derefter indsender en 13F, der rapporterer en anden værdi for de samlede aktier (der udelukkende repræsenterer deres egne) ejendomsret). Det betyder, at aktieejerskab af 13D/G-arkiver og 13F-arkiveringer ofte ikke er direkte sammenlignelige, så vi præsenterer dem separat.
Bemærk: Fra den 16. maj 2021 viser vi ikke længere ejere, der ikke har indsendt en 13D/G inden for det seneste år. Tidligere viste vi den fulde historie af 13D/G-arkiver. Generelt skal enheder, der er forpligtet til at indgive 13D/G-ansøgninger, indgive mindst årligt, før de indsender en afsluttende ansøgning. Dog forlader fonde nogle gange positioner uden at indsende en afsluttende ansøgning (dvs. de afvikler), så visning af den fulde historie resulterede nogle gange i forvirring om det nuværende ejerskab. For at undgå forvirring viser vi nu kun 'aktuelle' ejere - det vil sige - ejere, der har anmeldt inden for det seneste år.
Upgrade to unlock premium data.
| Fil dato | Form | Investor | Forrige Aktier |
Seneste Aktier |
Δ Aktier (Procent) |
Ejendomsret (Procent) |
Δ Ejerskab (Procent) |
|
|---|---|---|---|---|---|---|---|---|
| 2026-01-30 | VANGUARD GROUP INC | 910,812 | 698,331 | -23.33 | 4.88 | -23.51 | ||
| 2025-11-06 | GAMCO INVESTORS, INC. ET AL | 946,392 | 819,887 | -13.37 | 5.70 | -15.56 | ||
| 2025-03-14 | RANKIN ALFRED M ET AL | 2,943,424 | 3,217,230 | 9.30 | 93.10 | 9.75 | ||
| 2025-03-14 | AMR Associates, L.P. | 3,217,230 | 93.10 |
13F og NPORT arkivering
Detaljer om 13F-arkivering er gratis. Detaljer om NP-ansøgninger kræver et premium-medlemskab. Grønne rækker angiver nye positioner. Røde rækker angiver lukkede positioner. Klik på linket ikon for at se den fulde transaktionshistorik.
Opgrader
for at låse premium-data op og eksportere til Excel ![]() .
.
| Fil dato | Kilde | Investor | Type | Gennemsnitlig pris (Øst) |
Aktier | Δ Aktier (%) |
Rapporteret Værdi ($1000) |
Δ Værdi (%) |
Port Alloc (%) |
|
|---|---|---|---|---|---|---|---|---|---|---|
| 2026-02-13 | 13F | State Street Corp | 307.794 | 12,12 | 9.145 | -9,63 | ||||
| 2026-02-02 | 13F | Strs Ohio | 7.500 | 0,00 | 223 | -19,57 | ||||
| 2026-02-17 | 13F | Prelude Capital Management, Llc | 13.160 | 42,04 | 391 | 14,37 | ||||
| 2026-01-27 | 13F | Krilogy Financial LLC | 12.012 | 384 | ||||||
| 2026-01-30 | 13F | Arlington Trust Co LLC | 0 | -100,00 | 0 | |||||
| 2026-02-13 | 13F | Great West Life Assurance Co /can/ | 933 | 0,00 | 0 | |||||
| 2026-02-13 | 13F | American Century Companies Inc | 377.785 | 6,43 | 11.224 | -14,22 | ||||
| 2026-02-09 | 13F | Hartland & Co., LLC | 922 | -6,11 | 27 | -25,00 | ||||
| 2026-01-29 | 13F | Concord Wealth Partners | 60 | 0,00 | 2 | -50,00 | ||||
| 2026-02-17 | 13F | Engineers Gate Manager LP | 17.808 | -4,80 | 529 | -23,22 | ||||
| 2025-11-12 | 13F | Quantbot Technologies LP | 0 | -100,00 | 0 | |||||
| 2026-02-13 | 13F | Wells Fargo & Company/mn | 15.267 | 69,52 | 454 | 36,86 | ||||
| 2025-11-13 | 13F | Dynamic Technology Lab Private Ltd | 0 | -100,00 | 0 | -100,00 | ||||
| 2026-02-11 | 13F | Empowered Funds, LLC | 66.609 | 10,64 | 1.979 | -10,86 | ||||
| 2025-12-09 | 13F/A | Tudor Investment Corp Et Al | 6.239 | -83,13 | 230 | -84,43 | ||||
| 2026-02-04 | 13F | Pacific Ridge Capital Partners, LLC | 20.128 | 127,33 | 598 | 83,44 | ||||
| 2026-02-06 | 13F | FourThought Financial Partners, LLC | 16.976 | 114,42 | 504 | 73,20 | ||||
| 2026-01-09 | 13F | Assenagon Asset Management S.A. | 0 | -100,00 | 0 | |||||
| 2026-02-13 | 13F | Sei Investments Co | 29.254 | -3,81 | 869 | -22,48 | ||||
| 2026-02-13 | 13F | SRS Capital Advisors, Inc. | 0 | -100,00 | 0 | |||||
| 2026-01-27 | 13F | Zurcher Kantonalbank (Zurich Cantonalbank) | 336 | 0,00 | 10 | -25,00 | ||||
| 2026-02-17 | 13F | Millennium Management Llc | 224.251 | 1,54 | 6.662 | -18,16 | ||||
| 2026-02-13 | 13F | Caxton Associates Llp | 8.494 | 252 | ||||||
| 2026-04-13 | 13F | Global X Japan Co., Ltd. | 438 | 59,85 | 14 | 75,00 | ||||
| 2026-01-21 | 13F | Capital Advisors, Ltd. LLC | 0 | -100,00 | 0 | |||||
| 2026-02-10 | 13F | Koss-Olinger Consulting, LLC | 9.904 | -13,15 | 294 | -35,24 | ||||
| 2026-01-30 | 13F | Us Bancorp \de\ | 75 | -22,68 | 2 | -33,33 | ||||
| 2026-01-30 | 13F | Keybank National Association/oh | 34.766 | 0,00 | 1.033 | -19,44 | ||||
| 2026-02-06 | 13F | GPS Wealth Strategies Group, LLC | 0 | -100,00 | 0 | |||||
| 2026-01-15 | 13F | Allspring Global Investments Holdings, LLC | 16.254 | 9,59 | 483 | -11,72 | ||||
| 2026-02-17 | 13F | Advisor Group Holdings, Inc. | 10.429 | 1.477,76 | 310 | 1.187,50 | ||||
| 2026-02-13 | 13F | Police & Firemen's Retirement System of New Jersey | 3.409 | 0,00 | 101 | -19,20 | ||||
| 2026-02-17 | 13F | Brevan Howard Capital Management LP | 10.747 | 319 | ||||||
| 2025-11-12 | 13F | Creative Financial Designs Inc /adv | 0 | -100,00 | 0 | |||||
| 2026-02-17 | 13F | Parvin Asset Management, LLC | 8.045 | 239 | ||||||
| 2026-02-12 | 13F | Renaissance Technologies Llc | 39.900 | -5,67 | 1.185 | -23,99 | ||||
| 2026-02-02 | 13F | Mcdonald Partners Llc | 40.370 | -13,27 | 1.199 | -30,09 | ||||
| 2026-04-14 | 13F | Nbc Securities, Inc. | 8.405 | -33,84 | 273 | -27,59 | ||||
| 2026-02-13 | 13F | Johnson Investment Counsel Inc | 44.603 | 0,00 | 1.325 | -19,40 | ||||
| 2026-02-05 | 13F | Amalgamated Bank | 369 | -5,63 | 0 | |||||
| 2026-02-10 | 13F | Bnp Paribas Arbitrage, Sa | 8.468 | -61,26 | 252 | -68,82 | ||||
| 2026-02-10 | 13F | Acadian Asset Management Llc | 197.642 | 26,20 | 6 | 0,00 | ||||
| 2026-01-26 | 13F | Cwm, Llc | 41.393 | -2,10 | 1 | 0,00 | ||||
| 2026-02-06 | 13F | Covestor Ltd | 2 | 0,00 | 0 | |||||
| 2026-02-09 | 13F | Quest Partners LLC | 3.912 | 41,23 | 116 | 13,73 | ||||
| 2026-02-11 | 13F | Parallel Advisors, LLC | 41 | -18,00 | 1 | 0,00 | ||||
| 2026-02-17 | 13F | Dv Equities, Llc | 161 | 5 | ||||||
| 2026-02-12 | 13F | Dimensional Fund Advisors Lp | 559.041 | -3,03 | 16.609 | -21,84 | ||||
| 2026-01-28 | 13F | Ai Financial Services Llc | 0 | -100,00 | 0 | |||||
| 2026-02-17 | 13F | Creative Planning | 8.244 | 245 | ||||||
| 2026-01-29 | 13F | UBS Group AG | 37.724 | -10,80 | 1.121 | -28,11 | ||||
| 2025-10-21 | 13F | Signaturefd, Llc | 0 | -100,00 | 0 | |||||
| 2026-02-17 | 13F | Ancora Advisors, LLC | 1 | 0,00 | 0 | |||||
| 2026-02-13 | 13F | Martingale Asset Management L P | 23.120 | -0,10 | 687 | -19,58 | ||||
| 2026-02-17 | 13F | Aquatic Capital Management LLC | 0 | -100,00 | 0 | |||||
| 2026-02-13 | 13F | Jacobs Levy Equity Management, Inc | 144.485 | 43,53 | 4.293 | 15,69 | ||||
| 2026-02-13 | 13F | Charles Schwab Investment Management Inc | 96.441 | -7,53 | 2.865 | -25,47 | ||||
| 2026-02-11 | 13F | Simplex Trading, Llc | Call | 4.100 | 1.266,67 | 122 | ||||
| 2026-02-11 | 13F | Simplex Trading, Llc | Put | 700 | 21 | |||||
| 2026-02-06 | 13F | Gsa Capital Partners Llp | 34.433 | -2,93 | 1 | 0,00 | ||||
| 2026-02-11 | 13F | Simplex Trading, Llc | 4.572 | 136 | ||||||
| 2025-11-14 | 13F | Dark Forest Capital Management Lp | 5.583 | 0,00 | 222 | 0,00 | ||||
| 2026-02-17 | 13F | California State Teachers Retirement System | 7.981 | -1,35 | 237 | -20,47 | ||||
| 2025-11-07 | 13F | Bastion Asset Management Inc. | 0 | -100,00 | 0 | |||||
| 2026-02-05 | 13F | Allworth Financial LP | 48 | 71,43 | 1 | 0,00 | ||||
| 2025-10-15 | 13F | Vontobel Holding Ltd. | 0 | -100,00 | 0 | |||||
| 2025-10-27 | 13F | Versant Capital Management, Inc | 0 | -100,00 | 0 | -100,00 | ||||
| 2026-01-15 | 13F | Nisa Investment Advisors, Llc | 191 | 1,06 | 6 | -16,67 | ||||
| 2026-02-17 | 13F | Alliancebernstein L.p. | 9.928 | -18,68 | 295 | -34,52 | ||||
| 2026-02-17 | 13F | Northern Trust Corp | 95.694 | -8,15 | 2.843 | -25,96 | ||||
| 2026-02-17 | 13F | Zacks Investment Management | 8.598 | 0,00 | 255 | -19,30 | ||||
| 2026-02-12 | 13F | Federated Hermes, Inc. | 122.876 | 27,74 | 3.651 | 2,96 | ||||
| 2026-02-13 | 13F | Smartleaf Asset Management LLC | 5 | 0,00 | 0 | |||||
| 2026-02-13 | 13F | Rhumbline Advisers | 15.601 | -14,80 | 463 | -31,31 | ||||
| 2026-02-17 | 13F | Two Sigma Advisers, Lp | 29.100 | -22,81 | 865 | -37,80 | ||||
| 2026-02-05 | 13F | Isthmus Partners, Llc | 57.443 | 4,73 | 1.707 | -15,59 | ||||
| 2025-11-13 | 13F | Fuller & Thaler Asset Management, Inc. | 0 | -100,00 | 0 | |||||
| 2026-02-13 | 13F | Kestra Advisory Services, LLC | 2.056 | 61 | ||||||
| 2026-02-17 | 13F | Quantinno Capital Management LP | 10.250 | 305 | ||||||
| 2026-02-12 | 13F | New York State Common Retirement Fund | 4.494 | 0,00 | 134 | -19,39 | ||||
| 2026-02-09 | 13F | Huntington National Bank | 1 | 0,00 | 0 | |||||
| 2026-02-12 | 13F | BlackRock, Inc. | 890.877 | 1,30 | 26.468 | -18,35 | ||||
| 2026-01-23 | 13F | Curbstone Financial Management Corp | 73.490 | 0,00 | 2.183 | -19,39 | ||||
| 2026-02-06 | 13F | EverSource Wealth Advisors, LLC | 69 | -60,57 | 2 | -66,67 | ||||
| 2026-02-13 | 13F | Impala Asset Management LLC | 50.000 | 1.486 | ||||||
| 2026-02-13 | 13F | MAI Capital Management | 6 | 0 | ||||||
| 2026-02-17 | 13F | Aqr Capital Management Llc | 86.524 | -1,27 | 2.571 | -20,43 | ||||
| 2026-02-11 | 13F | Deutsche Bank Ag\ | 26.240 | 172,11 | 780 | 119,44 | ||||
| 2026-02-13 | 13F | Walleye Capital LLC | 0 | -100,00 | 0 | |||||
| 2026-02-13 | 13F | Truvestments Capital Llc | 66.172 | -3,79 | 1.966 | -22,49 | ||||
| 2026-02-03 | 13F | Swedbank AB | 0 | -100,00 | 0 | |||||
| 2025-10-16 | 13F | Ronald Blue Trust, Inc. | 0 | -100,00 | 0 | |||||
| 2026-01-26 | 13F | Mirae Asset Global Investments Co., Ltd. | 10.339 | -4,01 | 307 | -22,67 | ||||
| 2026-02-17 | 13F | Ameriprise Financial Inc | 26.125 | 8,85 | 776 | -12,22 | ||||
| 2026-02-13 | 13F | Citigroup Inc | 1.940 | -15,80 | 58 | -32,14 | ||||
| 2026-02-17 | 13F | Two Sigma Investments, Lp | 28.360 | -51,00 | 843 | -60,53 | ||||
| 2026-02-13 | 13F | Y-Intercept (Hong Kong) Ltd | 0 | -100,00 | 0 | |||||
| 2026-02-09 | 13F | Shufro Rose & Co Llc | 0 | -100,00 | 0 | |||||
| 2026-02-12 | 13F | Hrt Financial Lp | 8.650 | -73,24 | 0 | -100,00 | ||||
| 2026-02-12 | 13F | Advisors Asset Management, Inc. | 15 | -6,25 | 0 | |||||
| 2026-02-20 | 13F | Sunbelt Securities, Inc. | 0 | 0 | ||||||
| 2026-02-17 | 13F | MIRAE ASSET GLOBAL ETFS HOLDINGS Ltd. | 126.757 | 24,04 | 3.767 | 0,08 | ||||
| 2026-02-13 | 13F | Arrowstreet Capital, Limited Partnership | 66.975 | 24,98 | 1.990 | 0,71 | ||||
| 2026-02-17 | 13F | Susquehanna Fundamental Investments, Llc | 23.438 | 696 | ||||||
| 2026-02-17 | 13F | Citadel Advisors Llc | Put | 9.500 | 33,80 | 282 | 8,05 | |||
| 2026-02-17 | 13F | Citadel Advisors Llc | Call | 25.800 | 767 | |||||
| 2026-02-17 | 13F | Citadel Advisors Llc | 22.682 | 1,89 | 674 | -17,93 | ||||
| 2026-02-12 | 13F | Nuveen, LLC | 23.161 | 0,00 | 688 | -19,34 | ||||
| 2026-02-09 | 13F | Fisher Asset Management, LLC | 32.981 | -6,17 | 980 | -24,40 | ||||
| 2026-02-17 | 13F | State Of Wisconsin Investment Board | 0 | -100,00 | 0 | |||||
| 2025-11-14 | 13F | Lazard Asset Management Llc | 0 | -100,00 | 0 | |||||
| 2026-02-17 | 13F | XTX Topco Ltd | 13.616 | 405 | ||||||
| 2026-02-17 | 13F | Bridgeway Capital Management Inc | 94.609 | 7,27 | 2.811 | -13,57 | ||||
| 2026-02-13 | 13F | Barclays Plc | 18.280 | 8,61 | 543 | -12,42 | ||||
| 2026-02-03 | 13F | Mitsubishi UFJ Kokusai Asset Management Co., Ltd. | 37.137 | 82,07 | 1.117 | 48,60 | ||||
| 2026-02-17 | 13F | D. E. Shaw & Co., Inc. | 175.689 | 3,46 | 5.220 | -16,62 | ||||
| 2025-11-13 | 13F | Panagora Asset Management Inc | 0 | -100,00 | 0 | |||||
| 2026-02-09 | 13F | Legal & General Group Plc | 9.958 | 0,00 | 296 | -19,62 | ||||
| 2026-04-13 | 13F | IFP Advisors, Inc | 51 | -7,27 | 2 | 0,00 | ||||
| 2026-02-17 | 13F | Jones Financial Companies Lllp | 139 | 61,63 | 4 | 33,33 | ||||
| 2026-02-13 | 13F | Transamerica Financial Advisors, Inc. | 0 | -100,00 | 0 | |||||
| 2026-02-13 | 13F | Sterling Capital Management LLC | 677 | -16,42 | 20 | -31,03 | ||||
| 2025-11-03 | 13F | LRI Investments, LLC | 0 | -100,00 | 0 | |||||
| 2026-01-28 | 13F | Klp Kapitalforvaltning As | 1.800 | 20,00 | 53 | -3,64 | ||||
| 2025-11-13 | 13F | De Lisle Partners LLP | 0 | -100,00 | 0 | |||||
| 2025-11-14 | 13F | ExodusPoint Capital Management, LP | 18.028 | 209,65 | 665 | |||||
| 2026-02-12 | 13F | Federation des caisses Desjardins du Quebec | 50 | 0,00 | 1 | 0,00 | ||||
| 2025-11-14 | 13F | Comerica Bank | 0 | -100,00 | 0 | |||||
| 2026-02-13 | 13F | Itau Unibanco Holding S.A. | 0 | -100,00 | 0 | |||||
| 2026-02-12 | 13F | Jane Street Group, Llc | 13.903 | -84,04 | 413 | -87,13 | ||||
| 2026-02-17 | 13F | Optiver Holding B.V. | 0 | -100,00 | 0 | |||||
| 2026-02-17 | 13F | Susquehanna International Group, Llp | 24.936 | 131,49 | 741 | 86,40 | ||||
| 2026-02-17 | 13F | Susquehanna International Group, Llp | Put | 20.600 | 7,85 | 612 | -13,07 | |||
| 2026-02-17 | 13F | PDT Partners, LLC | 0 | -100,00 | 0 | |||||
| 2026-02-17 | 13F | Price T Rowe Associates Inc /md/ | 12.867 | 37,73 | 0 | |||||
| 2026-02-05 | 13F | Gamco Investors, Inc. Et Al | 834.366 | -1,32 | 24.789 | -20,46 | ||||
| 2025-11-13 | 13F | Total Investment Management Inc | 0 | -100,00 | 0 | |||||
| 2026-02-17 | 13F | Qube Research & Technologies Ltd | 0 | -100,00 | 0 | |||||
| 2025-11-14 | 13F | Petrus Trust Company, LTA | 0 | -100,00 | 0 | |||||
| 2026-02-13 | 13F | Ubs Asset Management Americas Inc | 11.607 | 0,00 | 345 | -19,44 | ||||
| 2026-02-09 | 13F | Harbour Investments, Inc. | 77 | 1,32 | 2 | 0,00 | ||||
| 2026-01-23 | 13F | State of Alaska, Department of Revenue | 755 | 0,00 | 0 | |||||
| 2026-01-28 | 13F | DekaBank Deutsche Girozentrale | 1.249 | 0,00 | 0 | |||||
| 2026-02-17 | 13F | CWM Advisors, LLC | 15.798 | 27,01 | 469 | 2,40 | ||||
| 2026-02-17 | 13F | Numerai GP LLC | 0 | -100,00 | 0 | |||||
| 2026-02-17 | 13F | Mork Capital Management, LLC | 0 | -100,00 | 0 | |||||
| 2025-12-09 | 13F | Swiss Life Asset Management Ltd | 0 | -100,00 | 0 | |||||
| 2026-02-18 | 13F | GWM Advisors LLC | 0 | -100,00 | 0 | |||||
| 2026-02-18 | 13F | Mackenzie Financial Corp | 47.048 | 34,64 | 1.397 | 8,46 | ||||
| 2026-02-11 | 13F | Barrow Hanley Mewhinney & Strauss Llc | 0 | -100,00 | 0 | |||||
| 2026-02-17 | 13F | Bank Of America Corp /de/ | 27.916 | 48,32 | 829 | 19,62 | ||||
| 2026-02-19 | 13F | Invesco Ltd. | 21.726 | -5,89 | 645 | -24,12 | ||||
| 2026-02-10 | 13F | Rothschild Investment Llc | 2 | -80,00 | 0 | |||||
| 2026-01-30 | 13F | Kohmann Bosshard Financial Services, LLC | 7.346 | 0,00 | 218 | -19,26 | ||||
| 2026-02-06 | 13F | Pnc Financial Services Group, Inc. | 48.223 | 4,31 | 1.433 | -15,96 | ||||
| 2026-02-13 | 13F | Valueworks Llc | 0 | -100,00 | 0 | |||||
| 2026-02-17 | 13F | Russell Investments Group, Ltd. | 17.206 | 1,47 | 511 | -18,11 | ||||
| 2026-02-13 | 13F | Squarepoint Ops LLC | 0 | -100,00 | 0 | |||||
| 2026-02-17 | 13F | Amundi | 9.013 | 3,85 | 268 | -14,42 | ||||
| 2026-02-11 | 13F | Group One Trading, L.p. | Put | 200 | 6 | |||||
| 2026-01-08 | 13F | True Wealth Design, LLC | 0 | -100,00 | 0 | |||||
| 2026-02-13 | 13F | Prudential Financial Inc | 9.433 | -7,84 | 280 | -25,73 | ||||
| 2026-02-12 | 13F | Swiss National Bank | 16.600 | 0,00 | 493 | -19,31 | ||||
| 2026-02-11 | 13F | Group One Trading, L.p. | Call | 500 | 15 | |||||
| 2026-02-11 | 13F | LPL Financial LLC | 0 | -100,00 | 0 | |||||
| 2026-02-09 | 13F | Geode Capital Management, Llc | 275.896 | -0,18 | 8.199 | -19,55 | ||||
| 2026-02-17 | 13F | Public Employees Retirement System Of Ohio | 8.770 | 100,46 | 261 | 61,49 | ||||
| 2026-02-11 | 13F | Los Angeles Capital Management Llc | 62 | 2 | ||||||
| 2026-02-17 | 13F | Tower Research Capital LLC (TRC) | 2.135 | 63,35 | 63 | 31,25 | ||||
| 2026-02-10 | 13F | Goldman Sachs Group Inc | 120.803 | 58,84 | 3.589 | 28,04 | ||||
| 2026-02-17 | 13F | Raymond James Financial Inc | 12.891 | 114,07 | 383 | 72,85 | ||||
| 2026-04-07 | 13F | Farther Finance Advisors, LLC | 124 | 254,29 | 4 | 300,00 | ||||
| 2026-02-17 | 13F | Quadrature Capital Ltd | 0 | -100,00 | 0 | |||||
| 2026-04-06 | 13F | GAMMA Investing LLC | 433 | 61,57 | 14 | 100,00 | ||||
| 2026-02-05 | 13F | Gabelli Funds Llc | 56.200 | 8,29 | 1.670 | -12,75 | ||||
| 2026-02-13 | 13F | Morgan Stanley | 143.178 | 5,74 | 4.254 | -14,79 | ||||
| 2026-02-12 | 13F | Quadrant Capital Group Llc | 70 | 366,67 | 2 | |||||
| 2026-02-06 | 13F | ProShare Advisors LLC | 181.375 | 8,21 | 5.389 | -12,79 | ||||
| 2026-02-17 | 13F | Royal Bank Of Canada | 600 | -10,71 | 17 | -32,00 | ||||
| 2025-11-04 | 13F | Principal Financial Group Inc | 0 | -100,00 | 0 | -100,00 | ||||
| 2026-02-10 | 13F | Globeflex Capital L P | 0 | -100,00 | 0 | |||||
| 2026-02-06 | 13F | Larson Financial Group LLC | 0 | -100,00 | 0 | |||||
| 2026-02-12 | 13F | Skopos Labs, Inc. | 16.942 | 95,39 | 511 | 59,87 | ||||
| 2026-02-11 | 13F | Jpmorgan Chase & Co | 45.496 | -7,81 | 1.352 | -25,73 | ||||
| 2026-01-09 | 13F | SG Americas Securities, LLC | 10.955 | 0,34 | 0 | |||||
| 2026-01-29 | 13F | Dumont & Blake Investment Advisors Llc | 14.479 | -7,36 | 0 | -100,00 | ||||
| 2026-02-10 | 13F | Bank of New York Mellon Corp | 41.681 | -62,34 | 1.238 | -69,65 | ||||
| 2026-02-12 | 13F | MetLife Investment Management, LLC | 6.486 | 0,00 | 193 | -19,67 | ||||
| 2026-02-13 | 13F | Victory Capital Management Inc | 0 | -100,00 | 0 | |||||
| 2026-02-17 | 13F | SageView Advisory Group, LLC | 800 | 24 | ||||||
| 2026-04-10 | 13F/A | OP Asset Management Ltd | 56.379 | 1.833 | ||||||
| 2026-04-07 | 13F | Central Pacific Bank - Trust Division | 1.000 | 0,00 | 33 | 10,34 | ||||
| 2026-02-11 | 13F | Ameritas Investment Partners, Inc. | 1.071 | 32 | ||||||
| 2026-01-29 | 13F | Vanguard Group Inc | 698.331 | -23,33 | 20.747 | -38,20 | ||||
| 2026-02-13 | 13F | Caitong International Asset Management Co., Ltd | 0 | -100,00 | 0 | |||||
| 2026-02-11 | 13F | Franklin Resources Inc | 20.076 | 7,05 | 596 | -13,75 | ||||
| 2026-02-10 | 13F | Intech Investment Management Llc | 0 | -100,00 | 0 | |||||
| 2026-02-17 | 13F | Algert Global Llc | 37.184 | -0,72 | 1 | 0,00 | ||||
| 2026-02-04 | 13F | Virginia Retirement Systems Et Al | 17.700 | -4,32 | 526 | -22,91 | ||||
| 2026-02-13 | 13F | Verition Fund Management LLC | 0 | -100,00 | 0 | |||||
| 2026-02-17 | 13F | Fmr Llc | 77.713 | 12,92 | 2.309 | -8,99 |
Other Listings
| DE:HYEA | 28,00 € |