Grundlæggende statistik
| Institutionelle ejere | 87 total, 87 long only, 0 short only, 0 long/short - change of -7,45% MRQ |
| Gennemsnitlig porteføljeallokering | 0.0468 % - change of -47,89% MRQ |
| Institutionelle aktier (lange) | 8.077.457 (ex 13D/G) - change of -1,67MM shares -17,17% MRQ |
| Institutionel værdi (lang) | $ 350.083 USD ($1000) |
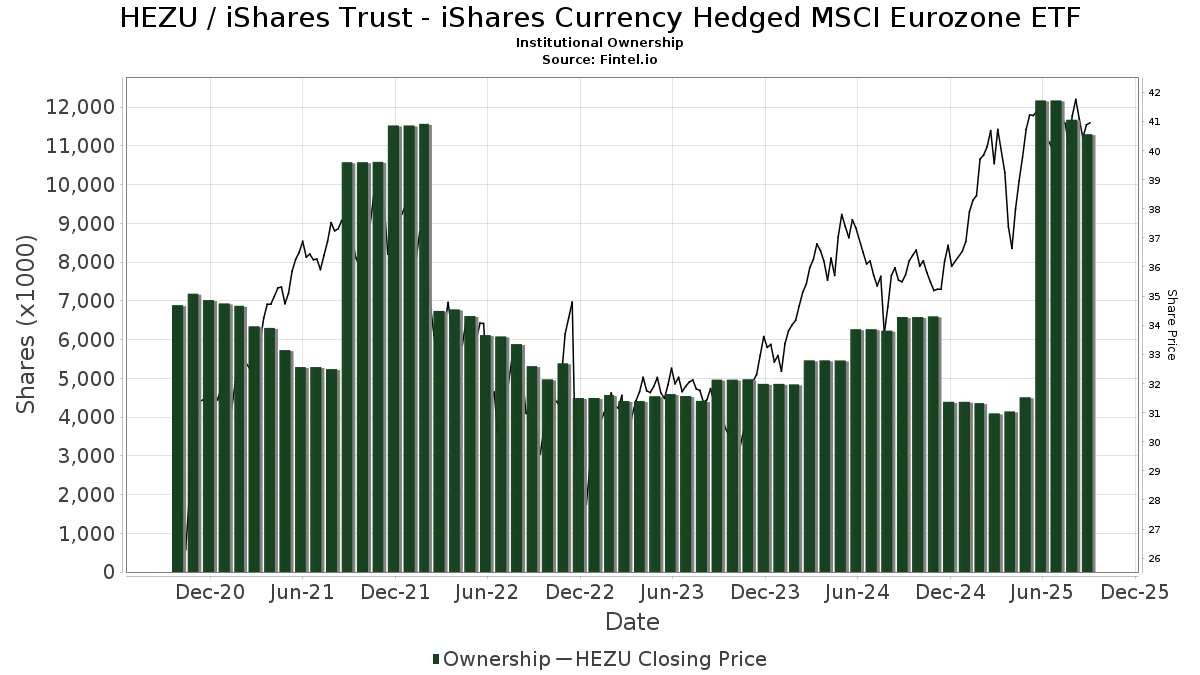
Institutionelt ejerskab og aktionærer
iShares Trust - iShares Currency Hedged MSCI Eurozone ETF (US:HEZU) har 87 institutionelle ejere og aktionærer, der har indsendt 13D/G- eller 13F-formularer til Securities Exchange Commission (SEC). Disse institutioner har i alt 8,077,457 aktier. Største aktionærer omfatter Charles Schwab Investment Management Inc, HighTower Advisors, LLC, Bank Of America Corp /de/, Robertson Stephens Wealth Management, LLC, EP Wealth Advisors, Inc., Jpmorgan Chase & Co, UBS Group AG, LPL Financial LLC, Insight Wealth Strategies, LLC, and Morgan Stanley .
iShares Trust - iShares Currency Hedged MSCI Eurozone ETF (ARCA:HEZU) institutionel ejerskabsstruktur viser aktuelle positioner i virksomheden efter institutioner og fonde, samt seneste ændringer i positionsstørrelse. Større aktionærer kan omfatte individuelle investorer, investeringsforeninger, hedgefonde eller institutioner. Skema 13D angiver, at investoren besidder (eller besidder) mere end 5 % af virksomheden og har til hensigt (eller har til hensigt at) aktivt at forfølge en ændring i forretningsstrategi. Skema 13G indikerer en passiv investering på over 5%.
The share price as of April 2, 2026 is 44,16 / share. Previously, on April 3, 2025, the share price was 37,94 / share. This represents an increase of 16,39% over that period.
Fondens stemningsscore
Fund Sentiment Score (fka Ownership Accumulation Score) finder de aktier, der bliver mest købt af fonde. Det er resultatet af en sofistikeret, multi-faktor kvantitativ model, der identificerer virksomheder med de højeste niveauer af institutionel akkumulering. Scoringsmodellen bruger en kombination af den samlede stigning i oplyste ejere, ændringerne i porteføljeallokeringer i disse ejere og andre målinger. Tallet går fra 0 til 100, hvor højere tal indikerer et højere niveau af akkumulering for sine jævnaldrende, og 50 er gennemsnittet.
Opdateringsfrekvens: Dagligt
Se Ownership Explorer, som giver en liste over højest rangerende virksomheder.
AI+ Ask Fintel’s AI assistant about iShares Trust - iShares Currency Hedged MSCI Eurozone ETF.
Select a question to share a public post with an AI-crafted answer.
Thinking of good questions…
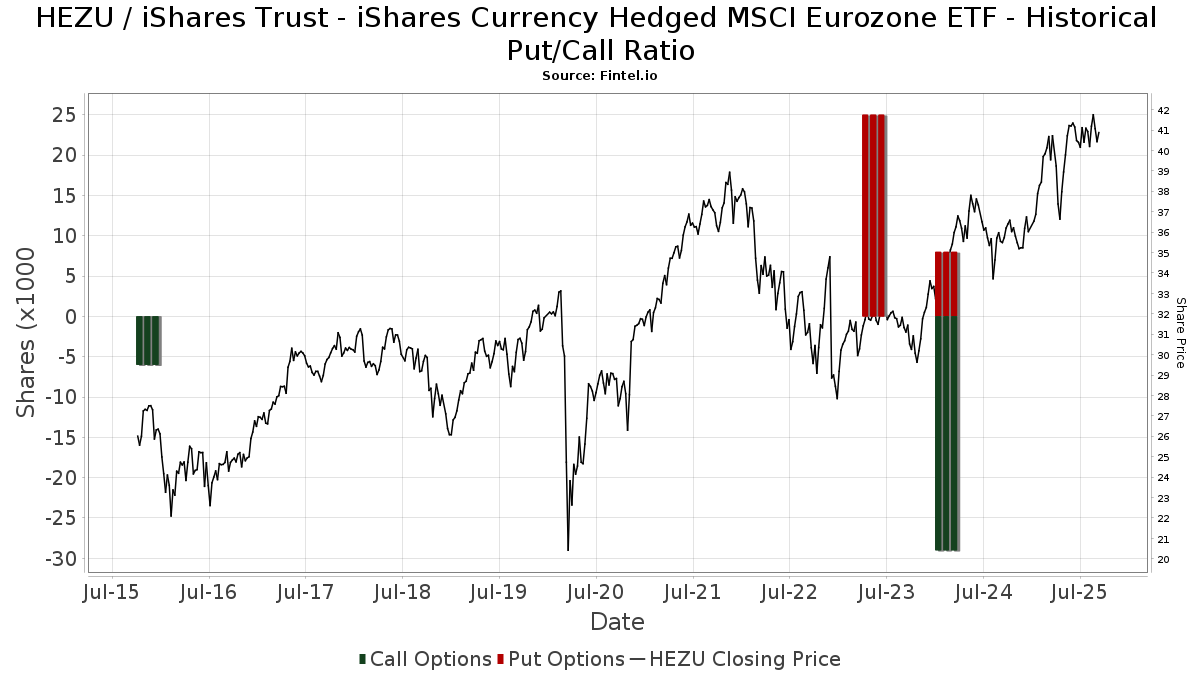
Institutionel Put/Call-forhold
Ud over at indberette standardaktie- og gældsudstedelser skal institutter med mere end 100 mill. aktiver under forvaltning også oplyse deres put- og call-optionsbeholdninger. Da salgsoptioner generelt indikerer negativ stemning, og købsoptioner indikerer positiv stemning, kan vi få en fornemmelse af den overordnede institutionelle stemning ved at plotte forholdet mellem put og kald. Diagrammet til højre viser det historiske put/call-forhold for dette instrument.
Brug af Put/Call Ratio som en indikator for investorernes stemning overvinder en af de vigtigste mangler ved at bruge totalt institutionelt ejerskab, som er, at en betydelig mængde af aktiver under forvaltning investeres passivt for at spore indekser. Passivt forvaltede fonde køber typisk ikke optioner, så indikatoren for put/call-forholdet følger mere nøje følelsen af aktivt forvaltede fonde.
13F og NPORT arkivering
Detaljer om 13F-arkivering er gratis. Detaljer om NP-ansøgninger kræver et premium-medlemskab. Grønne rækker angiver nye positioner. Røde rækker angiver lukkede positioner. Klik på linket ikon for at se den fulde transaktionshistorik.
Opgrader
for at låse premium-data op og eksportere til Excel ![]() .
.
| Fil dato | Kilde | Investor | Type | Gennemsnitlig pris (Øst) |
Aktier | Δ Aktier (%) |
Rapporteret Værdi ($1000) |
Δ Værdi (%) |
Port Alloc (%) |
|
|---|---|---|---|---|---|---|---|---|---|---|
| 2026-02-17 | 13F | Banco Bilbao Vizcaya Argentaria, S.a. | 0 | -100,00 | 0 | |||||
| 2025-10-23 | 13F | Independent Solutions Wealth Management, LLC | 0 | -100,00 | 0 | |||||
| 2026-02-17 | 13F | Captrust Financial Advisors | 5.797 | -1,09 | 254 | 2,43 | ||||
| 2025-11-20 | 13F | Asset Dedication, LLC | 0 | -100,00 | 0 | |||||
| 2026-01-16 | 13F | Piscataqua Savings Bank | 3.765 | 165 | ||||||
| 2026-02-11 | 13F | Deutsche Bank Ag\ | 4.650 | 9.200,00 | 203 | 10.050,00 | ||||
| 2026-02-17 | 13F | SageView Advisory Group, LLC | 260 | 11 | ||||||
| 2026-02-17 | 13F | Advisor Group Holdings, Inc. | 31.734 | -4,10 | 1.389 | 2,89 | ||||
| 2026-01-21 | 13F | Westfuller Advisors, LLC | 7.631 | 0,95 | 334 | 4,72 | ||||
| 2026-02-10 | 13F | Bank of New York Mellon Corp | 4.953 | 0,55 | 217 | 4,35 | ||||
| 2026-02-05 | 13F | Allworth Financial LP | 1.098 | 48 | ||||||
| 2026-02-05 | 13F | Phoenix Holdings Ltd. | 7.650 | 0,00 | 335 | 3,73 | ||||
| 2026-02-18 | 13F | Sierra Capital LLC | 27.301 | 0,00 | 1 | 0,00 | ||||
| 2026-02-17 | 13F | Blair William & Co/il | 79 | 0,00 | 3 | 0,00 | ||||
| 2026-02-14 | 13F | Rockefeller Capital Management L.P. | 5.085 | 0,00 | 223 | 3,74 | ||||
| 2026-02-14 | 13F | Howe & Rusling Inc | 1.816 | 79 | ||||||
| 2026-02-12 | 13F | Financial Network Wealth Management LLC | 7.196 | 0,00 | 0 | |||||
| 2026-02-11 | 13F | Allianz Asset Management GmbH | 82.679 | 58,76 | 3.618 | 64,83 | ||||
| 2026-02-17 | 13F | Fmr Llc | 2.758 | 22,04 | 121 | 26,32 | ||||
| 2026-02-17 | 13F | Susquehanna International Group, Llp | 0 | -100,00 | 0 | |||||
| 2026-01-22 | 13F | TSA Wealth Managment LLC | 5.806 | -11,09 | 254 | -7,64 | ||||
| 2026-02-17 | 13F | Dimension Capital Management Llc | 14.953 | -16,24 | 654 | -13,03 | ||||
| 2026-01-28 | 13F | EPG Wealth Management LLC | 938 | 0,00 | 41 | 5,13 | ||||
| 2026-02-06 | 13F | Pnc Financial Services Group, Inc. | 0 | -100,00 | 0 | |||||
| 2026-02-12 | 13F | Bank Of Montreal /can/ | 3.834 | 2,87 | 168 | 6,37 | ||||
| 2026-01-30 | 13F | Simplicity Wealth,LLC | 6.247 | 273 | ||||||
| 2026-02-17 | 13F | Jones Financial Companies Lllp | 4.510 | -5,05 | 197 | -0,51 | ||||
| 2026-02-03 | 13F | Detalus Advisors, LLC | 9.728 | -2,91 | 426 | 0,71 | ||||
| 2026-01-23 | 13F | Stanich Group LLC | 18.182 | -4,28 | 796 | -0,62 | ||||
| 2026-02-10 | 13F | Envestnet Asset Management Inc | 0 | -100,00 | 0 | |||||
| 2025-11-14 | 13F | High Falls Advisors, Inc | 0 | -100,00 | 0 | |||||
| 2026-01-14 | 13F | Wolff Wiese Magana Llc | 182 | -68,99 | 8 | -70,83 | ||||
| 2026-01-27 | 13F | TD Waterhouse Canada Inc. | 0 | -100,00 | 0 | -100,00 | ||||
| 2026-02-12 | 13F | Connecticut Wealth Management, LLC | 0 | -100,00 | 0 | |||||
| 2026-02-17 | 13F | United Capital Financial Advisers, Llc | 13.275 | 0,00 | 581 | 3,76 | ||||
| 2026-02-13 | 13F | Citigroup Inc | 21.313 | 14,97 | 933 | 19,33 | ||||
| 2026-02-12 | 13F | Federation des caisses Desjardins du Quebec | 165 | 0,00 | 7 | 16,67 | ||||
| 2026-02-17 | 13F | Ameriprise Financial Inc | 12.416 | -3,10 | 543 | 0,56 | ||||
| 2026-02-12 | 13F | Principal Securities, Inc. | 0 | -100,00 | 0 | -100,00 | ||||
| 2026-02-13 | 13F | Charles Schwab Investment Management Inc | 4.815.517 | -20,10 | 210.727 | -17,07 | ||||
| 2025-11-14 | 13F | Quantinno Capital Management LP | 0 | -100,00 | 0 | |||||
| 2026-01-02 | 13F | Insight Wealth Strategies, LLC | 182.293 | 0,52 | 7.977 | 4,33 | ||||
| 2026-01-27 | 13F | PFG Advisors | 5.153 | 0,94 | 225 | 4,65 | ||||
| 2025-10-23 | 13F | ShoreHaven Wealth Partners, LLC | 0 | -100,00 | 0 | |||||
| 2026-02-13 | 13F | LGT Financial Advisors LLC | 0 | -100,00 | 0 | |||||
| 2026-02-13 | 13F | MAI Capital Management | 16 | 0,00 | 1 | |||||
| 2026-01-23 | 13F | Sage Mountain Advisors LLC | 5.387 | -27,07 | 236 | -24,44 | ||||
| 2026-01-14 | 13F | Spire Wealth Management | 131 | 6 | ||||||
| 2026-02-13 | 13F | Mml Investors Services, Llc | 0 | -100,00 | 0 | |||||
| 2025-11-14 | 13F | Qube Research & Technologies Ltd | 0 | -100,00 | 0 | |||||
| 2026-01-23 | 13F | Farther Finance Advisors, LLC | 1.416 | 198,11 | 62 | 205,00 | ||||
| 2026-01-07 | 13F | Magnus Financial Group LLC | 4.736 | -0,63 | 207 | 3,50 | ||||
| 2026-01-30 | 13F | Strategic Blueprint, LLC | 0 | -100,00 | 0 | |||||
| 2026-02-02 | 13F | Robertson Stephens Wealth Management, LLC | 258.993 | 44,36 | 11.334 | 49,83 | ||||
| 2026-01-22 | 13F | Quotient Wealth Partners, LLC | 39.100 | -2,46 | 1.711 | 1,24 | ||||
| 2026-01-13 | 13F | CoreCap Advisors, LLC | 80 | -8,05 | 4 | 0,00 | ||||
| 2026-02-12 | 13F | Jane Street Group, Llc | 34.234 | 317,90 | 1.498 | 334,20 | ||||
| 2026-02-11 | 13F | SOUTH STATE Corp | 21 | 1 | ||||||
| 2026-02-12 | 13F | Founders Financial Alliance, LLC | 0 | -100,00 | 0 | |||||
| 2025-11-07 | 13F | Wealth Alliance | 0 | -100,00 | 0 | |||||
| 2026-01-20 | 13F | Wall Street Access Asset Management, LLC | 618 | 0,00 | 27 | 3,85 | ||||
| 2026-02-11 | 13F | O'shaughnessy Asset Management, Llc | 418 | 0,00 | 18 | 5,88 | ||||
| 2026-02-10 | 13F | Comprehensive Wealth Management, LLC | 38.525 | 10,28 | 1.686 | 14,47 | ||||
| 2026-02-18 | 13F | GWM Advisors LLC | 28.296 | -1,80 | 1.238 | 1,89 | ||||
| 2025-11-04 | 13F | Tsfg, Llc | 0 | -100,00 | 0 | |||||
| 2026-02-18 | 13F | Vident Advisory, LLC | 11.338 | 0,00 | 496 | 3,77 | ||||
| 2026-02-17 | 13F | EFG International AG | 7.200 | 315 | ||||||
| 2026-02-13 | 13F | Resources Investment Advisors, LLC. | 7.636 | -21,63 | 334 | -18,54 | ||||
| 2025-11-24 | 13F | CIBC Private Wealth Group, LLC | 0 | -100,00 | 0 | -100,00 | ||||
| 2026-02-10 | 13F | Goldman Sachs Group Inc | 139.649 | 0,00 | 6.111 | 3,79 | ||||
| 2026-02-17 | 13F | Citadel Advisors Llc | 45.625 | -58,27 | 1.997 | -56,70 | ||||
| 2026-02-17 | 13F | Royal Bank Of Canada | 57.238 | 0,53 | 2.505 | 4,38 | ||||
| 2026-02-03 | 13F | Orion Capital Management LLC | 0 | -100,00 | 0 | |||||
| 2026-01-20 | 13F | Ascent Group, LLC | 5.675 | -8,54 | 248 | -4,98 | ||||
| 2026-02-17 | 13F | Bank Of America Corp /de/ | 278.874 | -4,10 | 12.204 | -0,47 | ||||
| 2026-01-21 | 13F | Flagship Harbor Advisors, Llc | 2.325 | 102 | ||||||
| 2026-02-12 | 13F | IFC & Insurance Marketing, Inc. | 793 | 0 | ||||||
| 2026-02-17 | 13F | Advisory Services Network, LLC | 0 | -100,00 | 0 | |||||
| 2026-02-10 | 13F | Three Bridge Wealth Advisors, LLC | 9.452 | 414 | ||||||
| 2026-02-13 | 13F | Flow Traders U.s. Llc | 39.647 | -80,21 | 2 | -87,50 | ||||
| 2026-02-13 | 13F | Aptus Capital Advisors, LLC | 0 | -100,00 | 0 | |||||
| 2026-02-11 | 13F | Jpmorgan Chase & Co | 243.113 | -14,97 | 10.639 | -11,75 | ||||
| 2026-01-23 | 13F | Assetmark, Inc | 88 | 300,00 | 4 | |||||
| 2026-02-10 | 13F | New Republic Capital, LLC | 160 | 100,00 | 7 | 133,33 | ||||
| 2026-02-12 | 13F | Great Valley Advisor Group, Inc. | 5.380 | 0,00 | 235 | 3,98 | ||||
| 2026-02-13 | 13F | Kestra Advisory Services, LLC | 0 | -100,00 | 0 | |||||
| 2026-01-26 | 13F | Cwm, Llc | 1.237 | 1,64 | 0 | |||||
| 2026-02-06 | 13F | IFP Advisors, Inc | 195 | -1,02 | 9 | 0,00 | ||||
| 2026-02-13 | 13F | Morgan Stanley | 155.101 | 10,42 | 6.787 | 14,61 | ||||
| 2026-02-06 | 13F | Larson Financial Group LLC | 500 | -27,43 | 22 | -27,59 | ||||
| 2026-01-29 | 13F | UBS Group AG | 223.513 | -1,02 | 9.781 | 2,72 | ||||
| 2026-02-10 | 13F/A | Northwestern Mutual Wealth Management Co | 146.978 | 0,33 | 6.432 | 4,13 | ||||
| 2026-02-09 | 13F | Prospera Financial Services Inc | 18.022 | 1,20 | 789 | 5,07 | ||||
| 2025-10-08 | 13F/A | New York State Common Retirement Fund | 0 | -100,00 | 0 | -100,00 | ||||
| 2025-11-06 | 13F | ONE Advisory Partners, LLC | 0 | -100,00 | 0 | |||||
| 2026-01-26 | 13F | AE Wealth Management LLC | 257 | 15,77 | 11 | 22,22 | ||||
| 2026-02-13 | 13F | Wells Fargo & Company/mn | 41.456 | -4,79 | 1.814 | -1,14 | ||||
| 2026-01-09 | 13F | Diversified Trust Co | 14.860 | 0,00 | 650 | 3,83 | ||||
| 2026-02-06 | 13F | Global Retirement Partners, LLC | 1.209 | -14,56 | 53 | -11,86 | ||||
| 2026-02-18 | 13F | EP Wealth Advisors, Inc. | 245.884 | -2,94 | 10.760 | 3,51 | ||||
| 2026-02-17 | 13F | Raymond James Financial Inc | 6.736 | 9,67 | 295 | 13,95 | ||||
| 2026-01-30 | 13F | Us Bancorp \de\ | 21.073 | -1,65 | 922 | 2,10 | ||||
| 2026-02-13 | 13F | Mariner, LLC | 6.646 | 291 | ||||||
| 2026-02-13 | 13F | Integrated Wealth Concepts LLC | 0 | -100,00 | 0 | |||||
| 2026-02-03 | 13F | SBI Securities Co., Ltd. | 307 | -26,38 | 13 | -23,53 | ||||
| 2026-01-21 | 13F | Capital Investment Advisory Services, LLC | 3.983 | 174 | ||||||
| 2026-01-16 | 13F | Formidable Asset Management, LLC | 9.153 | 8,58 | 386 | 11,59 | ||||
| 2026-01-29 | 13F | Sanctuary Advisors, LLC | 24.147 | -13,00 | 1.057 | -9,74 | ||||
| 2026-02-11 | 13F | LPL Financial LLC | 220.402 | -4,03 | 9.645 | -0,39 | ||||
| 2026-02-12 | 13F | Summit Financial, LLC | 51.759 | -1,14 | 2.265 | 2,58 | ||||
| 2026-02-12 | 13F | Sumitomo Mitsui Financial Group, Inc. | 0 | -100,00 | 0 | |||||
| 2026-02-17 | 13F | Tower Research Capital LLC (TRC) | 3 | -99,24 | 0 | -100,00 | ||||
| 2026-02-02 | 13F | One Wealth Advisors, LLC | 0 | -100,00 | 0 | |||||
| 2026-02-11 | 13F | Franklin Resources Inc | 145 | 6 | ||||||
| 2025-11-12 | 13F | Banco Santander, S.A. | 0 | -100,00 | 0 | |||||
| 2026-01-20 | 13F | AdvisorNet Financial, Inc | 58 | 0,00 | 3 | 0,00 | ||||
| 2026-02-17 | 13F | WFA of San Diego, LLC | 0 | -100,00 | 0 | |||||
| 2026-02-06 | 13F | HighTower Advisors, LLC | 308.705 | 0,28 | 13.509 | 4,07 |