Grundlæggende statistik
| Institutionelle aktier (lange) | 20.911.636 - 82,92% (ex 13D/G) - change of -7,47MM shares -26,31% MRQ |
| Institutionel værdi (lang) | $ 395.857 USD ($1000) |
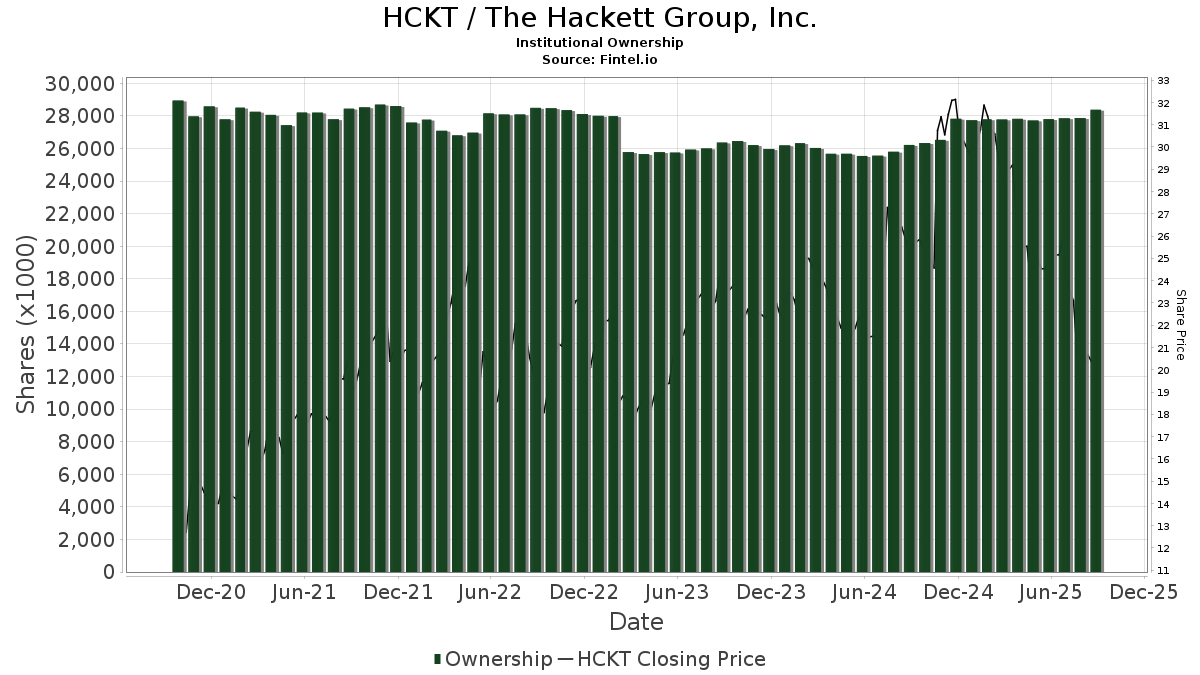
Institutionelt ejerskab og aktionærer
The Hackett Group, Inc. (US:HCKT) har 159 institutionelle ejere og aktionærer, der har indsendt 13D/G- eller 13F-formularer til Securities Exchange Commission (SEC). Disse institutioner har i alt 20,911,636 aktier. Største aktionærer omfatter Royce & Associates Lp, BlackRock, Inc., Vanguard Group Inc, Renaissance Technologies Llc, Dimensional Fund Advisors Lp, Bank Of America Corp /de/, State Street Corp, Geode Capital Management, Llc, Morgan Stanley, and Trigran Investments, Inc. .
The Hackett Group, Inc. (NasdaqGS:HCKT) institutionel ejerskabsstruktur viser aktuelle positioner i virksomheden efter institutioner og fonde, samt seneste ændringer i positionsstørrelse. Større aktionærer kan omfatte individuelle investorer, investeringsforeninger, hedgefonde eller institutioner. Skema 13D angiver, at investoren besidder (eller besidder) mere end 5 % af virksomheden og har til hensigt (eller har til hensigt at) aktivt at forfølge en ændring i forretningsstrategi. Skema 13G indikerer en passiv investering på over 5%.
The share price as of April 24, 2026 is 12,98 / share. Previously, on April 28, 2025, the share price was 25,34 / share. This represents a decline of 48,78% over that period.
Fondens stemningsscore
Fund Sentiment Score (fka Ownership Accumulation Score) finder de aktier, der bliver mest købt af fonde. Det er resultatet af en sofistikeret, multi-faktor kvantitativ model, der identificerer virksomheder med de højeste niveauer af institutionel akkumulering. Scoringsmodellen bruger en kombination af den samlede stigning i oplyste ejere, ændringerne i porteføljeallokeringer i disse ejere og andre målinger. Tallet går fra 0 til 100, hvor højere tal indikerer et højere niveau af akkumulering for sine jævnaldrende, og 50 er gennemsnittet.
Opdateringsfrekvens: Dagligt
Se Ownership Explorer, som giver en liste over højest rangerende virksomheder.
AI+ Ask Fintel’s AI assistant about The Hackett Group, Inc..
Select a question to share a public post with an AI-crafted answer.
Thinking of good questions…
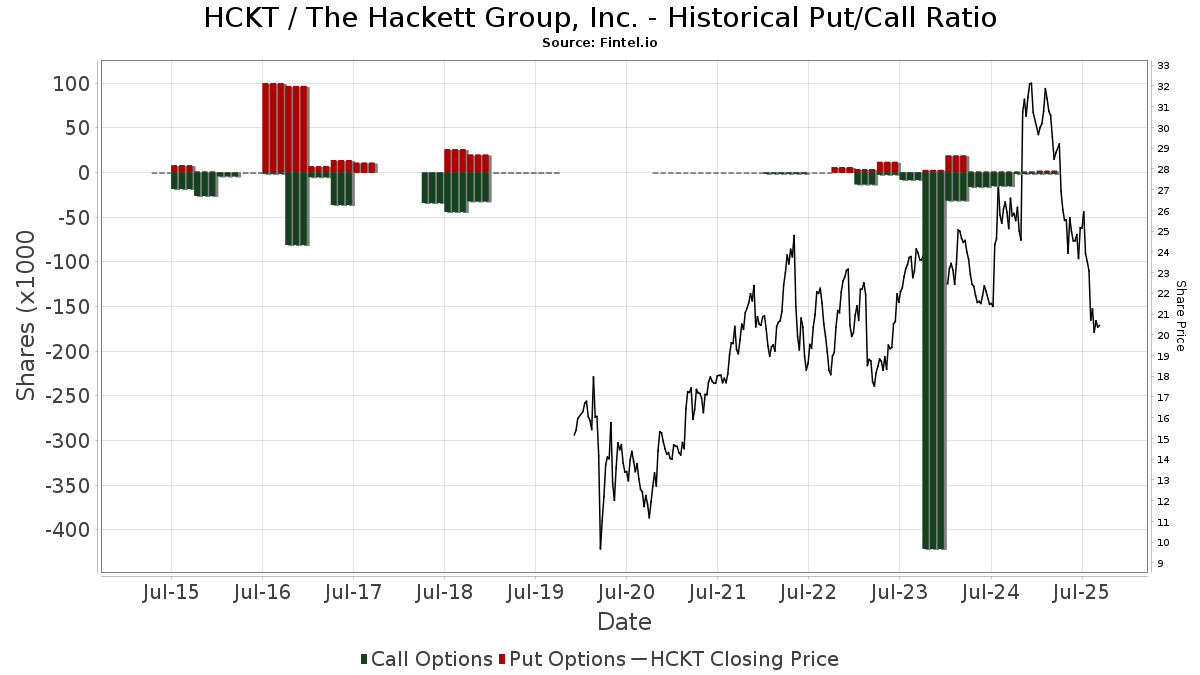
Institutionel Put/Call-forhold
Ud over at indberette standardaktie- og gældsudstedelser skal institutter med mere end 100 mill. aktiver under forvaltning også oplyse deres put- og call-optionsbeholdninger. Da salgsoptioner generelt indikerer negativ stemning, og købsoptioner indikerer positiv stemning, kan vi få en fornemmelse af den overordnede institutionelle stemning ved at plotte forholdet mellem put og kald. Diagrammet til højre viser det historiske put/call-forhold for dette instrument.
Brug af Put/Call Ratio som en indikator for investorernes stemning overvinder en af de vigtigste mangler ved at bruge totalt institutionelt ejerskab, som er, at en betydelig mængde af aktiver under forvaltning investeres passivt for at spore indekser. Passivt forvaltede fonde køber typisk ikke optioner, så indikatoren for put/call-forholdet følger mere nøje følelsen af aktivt forvaltede fonde.
13D/G-arkivering
Vi præsenterer 13D/G ansøgninger separat fra 13F ansøgninger på grund af den forskellige behandling af SEC. 13D/G-ansøgninger kan indgives af grupper af investorer (med én ledende), hvorimod 13F-ansøgninger ikke kan. Dette resulterer i situationer, hvor en investor kan indsende en 13D/G, der rapporterer én værdi for de samlede aktier (der repræsenterer alle de aktier, der ejes af investorgruppen), men derefter indsender en 13F, der rapporterer en anden værdi for de samlede aktier (der udelukkende repræsenterer deres egne) ejendomsret). Det betyder, at aktieejerskab af 13D/G-arkiver og 13F-arkiveringer ofte ikke er direkte sammenlignelige, så vi præsenterer dem separat.
Bemærk: Fra den 16. maj 2021 viser vi ikke længere ejere, der ikke har indsendt en 13D/G inden for det seneste år. Tidligere viste vi den fulde historie af 13D/G-arkiver. Generelt skal enheder, der er forpligtet til at indgive 13D/G-ansøgninger, indgive mindst årligt, før de indsender en afsluttende ansøgning. Dog forlader fonde nogle gange positioner uden at indsende en afsluttende ansøgning (dvs. de afvikler), så visning af den fulde historie resulterede nogle gange i forvirring om det nuværende ejerskab. For at undgå forvirring viser vi nu kun 'aktuelle' ejere - det vil sige - ejere, der har anmeldt inden for det seneste år.
Upgrade to unlock premium data.
| Fil dato | Form | Investor | Forrige Aktier |
Seneste Aktier |
Δ Aktier (Procent) |
Ejendomsret (Procent) |
Δ Ejerskab (Procent) |
|
|---|---|---|---|---|---|---|---|---|
| 2026-03-27 | VANGUARD GROUP INC | 2,261,104 | 0 | -100.00 | 0.00 | -100.00 | ||
| 2026-03-03 | ROYCE & ASSOCIATES LP | 2,580,252 | 2,962,097 | 14.80 | 11.67 | 24.41 | ||
| 2025-04-24 | BlackRock, Inc. | 2,371,588 | 1,899,966 | -19.89 | 6.90 | -20.69 |
13F og NPORT arkivering
Detaljer om 13F-arkivering er gratis. Detaljer om NP-ansøgninger kræver et premium-medlemskab. Grønne rækker angiver nye positioner. Røde rækker angiver lukkede positioner. Klik på linket ikon for at se den fulde transaktionshistorik.
Opgrader
for at låse premium-data op og eksportere til Excel ![]() .
.
| Fil dato | Kilde | Investor | Type | Gennemsnitlig pris (Øst) |
Aktier | Δ Aktier (%) |
Rapporteret Værdi ($1000) |
Δ Værdi (%) |
Port Alloc (%) |
|
|---|---|---|---|---|---|---|---|---|---|---|
| 2026-02-13 | 13F | Y-Intercept (Hong Kong) Ltd | 61.324 | 1.204 | ||||||
| 2026-02-17 | 13F | Russell Investments Group, Ltd. | 429.032 | 7,04 | 8.422 | 10,53 | ||||
| 2026-01-29 | 13F | Concord Wealth Partners | 30 | 0,00 | 1 | |||||
| 2026-02-19 | 13F | Invesco Ltd. | 42.010 | 7,14 | 825 | 10,60 | ||||
| 2026-02-11 | 13F | Franklin Resources Inc | 55.207 | 6,18 | 1.084 | 9,62 | ||||
| 2026-02-09 | 13F | Geode Capital Management, Llc | 644.918 | -3,60 | 12.662 | -0,46 | ||||
| 2026-02-17 | 13F | Tower Research Capital LLC (TRC) | 1.050 | 2,34 | 21 | 5,26 | ||||
| 2025-11-14 | 13F | Northwestern Mutual Wealth Management Co | 0 | -100,00 | 0 | -100,00 | ||||
| 2026-02-11 | 13F | Barrow Hanley Mewhinney & Strauss Llc | 46 | 0,00 | 1 | |||||
| 2026-02-13 | 13F | Charles Schwab Investment Management Inc | 196.021 | -6,60 | 3.848 | -3,56 | ||||
| 2026-02-12 | 13F | Jane Street Group, Llc | 60.557 | -23,33 | 1.189 | -20,85 | ||||
| 2026-02-12 | 13F | Moneta Group Investment Advisors Llc | 0 | -100,00 | 0 | |||||
| 2026-02-12 | 13F | Swiss National Bank | 48.092 | 0,00 | 944 | 3,28 | ||||
| 2026-04-20 | 13F/A | OP Asset Management Ltd | 0 | -100,00 | 0 | -100,00 | ||||
| 2026-02-04 | 13F | Pacific Ridge Capital Partners, LLC | 52.390 | 33,31 | 1.028 | 37,62 | ||||
| 2026-02-17 | 13F | SageView Advisory Group, LLC | 130 | 3 | ||||||
| 2026-02-03 | 13F | SBI Securities Co., Ltd. | 7 | 0,00 | 0 | |||||
| 2026-04-17 | 13F | IFC & Insurance Marketing, Inc. | 0 | -100,00 | 0 | |||||
| 2025-11-14 | 13F | Susquehanna International Group, Llp | 0 | -100,00 | 0 | |||||
| 2026-02-05 | 13F | Bessemer Group Inc | 817 | 0,00 | 0 | |||||
| 2026-02-11 | 13F | Ameritas Investment Partners, Inc. | 2.467 | 48 | ||||||
| 2026-02-17 | 13F | Raymond James Financial Inc | 60.312 | -22,64 | 1.184 | -20,18 | ||||
| 2025-11-10 | 13F | Colonial Trust Co / SC | 0 | -100,00 | 0 | |||||
| 2026-04-23 | 13F | Weber Capital Management Llc /adv | 225.663 | -3,42 | 2.936 | -36,00 | ||||
| 2026-04-07 | 13F | Farther Finance Advisors, LLC | 1.471 | -74,88 | 19 | -84,21 | ||||
| 2026-02-17 | 13F | Wiley Bros.-aintree Capital, Llc | 19.934 | 2,47 | 359 | -2,19 | ||||
| 2025-11-14 | 13F | Truvestments Capital Llc | 0 | -100,00 | 0 | -100,00 | ||||
| 2026-02-12 | 13F | MetLife Investment Management, LLC | 14.586 | 0,00 | 286 | 3,25 | ||||
| 2026-02-06 | 13F | Pnc Financial Services Group, Inc. | 1.492 | 51,93 | 29 | 61,11 | ||||
| 2026-02-17 | 13F | Citadel Advisors Llc | 161.842 | 11,05 | 3.177 | 14,66 | ||||
| 2026-02-17 | 13F | California State Teachers Retirement System | 22.978 | -0,08 | 451 | 3,20 | ||||
| 2026-02-13 | 13F | Kilter Group LLC | 88 | 2 | ||||||
| 2026-04-13 | 13F | Massmutual Trust Co Fsb/adv | 116 | 2 | ||||||
| 2026-02-17 | 13F | Bank Of America Corp /de/ | 815.056 | -10,27 | 16.000 | -7,35 | ||||
| 2026-02-17 | 13F | Engineers Gate Manager LP | 16.580 | -68,34 | 325 | -67,34 | ||||
| 2026-02-12 | 13F | Aviva Plc | 0 | -100,00 | 0 | |||||
| 2026-02-13 | 13F | Great West Life Assurance Co /can/ | 1.332 | 0,00 | 0 | |||||
| 2026-02-10 | 13F | Intech Investment Management Llc | 0 | -100,00 | 0 | |||||
| 2026-02-13 | 13F | Boston Partners | 0 | -100,00 | 0 | |||||
| 2026-04-09 | 13F | Tompkins Financial Corp | 0 | -100,00 | 0 | |||||
| 2026-02-17 | 13F | Prelude Capital Management, Llc | 50.000 | 982 | ||||||
| 2025-11-14 | 13F | CI Private Wealth, LLC | 0 | -100,00 | 0 | |||||
| 2026-02-13 | 13F | SRS Capital Advisors, Inc. | 2 | -99,50 | 0 | -100,00 | ||||
| 2026-04-22 | 13F | Sterling Capital Management LLC | 212 | -28,62 | 3 | -60,00 | ||||
| 2026-02-13 | 13F | Stifel Financial Corp | 0 | -100,00 | 0 | |||||
| 2026-02-13 | 13F | Parkside Financial Bank & Trust | 60 | -95,81 | 1 | -96,30 | ||||
| 2026-01-27 | 13F | Acuitas Investments, LLC | 0 | -100,00 | 0 | |||||
| 2025-11-13 | 13F | Hsbc Holdings Plc | 0 | -100,00 | 0 | -100,00 | ||||
| 2026-02-13 | 13F | American Century Companies Inc | 63.193 | -3,42 | 1.240 | -0,24 | ||||
| 2026-01-27 | 13F | Zurcher Kantonalbank (Zurich Cantonalbank) | 5.785 | 0,00 | 114 | 3,67 | ||||
| 2026-02-13 | 13F | Verition Fund Management LLC | 0 | -100,00 | 0 | |||||
| 2026-02-12 | 13F | Skopos Labs, Inc. | 24.789 | 495 | ||||||
| 2026-04-20 | 13F | Williams & Novak, LLC | 13.591 | 175 | ||||||
| 2026-02-10 | 13F | Goldman Sachs Group Inc | 401.972 | 123,43 | 7.891 | 130,70 | ||||
| 2026-02-09 | 13F | Harbour Investments, Inc. | 0 | -100,00 | 0 | |||||
| 2026-02-17 | 13F | Fmr Llc | 6.511 | 124,52 | 128 | 130,91 | ||||
| 2026-02-12 | 13F | Principal Securities, Inc. | 0 | -100,00 | 0 | -100,00 | ||||
| 2026-01-28 | 13F | Teacher Retirement System Of Texas | 163.861 | -23,06 | 3.217 | -20,55 | ||||
| 2026-02-02 | 13F | Principal Financial Group Inc | 56.310 | 46,69 | 1.105 | 51,58 | ||||
| 2026-02-13 | 13F | Sei Investments Co | 44.671 | -12,64 | 877 | -9,88 | ||||
| 2025-11-13 | 13F | Norges Bank | 0 | -100,00 | 0 | |||||
| 2026-01-29 | 13F | Copeland Capital Management, LLC | 3.299 | 0,00 | 65 | 3,23 | ||||
| 2026-02-13 | 13F | Morgan Stanley | 642.156 | 23,95 | 12.606 | 28,00 | ||||
| 2026-02-06 | 13F | Covestor Ltd | 16 | -15,79 | 0 | |||||
| 2026-02-11 | 13F | Jpmorgan Chase & Co | 145.545 | -17,13 | 2.857 | -14,41 | ||||
| 2026-02-09 | 13F | Quest Partners LLC | 4.409 | 6,50 | 87 | 10,26 | ||||
| 2026-02-05 | 13F | Plante Moran Financial Advisors, LLC | 210 | 4 | ||||||
| 2026-02-13 | 13F | First Trust Advisors Lp | 40.373 | 25,46 | 793 | 29,62 | ||||
| 2026-02-13 | 13F | Ariel Investments, Llc | 428.199 | -1,72 | 8.406 | 1,49 | ||||
| 2025-11-14 | 13F | Quarry LP | 0 | -100,00 | 0 | |||||
| 2026-01-29 | 13F | Vanguard Group Inc | 1.961.581 | -12,37 | 38.506 | -9,51 | ||||
| 2026-02-17 | 13F | Aquatic Capital Management LLC | 21.948 | 15.356,34 | 431 | 21.400,00 | ||||
| 2026-02-17 | 13F | Advisor Group Holdings, Inc. | 401 | 82,27 | 8 | 75,00 | ||||
| 2026-02-17 | 13F | Cetera Investment Advisers | 37.433 | -15,89 | 735 | -13,24 | ||||
| 2026-02-03 | 13F | Bokf, Na | 10.148 | -6,65 | 199 | -3,40 | ||||
| 2026-02-10 | 13F | Bank of New York Mellon Corp | 85.263 | -59,39 | 1.674 | -58,08 | ||||
| 2026-03-04 | 13F | SHP Wealth Management | 75 | 1 | ||||||
| 2026-02-17 | 13F | Watershed Asset Management, L.L.C. | 0 | -100,00 | 0 | -100,00 | ||||
| 2025-11-13 | 13F | Altshuler Shaham Ltd | 0 | -100,00 | 0 | |||||
| 2026-02-10 | 13F | State of Wyoming | 14.675 | -42,44 | 288 | -40,50 | ||||
| 2026-02-17 | 13F | Optiver Holding B.V. | 168 | 0,00 | 3 | 0,00 | ||||
| 2026-01-27 | 13F | Evergreen Capital Management Llc | 16.517 | 326 | ||||||
| 2026-02-12 | 13F | Quadrant Capital Group Llc | 2.103 | 41 | ||||||
| 2026-02-13 | 13F | Police & Firemen's Retirement System of New Jersey | 6.931 | 0,00 | 136 | 3,82 | ||||
| 2026-02-13 | 13F | Wells Fargo & Company/mn | 274.407 | -0,92 | 5.387 | 2,32 | ||||
| 2026-02-13 | 13F | State Street Corp | 748.002 | -6,90 | 14.772 | -3,84 | ||||
| 2026-02-17 | 13F | Qube Research & Technologies Ltd | 88.763 | -50,28 | 1.742 | -48,67 | ||||
| 2026-01-26 | 13F | Cwm, Llc | 3.499 | 31,34 | 0 | |||||
| 2026-02-11 | 13F | Allianz Asset Management GmbH | 108.300 | 28,17 | 2.126 | 32,32 | ||||
| 2026-02-17 | 13F | Creative Planning | 127.138 | 683,40 | 2.496 | 710,06 | ||||
| 2026-04-10 | 13F | Linden Thomas Advisory Services, LLC | 135.116 | 38,13 | 1.758 | -8,49 | ||||
| 2026-02-13 | 13F | Trigran Investments, Inc. | 521.758 | -34,49 | 10.242 | -32,35 | ||||
| 2025-11-14 | 13F | Brevan Howard Capital Management LP | 0 | -100,00 | 0 | -100,00 | ||||
| 2026-04-21 | 13F | Pinnacle Associates Ltd | 0 | -100,00 | 0 | |||||
| 2026-02-12 | 13F | Aristides Capital LLC | 172.373 | 4,18 | 3.384 | 7,57 | ||||
| 2026-02-09 | 13F | Fisher Asset Management, LLC | 45.982 | 13,35 | 903 | 16,99 | ||||
| 2026-02-18 | 13F | GWM Advisors LLC | 259 | -45,24 | 5 | -37,50 | ||||
| 2026-02-13 | 13F | Aptus Capital Advisors, LLC | 0 | -100,00 | 0 | |||||
| 2026-02-13 | 13F | Martingale Asset Management L P | 0 | -100,00 | 0 | -100,00 | ||||
| 2026-01-15 | 13F | Nisa Investment Advisors, Llc | 1.055 | 7.435,71 | 21 | |||||
| 2026-02-10 | 13F | Envestnet Asset Management Inc | 212.405 | -8,95 | 4.170 | -5,98 | ||||
| 2026-02-02 | 13F | Seizert Capital Partners, Llc | 11.732 | 0,00 | 230 | 3,14 | ||||
| 2026-04-06 | 13F | Versant Capital Management, Inc | 8.183 | 138,36 | 106 | 58,21 | ||||
| 2026-04-20 | 13F | Inscription Capital, LLC | 22.500 | 293 | ||||||
| 2026-01-30 | 13F | Us Bancorp \de\ | 483 | 8,05 | 9 | 12,50 | ||||
| 2026-02-03 | 13F | Wesbanco Bank Inc | 0 | -100,00 | 0 | |||||
| 2026-02-02 | 13F | Cornerstone Planning Group LLC | 0 | -100,00 | 0 | |||||
| 2026-02-10 | 13F | Bnp Paribas Arbitrage, Sa | 6.172 | 10,23 | 121 | 14,15 | ||||
| 2025-11-12 | 13F | Integrated Quantitative Investments LLC | 0 | -100,00 | 0 | |||||
| 2026-02-17 | 13F | Ancora Advisors, LLC | 7.674 | -54,84 | 151 | -53,56 | ||||
| 2025-11-13 | 13F | Magnetar Financial LLC | 0 | -100,00 | 0 | -100,00 | ||||
| 2026-02-06 | 13F | Lsv Asset Management | 81.400 | 0,00 | 2 | 0,00 | ||||
| 2026-02-12 | 13F | Renaissance Technologies Llc | 1.014.639 | -22,67 | 19.917 | -20,15 | ||||
| 2026-04-17 | 13F | Bell Investment Advisors, Inc | 36 | 0 | ||||||
| 2026-02-13 | 13F | Dynamic Technology Lab Private Ltd | 0 | -100,00 | 0 | |||||
| 2025-11-21 | 13F | Nebula Research & Development LLC | 0 | -100,00 | 0 | -100,00 | ||||
| 2026-02-17 | 13F | Alliancebernstein L.p. | 26.579 | -3,20 | 522 | 0,00 | ||||
| 2026-02-12 | 13F | Earnest Partners Llc | 368.778 | -6,22 | 7.239 | -3,16 | ||||
| 2026-02-04 | 13F | Atlantic Union Bankshares Corp | 245 | 0,00 | 5 | 0,00 | ||||
| 2026-02-12 | 13F | Dimensional Fund Advisors Lp | 849.254 | -8,39 | 16.671 | -5,40 | ||||
| 2026-02-17 | 13F | Millennium Management Llc | 405.755 | -49,75 | 7.965 | -48,11 | ||||
| 2025-11-14 | 13F | Squarepoint Ops LLC | 0 | -100,00 | 0 | |||||
| 2026-02-17 | 13F | Royal Bank Of Canada | 3.986 | -95,22 | 79 | -95,02 | ||||
| 2026-02-17 | 13F | Aqr Capital Management Llc | 44.573 | 1,94 | 875 | 5,17 | ||||
| 2026-02-05 | 13F | Isthmus Partners, Llc | 164.398 | 3,92 | 3.227 | 7,32 | ||||
| 2026-02-11 | 13F | Parallel Advisors, LLC | 171 | 21,28 | 3 | 50,00 | ||||
| 2026-02-13 | 13F | Smartleaf Asset Management LLC | 230 | -52,38 | 5 | -55,56 | ||||
| 2026-02-13 | 13F | Caitong International Asset Management Co., Ltd | 1.144 | 18.966,67 | 22 | |||||
| 2026-02-17 | 13F | Crawford Investment Counsel Inc | 0 | -100,00 | 0 | |||||
| 2026-02-17 | 13F | Quantinno Capital Management LP | 30.573 | 60,14 | 600 | 65,75 | ||||
| 2026-01-29 | 13F | Camelot Portfolios, LLC | 350 | 7 | ||||||
| 2026-02-13 | 13F | MAI Capital Management | 1.330 | -23,12 | 26 | -18,75 | ||||
| 2025-11-14 | 13F | Dean Investment Associates, Llc | 0 | -100,00 | 0 | |||||
| 2026-03-16 | 13F/A | Rockefeller Capital Management L.P. | 865 | 1.135,71 | 17 | 1.500,00 | ||||
| 2026-02-12 | 13F | Hrt Financial Lp | 74.653 | 59,47 | 1 | |||||
| 2026-02-17 | 13F | Two Sigma Advisers, Lp | 462.000 | -2,61 | 9.069 | 0,57 | ||||
| 2026-02-10 | 13F | Bruce G. Allen Investments, LLC | 0 | -100,00 | 0 | |||||
| 2026-02-02 | 13F | Danske Bank A/s | 2.500 | 49 | ||||||
| 2026-02-17 | 13F | Northern Trust Corp | 231.711 | -12,04 | 4.548 | -9,17 | ||||
| 2026-04-23 | 13F | SJS Investment Consulting Inc. | 3 | 0 | ||||||
| 2026-01-27 | 13F | WealthCollab, LLC | 640 | -49,84 | 13 | -50,00 | ||||
| 2026-02-10 | 13F | Rothschild Investment Llc | 80 | 300,00 | 2 | |||||
| 2026-02-05 | 13F | Allworth Financial LP | 141 | 113,64 | 3 | 100,00 | ||||
| 2026-04-16 | 13F | SG Americas Securities, LLC | 166.458 | 160,82 | 2 | 100,00 | ||||
| 2026-02-13 | 13F | Grandeur Peak Global Advisors, LLC | 17.270 | -79,41 | 339 | -78,73 | ||||
| 2026-01-20 | 13F | Harbor Capital Advisors, Inc. | 69.096 | -8,67 | 1 | 0,00 | ||||
| 2026-02-09 | 13F | Huntington National Bank | 2.138 | 30,76 | 42 | 32,26 | ||||
| 2026-04-16 | 13F | CWC Advisors, LLC. | 16.216 | 5,15 | 211 | -30,46 | ||||
| 2025-11-14 | 13F | Mml Investors Services, Llc | 0 | -100,00 | 0 | |||||
| 2026-02-17 | 13F | Graham Capital Management, L.P. | 21.843 | 117,60 | 429 | 125,26 | ||||
| 2025-11-14 | 13F | State Board Of Administration Of Florida Retirement System | 0 | -100,00 | 0 | -100,00 | ||||
| 2026-02-11 | 13F | Deutsche Bank Ag\ | 18.351 | 0,00 | 360 | 3,45 | ||||
| 2026-04-10 | 13F | Quaker Wealth Management, LLC | 1.143 | 0,00 | 15 | -36,36 | ||||
| 2026-04-07 | 13F | Signaturefd, Llc | 3.418 | 613,57 | 44 | 388,89 | ||||
| 2026-02-06 | 13F | Gsa Capital Partners Llp | 71.359 | 154,34 | 1 | |||||
| 2025-11-07 | 13F | Fifth Third Bancorp | 0 | -100,00 | 0 | |||||
| 2026-02-17 | 13F | MIRAE ASSET GLOBAL ETFS HOLDINGS Ltd. | 11.687 | -1,36 | 229 | 1,78 | ||||
| 2025-11-14 | 13F | Manufacturers Life Insurance Company, The | 0 | -100,00 | 0 | |||||
| 2026-02-05 | 13F | Amalgamated Bank | 789 | -10,14 | 0 | |||||
| 2025-11-12 | 13F | Steward Partners Investment Advisory, Llc | 0 | -100,00 | 0 | -100,00 | ||||
| 2026-01-28 | 13F | Klp Kapitalforvaltning As | 5.200 | -85,83 | 103 | -85,45 | ||||
| 2026-02-11 | 13F | Los Angeles Capital Management Llc | 40 | 1 | ||||||
| 2026-02-06 | 13F | Global Retirement Partners, LLC | 35 | 1 | ||||||
| 2026-02-11 | 13F | Simplex Trading, Llc | 672 | 13 | ||||||
| 2026-02-12 | 13F | Nuveen, LLC | 73.038 | 0,00 | 1.434 | 3,24 | ||||
| 2026-02-10 | 13F | Globeflex Capital L P | 76.921 | 0,00 | 1.510 | 3,21 | ||||
| 2026-02-13 | 13F | Rhumbline Advisers | 135.975 | -7,29 | 2.669 | -4,27 | ||||
| 2026-02-17 | 13F | Two Sigma Investments, Lp | 476.150 | 18,49 | 9.347 | 22,35 | ||||
| 2026-02-17 | 13F | Janus Henderson Group Plc | 11.154 | 0,00 | 219 | 2,83 | ||||
| 2026-02-17 | 13F | Punch & Associates Investment Management, Inc. | 427.053 | -0,37 | 8.383 | 2,88 | ||||
| 2026-02-12 | 13F | New York State Common Retirement Fund | 9.411 | 0,00 | 185 | 3,37 | ||||
| 2026-01-30 | 13F | Torren Management, LLC | 514 | 10 | ||||||
| 2026-02-17 | 13F | Price T Rowe Associates Inc /md/ | 64.390 | 51,14 | 1 | |||||
| 2026-02-06 | 13F | Bare Financial Services, Inc | 58 | 123,08 | 1 | |||||
| 2026-02-17 | 13F | Jones Financial Companies Lllp | 48 | 0,00 | 1 | |||||
| 2026-02-09 | 13F | Legal & General Group Plc | 26.105 | -0,52 | 512 | 2,81 | ||||
| 2025-11-13 | 13F | Clear Street Markets Llc | 0 | -100,00 | 0 | -100,00 | ||||
| 2026-04-13 | 13F | IFP Advisors, Inc | 1.156 | 10,31 | 15 | -25,00 | ||||
| 2026-01-29 | 13F | UBS Group AG | 411.992 | 207,45 | 8.087 | 217,51 | ||||
| 2025-11-12 | 13F | Legato Capital Management LLC | 0 | -100,00 | 0 | -100,00 | ||||
| 2026-01-23 | 13F | Avion Wealth | 26 | 0 | ||||||
| 2026-02-13 | 13F | Citigroup Inc | 6.363 | -19,09 | 125 | -16,78 | ||||
| 2026-04-15 | 13F | Exchange Traded Concepts, Llc | 17.464 | 37,92 | 227 | -8,47 | ||||
| 2025-11-20 | 13F/A | BRYN MAWR TRUST Co | 0 | -100,00 | 0 | -100,00 | ||||
| 2026-02-12 | 13F | BlackRock, Inc. | 2.062.909 | 7,13 | 40.495 | 10,63 | ||||
| 2026-02-06 | 13F | EverSource Wealth Advisors, LLC | 16 | 433,33 | 0 | |||||
| 2026-04-06 | 13F | GAMMA Investing LLC | 2.879 | 312,46 | 37 | 184,62 | ||||
| 2026-02-13 | 13F | Barclays Plc | 45.706 | 8,13 | 897 | 11,71 | ||||
| 2026-02-13 | 13F | Ubs Asset Management Americas Inc | 37.946 | 70,50 | 745 | 75,89 | ||||
| 2026-02-11 | 13F | Simplex Trading, Llc | Call | 0 | -100,00 | 0 | ||||
| 2026-02-17 | 13F | D. E. Shaw & Co., Inc. | 87.936 | 4,79 | 1.726 | 8,21 | ||||
| 2026-04-17 | 13F | Values First Advisors, Inc. | 63.350 | 2,81 | 824 | -31,84 | ||||
| 2026-02-17 | 13F | EJF Capital LLC | 85.000 | 1.669 | ||||||
| 2026-04-23 | 13F | Harbor Investment Advisory, Llc | 294 | 4 | ||||||
| 2026-02-18 | 13F | Mackenzie Financial Corp | 17.709 | -74,08 | 350 | -73,04 | ||||
| 2026-02-17 | 13F | Wellington Management Group Llp | 0 | -100,00 | 0 | |||||
| 2026-02-13 | 13F | Baird Financial Group, Inc. | 11.424 | 0,00 | 224 | 3,23 | ||||
| 2025-11-14 | 13F | Balyasny Asset Management Llc | 0 | -100,00 | 0 | -100,00 | ||||
| 2026-04-16 | 13F | Uhlmann Price Securities, Llc | 40.681 | 0,00 | 529 | -33,71 | ||||
| 2026-02-12 | 13F | Campbell & CO Investment Adviser LLC | 77.941 | 78,42 | 1.530 | 84,22 | ||||
| 2025-11-14 | 13F | Lazard Asset Management Llc | 0 | -100,00 | 0 | |||||
| 2026-04-13 | 13F | True Wealth Design, LLC | 21 | 0 | ||||||
| 2025-11-14 | 13F | Dean Capital Management | 0 | -100,00 | 0 | -100,00 | ||||
| 2026-02-09 | 13F | Hartland & Co., LLC | 0 | -100,00 | 0 | |||||
| 2026-02-09 | 13F | Royce & Associates Lp | 2.642.287 | 2,36 | 51.868 | 5,70 | ||||
| 2026-02-12 | 13F | Haven Private, LLC | 38.389 | 8,75 | 754 | 12,22 | ||||
| 2026-02-13 | 13F | Victory Capital Management Inc | 31.243 | 613 | ||||||
| 2026-04-23 | 13F | North Star Investment Management Corp. | 71.325 | 0,00 | 928 | -33,79 | ||||
| 2026-04-20 | 13F | State of Alaska, Department of Revenue | 1.257 | 0,00 | 0 | |||||
| 2026-02-11 | 13F | Vestcor Inc | 0 | -100,00 | 0 | |||||
| 2026-01-06 | 13F | Sanctuary Advisors, LLC | 0 | -100,00 | 0 | |||||
| 2026-02-10 | 13F | Quantbot Technologies LP | 0 | -100,00 | 0 |
Other Listings
| DE:AWT | 10,50 € |