Grundlæggende statistik
| Institutionelle ejere | 126 total, 125 long only, 0 short only, 1 long/short - change of -4,51% MRQ |
| Gennemsnitlig porteføljeallokering | 0.1824 % - change of 15,33% MRQ |
| Institutionelle aktier (lange) | 27.601.565 (ex 13D/G) - change of -1,52MM shares -5,23% MRQ |
| Institutionel værdi (lang) | $ 594.753 USD ($1000) |
Institutionelt ejerskab og aktionærer
iShares S&P GSCI Commodity-Indexed Trust (US:GSG) har 126 institutionelle ejere og aktionærer, der har indsendt 13D/G- eller 13F-formularer til Securities Exchange Commission (SEC). Disse institutioner har i alt 27,601,565 aktier. Største aktionærer omfatter BlackRock, Inc., USA Financial Portformulas Corp, Morgan Stanley, Strategic Investment Management, Llc, Quent Capital, LLC, Bank Of America Corp /de/, Wells Fargo & Company/mn, Quadrature Capital Ltd, Deutsche Bank Ag\, and Goldman Sachs Group Inc .
iShares S&P GSCI Commodity-Indexed Trust (ARCA:GSG) institutionel ejerskabsstruktur viser aktuelle positioner i virksomheden efter institutioner og fonde, samt seneste ændringer i positionsstørrelse. Større aktionærer kan omfatte individuelle investorer, investeringsforeninger, hedgefonde eller institutioner. Skema 13D angiver, at investoren besidder (eller besidder) mere end 5 % af virksomheden og har til hensigt (eller har til hensigt at) aktivt at forfølge en ændring i forretningsstrategi. Skema 13G indikerer en passiv investering på over 5%.
The share price as of September 12, 2025 is 22,76 / share. Previously, on September 16, 2024, the share price was 20,60 / share. This represents an increase of 10,49% over that period.

Fondens stemningsscore
Fund Sentiment Score (fka Ownership Accumulation Score) finder de aktier, der bliver mest købt af fonde. Det er resultatet af en sofistikeret, multi-faktor kvantitativ model, der identificerer virksomheder med de højeste niveauer af institutionel akkumulering. Scoringsmodellen bruger en kombination af den samlede stigning i oplyste ejere, ændringerne i porteføljeallokeringer i disse ejere og andre målinger. Tallet går fra 0 til 100, hvor højere tal indikerer et højere niveau af akkumulering for sine jævnaldrende, og 50 er gennemsnittet.
Opdateringsfrekvens: Dagligt
Se Ownership Explorer, som giver en liste over højest rangerende virksomheder.
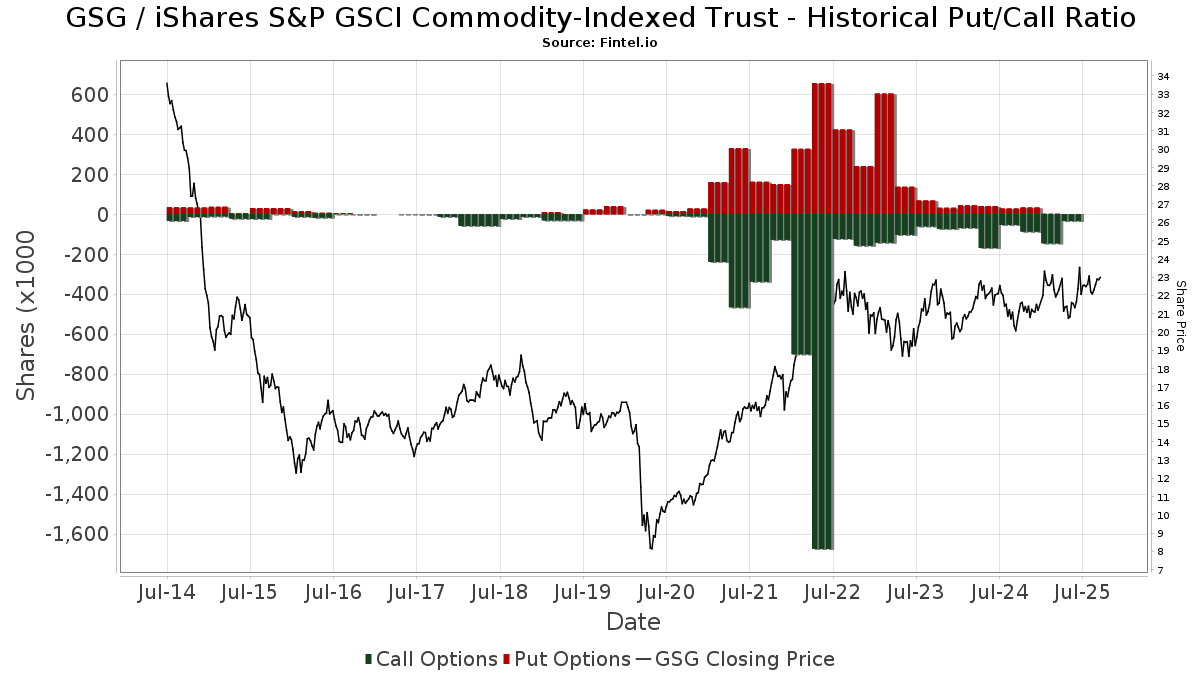
Institutionel Put/Call-forhold
Ud over at indberette standardaktie- og gældsudstedelser skal institutter med mere end 100 mill. aktiver under forvaltning også oplyse deres put- og call-optionsbeholdninger. Da salgsoptioner generelt indikerer negativ stemning, og købsoptioner indikerer positiv stemning, kan vi få en fornemmelse af den overordnede institutionelle stemning ved at plotte forholdet mellem put og kald. Diagrammet til højre viser det historiske put/call-forhold for dette instrument.
Brug af Put/Call Ratio som en indikator for investorernes stemning overvinder en af de vigtigste mangler ved at bruge totalt institutionelt ejerskab, som er, at en betydelig mængde af aktiver under forvaltning investeres passivt for at spore indekser. Passivt forvaltede fonde køber typisk ikke optioner, så indikatoren for put/call-forholdet følger mere nøje følelsen af aktivt forvaltede fonde.
13F og NPORT arkivering
Detaljer om 13F-arkivering er gratis. Detaljer om NP-ansøgninger kræver et premium-medlemskab. Grønne rækker angiver nye positioner. Røde rækker angiver lukkede positioner. Klik på linket ikon for at se den fulde transaktionshistorik.
Opgrader
for at låse premium-data op og eksportere til Excel ![]() .
.
| Fil dato | Kilde | Investor | Type | Gennemsnitlig pris (Øst) |
Aktier | Δ Aktier (%) |
Rapporteret Værdi ($1000) |
Δ Værdi (%) |
Port Alloc (%) |
|
|---|---|---|---|---|---|---|---|---|---|---|
| 2025-08-14 | 13F | Citadel Advisors Llc | Call | 19.400 | 2,11 | 428 | -1,16 | |||
| 2025-08-14 | 13F | Raymond James Financial Inc | 40.484 | -8,70 | 892 | -11,60 | ||||
| 2025-05-09 | 13F | Atria Wealth Solutions, Inc. | 0 | -100,00 | 0 | |||||
| 2025-05-15 | 13F | Rakuten Investment Management, Inc. | 107.840 | 8,24 | 2.415 | 15,06 | ||||
| 2025-07-15 | 13F | Cordant, Inc. | 3.058 | 0,00 | 67 | -2,90 | ||||
| 2025-08-08 | 13F | Capstone Financial Advisors, Inc. | 9.600 | 0,00 | 212 | -3,21 | ||||
| 2025-07-08 | 13F | Nbc Securities, Inc. | 2.172 | 0,56 | 0 | |||||
| 2025-08-13 | 13F | EverSource Wealth Advisors, LLC | 22 | 0,00 | 0 | |||||
| 2025-08-13 | 13F | Amundi | 0 | -100,00 | 0 | |||||
| 2025-08-12 | 13F | Southeast Asset Advisors Inc. | 18.514 | 31,65 | 408 | 27,50 | ||||
| 2025-08-19 | 13F | Advisory Services Network, LLC | 47.817 | -0,10 | 1.090 | 0,09 | ||||
| 2025-08-08 | 13F | Chandler Asset Management, Inc. | 23.595 | 0,00 | 520 | -3,17 | ||||
| 2025-08-13 | 13F | Avestar Capital, LLC | 25.250 | 0,00 | 557 | -3,14 | ||||
| 2025-07-18 | 13F | USA Financial Portformulas Corp | 1.009.519 | 22.250 | ||||||
| 2025-07-08 | 13F | Arlington Trust Co LLC | 6.250 | 0,00 | 138 | -3,52 | ||||
| 2025-07-31 | 13F | Optimum Investment Advisors | 50 | 0,00 | 1 | 0,00 | ||||
| 2025-08-13 | 13F | Scotia Capital Inc. | 17.076 | -74,37 | 376 | -75,21 | ||||
| 2025-08-04 | 13F | Assetmark, Inc | 0 | -100,00 | 0 | |||||
| 2025-08-12 | 13F | Steward Partners Investment Advisory, Llc | 664 | 0,00 | 15 | -6,67 | ||||
| 2025-08-01 | 13F | First National Trust Co | 15.476 | 3,17 | 341 | 0,00 | ||||
| 2025-08-14 | 13F | Citadel Advisors Llc | 45.188 | 996 | ||||||
| 2025-05-05 | 13F | St. Louis Trust Co | 0 | -100,00 | 0 | |||||
| 2025-07-30 | 13F | Strategic Investment Management, Llc | 873.720 | 0,00 | 19.257 | -3,21 | ||||
| 2025-08-14 | 13F | Bnp Paribas Arbitrage, Sa | 34.330 | 30.551,79 | 757 | 37.700,00 | ||||
| 2025-08-13 | 13F | Continuum Advisory, LLC | 0 | -100,00 | 0 | |||||
| 2025-05-16 | 13F | Coppell Advisory Solutions LLC | 0 | -100,00 | 0 | |||||
| 2025-08-06 | 13F | Aspect Partners, LLC | 23.795 | 524 | ||||||
| 2025-08-04 | 13F | Creative Financial Designs Inc /adv | 700 | 0,00 | 15 | 0,00 | ||||
| 2025-08-13 | 13F | Flow Traders U.s. Llc | 0 | -100,00 | 0 | |||||
| 2025-04-10 | 13F | Sugar Maple Asset Management, LLC | 0 | -100,00 | 0 | |||||
| 2025-08-13 | 13F | Northwestern Mutual Wealth Management Co | 37.271 | -0,60 | 821 | -3,75 | ||||
| 2025-08-05 | 13F | Simplex Trading, Llc | Put | 100 | 0 | |||||
| 2025-05-14 | 13F | Group One Trading, L.p. | Put | 0 | -100,00 | 0 | -100,00 | |||
| 2025-08-05 | 13F | Simplex Trading, Llc | Call | 1.000 | 25,00 | 0 | ||||
| 2025-08-08 | 13F | Avantax Advisory Services, Inc. | 22.695 | 8,37 | 500 | 5,04 | ||||
| 2025-08-12 | 13F | Coldstream Capital Management Inc | 0 | -100,00 | 0 | |||||
| 2025-04-22 | 13F | Heartland Bank & Trust Co | 0 | -100,00 | 0 | |||||
| 2025-08-04 | 13F | Pinnacle Associates Ltd | 55.301 | 0,00 | 1.219 | -3,26 | ||||
| 2025-04-18 | 13F | Global Trust Asset Management, LLC | 0 | -100,00 | 0 | |||||
| 2025-08-13 | 13F/A | StoneX Group Inc. | 28.715 | 0,40 | 610 | 3,57 | ||||
| 2025-04-21 | 13F | Beacon Capital Management, LLC | 0 | -100,00 | 0 | |||||
| 2025-08-13 | 13F | Congress Wealth Management LLC / DE / | 17.930 | 0,00 | 395 | -3,19 | ||||
| 2025-07-17 | 13F | Fifth Third Securities, Inc. | 10.783 | 19,56 | 238 | 15,61 | ||||
| 2025-08-14 | 13F | Citadel Advisors Llc | Put | 0 | -100,00 | 0 | ||||
| 2025-08-15 | 13F | Equitable Holdings, Inc. | 12.932 | 285 | ||||||
| 2025-07-28 | 13F | Private Wealth Asset Management, LLC | 5.000 | 0,00 | 110 | -2,65 | ||||
| 2025-08-12 | 13F | Proequities, Inc. | Put | 0 | 0 | |||||
| 2025-05-12 | 13F | Citigroup Inc | 0 | -100,00 | 0 | |||||
| 2025-08-12 | 13F | Proequities, Inc. | Call | 0 | 0 | |||||
| 2025-05-14 | 13F | Oarsman Capital, Inc. | 0 | -100,00 | 0 | -100,00 | ||||
| 2025-08-11 | 13F | GW&K Investment Management, LLC | 14.000 | 0,00 | 0 | |||||
| 2025-08-05 | 13F | Bank of New York Mellon Corp | 141.256 | -27,47 | 3.113 | -29,79 | ||||
| 2025-05-12 | 13F | Sandy Spring Bank | 17 | 0,00 | 0 | |||||
| 2025-07-08 | 13F | Rise Advisors, LLC | 300 | 0,00 | 7 | 0,00 | ||||
| 2025-07-08 | 13F | Parallel Advisors, LLC | 9.630 | 0,00 | 212 | -3,20 | ||||
| 2025-07-23 | 13F | West Paces Advisors Inc. | 0 | -100,00 | 0 | |||||
| 2025-08-13 | 13F | Transce3nd, LLC | 42 | 366,67 | 1 | |||||
| 2025-08-13 | 13F | Bank Of Nova Scotia | 14.240 | 0,00 | 314 | -3,40 | ||||
| 2025-08-14 | 13F | State Street Corp | 66.900 | -48,38 | 1.474 | -50,03 | ||||
| 2025-08-06 | 13F | Golden State Wealth Management, LLC | 3.409 | -20,33 | 75 | -22,68 | ||||
| 2025-08-12 | 13F | Boreal Capital Management LLC | 670 | 15 | ||||||
| 2025-08-07 | 13F | Pinnacle Wealth Management Advisory Group, LLC | 55.000 | 0,00 | 1.212 | -3,19 | ||||
| 2025-08-14 | 13F | Susquehanna International Group, Llp | Call | 12.600 | 278 | |||||
| 2025-08-14 | 13F | Susquehanna International Group, Llp | 44.549 | -51,92 | 982 | -53,49 | ||||
| 2025-08-05 | 13F | Simplex Trading, Llc | 0 | -100,00 | 0 | |||||
| 2025-08-11 | 13F | TD Waterhouse Canada Inc. | 550 | 0,00 | 12 | 0,00 | ||||
| 2025-07-21 | 13F | Quent Capital, LLC | 676.447 | 22,06 | 14.909 | 18,15 | ||||
| 2025-07-31 | 13F | Cambridge Investment Research Advisors, Inc. | 12.422 | -18,89 | 0 | |||||
| 2025-08-13 | 13F | MONECO Advisors, LLC | 95.648 | 0,22 | 2.108 | -2,99 | ||||
| 2025-05-01 | 13F | Cwm, Llc | 0 | -100,00 | 0 | |||||
| 2025-05-15 | 13F | Human Investing LLC | 0 | -100,00 | 0 | |||||
| 2025-08-06 | 13F | Prospera Financial Services Inc | 64.531 | -0,74 | 1.422 | -3,92 | ||||
| 2025-08-14 | 13F | Royal Bank Of Canada | 51.892 | -5,56 | 1.144 | -8,48 | ||||
| 2025-08-01 | 13F | Envestnet Asset Management Inc | 75.091 | -23,69 | 1.655 | -26,12 | ||||
| 2025-07-16 | 13F | Castleview Partners, Llc | 0 | -100,00 | 0 | |||||
| 2025-08-13 | 13F | Quadrature Capital Ltd | 360.943 | 422,05 | 7.961 | 405,72 | ||||
| 2025-08-12 | 13F | Inscription Capital, LLC | 199.182 | -17,78 | 4.390 | -17,87 | ||||
| 2025-08-14 | 13F | Mariner, LLC | 33.064 | -29,12 | 729 | -31,45 | ||||
| 2025-07-16 | 13F | Highline Wealth Partners Llc | 1.700 | 0,00 | 37 | -2,63 | ||||
| 2025-08-11 | 13F | Strategic Wealth Partners, Ltd. | 800 | 18 | ||||||
| 2025-07-29 | 13F | Empirical Asset Management, LLC | 114.908 | 4,10 | 2.533 | 0,76 | ||||
| 2025-08-14 | 13F | GWM Advisors LLC | 619 | 0,00 | 14 | -7,14 | ||||
| 2025-08-12 | 13F | OneAscent Financial Services LLC | 44.778 | -26,93 | 1 | -100,00 | ||||
| 2025-08-06 | 13F | Moors & Cabot, Inc. | 36.972 | -3,23 | 815 | -6,33 | ||||
| 2025-08-11 | 13F | Sierra Capital LLC | 18.098 | -16,40 | 0 | |||||
| 2025-08-13 | 13F | Generation Capital Management LLC | 0 | -100,00 | 0 | |||||
| 2025-08-05 | 13F | Sumitomo Life Insurance Co | 0 | -100,00 | 0 | |||||
| 2025-08-15 | 13F | Morgan Stanley | 917.140 | -0,70 | 20.214 | -3,88 | ||||
| 2025-07-21 | 13F | Barrett & Company, Inc. | 150 | 0,00 | 3 | 0,00 | ||||
| 2025-05-14 | 13F | Mml Investors Services, Llc | 0 | -100,00 | 0 | |||||
| 2025-07-09 | 13F | Intelligence Driven Advisers, LLC | 0 | -100,00 | 0 | |||||
| 2025-07-22 | 13F | DT Investment Partners, LLC | 172.885 | 4,98 | 3.810 | 1,63 | ||||
| 2025-05-05 | 13F | CBIZ Investment Advisory Services, LLC | 0 | -100,00 | 0 | |||||
| 2025-08-14 | 13F | Goldman Sachs Group Inc | 208.970 | -22,77 | 4.606 | -25,26 | ||||
| 2025-07-21 | 13F | Washington Growth Strategies Llc | 135.919 | 590.852,17 | 3 | -33,33 | ||||
| 2025-08-14 | 13F | Gould Capital, LLC | 1.771 | -1,94 | 39 | -4,88 | ||||
| 2025-08-14 | 13F | Bank Of America Corp /de/ | 456.125 | -14,41 | 10.053 | -17,16 | ||||
| 2025-08-08 | 13F | Red Cedar Investment Management, Llc | 184.379 | 0,00 | 4.064 | -3,22 | ||||
| 2025-07-24 | 13F | Us Bancorp \de\ | 42.817 | -38,81 | 944 | -40,80 | ||||
| 2025-08-07 | 13F | Davis R M Inc | 9.150 | 0,00 | 202 | -3,37 | ||||
| 2025-08-13 | 13F | Mackenzie Financial Corp | 12.221 | -1,24 | 269 | -4,27 | ||||
| 2025-07-09 | 13F | Krilogy Financial LLC | 10.210 | -25,58 | 225 | -27,88 | ||||
| 2025-05-09 | 13F | Strategic Investment Solutions, Inc. /IL | 0 | -100,00 | 0 | |||||
| 2025-07-18 | 13F | PFG Investments, LLC | 53.112 | 0,93 | 1.171 | -2,34 | ||||
| 2025-07-31 | 13F | Oppenheimer & Co Inc | 25.400 | 0,00 | 560 | -3,29 | ||||
| 2025-08-05 | 13F | Aurdan Capital Management, LLC | 10.550 | 0,00 | 233 | -3,33 | ||||
| 2025-07-14 | 13F | Westend Capital Management LLC | 30 | 0,00 | 1 | |||||
| 2025-07-14 | 13F | Wealth Advisory Solutions, LLC | 29.970 | 1,23 | 661 | -2,08 | ||||
| 2025-08-04 | 13F | Creekmur Asset Management LLC | 180 | 80,00 | 4 | 50,00 | ||||
| 2025-08-14 | 13F | Wells Fargo & Company/mn | 362.009 | -34,43 | 7.979 | -36,54 | ||||
| 2025-08-08 | 13F | Financial Gravity Companies, Inc. | 82 | 0,00 | 2 | 0,00 | ||||
| 2025-08-12 | 13F | Proequities, Inc. | 0 | 0 | ||||||
| 2025-07-10 | 13F | Sovran Advisors, LLC | 136.380 | -3,27 | 3.075 | 1,05 | ||||
| 2025-07-24 | 13F | Strengthening Families & Communities, LLC | 1.174 | 26 | ||||||
| 2025-04-22 | 13F | Synergy Financial Management, LLC | 0 | -100,00 | 0 | |||||
| 2025-08-08 | 13F | Cetera Investment Advisers | 10.483 | -11,29 | 231 | -14,13 | ||||
| 2025-07-16 | 13F | Perigon Wealth Management, LLC | 16.586 | 0,00 | 366 | -3,18 | ||||
| 2025-08-14 | 13F | Sunbelt Securities, Inc. | 2.331 | 0,00 | 51 | -5,66 | ||||
| 2025-08-14 | 13F | Headlands Technologies LLC | 1.571 | 35 | ||||||
| 2025-09-04 | 13F/A | Advisor Group Holdings, Inc. | 56.763 | 56,57 | 1.252 | 51,64 | ||||
| 2025-08-11 | 13F | HighTower Advisors, LLC | 38.901 | -21,64 | 857 | -24,16 | ||||
| 2025-08-12 | 13F | LPL Financial LLC | 85.965 | -2,65 | 1.895 | -5,77 | ||||
| 2025-08-12 | 13F | BlackRock, Inc. | 18.508.255 | 6,56 | 407.922 | 3,15 | ||||
| 2025-08-05 | 13F | Huntington National Bank | 38 | -15,91 | ||||||
| 2025-08-14 | 13F | Stifel Financial Corp | 60.801 | 99,91 | 1.340 | 93,64 | ||||
| 2025-08-04 | 13F | Atria Investments Llc | 0 | -100,00 | 0 | |||||
| 2025-08-13 | 13F | Natixis Advisors, L.p. | 198.992 | -6,75 | 4 | 0,00 | ||||
| 2025-08-13 | 13F | F/M Investments LLC | 26.166 | 0,00 | 577 | -3,19 | ||||
| 2025-07-16 | 13F | Signaturefd, Llc | 0 | -100,00 | 0 | |||||
| 2025-07-18 | 13F | SOA Wealth Advisors, LLC. | 40 | 0,00 | 1 | |||||
| 2025-07-15 | 13F | Evanson Asset Management, LLC | 47.347 | 0,00 | 1.044 | -3,25 | ||||
| 2025-08-12 | 13F | Jpmorgan Chase & Co | 28.381 | -95,45 | 626 | -95,60 | ||||
| 2025-07-16 | 13F | BOS Asset Management, LLC | 11.330 | 0,00 | 250 | -3,11 | ||||
| 2025-08-12 | 13F | Deutsche Bank Ag\ | 311.479 | -60,97 | 6.865 | -62,23 | ||||
| 2025-08-14 | 13F | Stonehaven Wealth & Tax Solutions, Llc | 19.402 | -0,97 | 428 | -4,26 | ||||
| 2025-07-25 | 13F | Envestnet Portfolio Solutions, Inc. | 16.303 | 34,45 | 359 | 30,07 | ||||
| 2025-05-01 | 13F | Schechter Investment Advisors, LLC | 144.259 | -0,35 | 3.285 | 4,22 | ||||
| 2025-08-07 | 13F | Allworth Financial LP | 1.753 | 0,00 | 39 | 2,70 | ||||
| 2025-08-14 | 13F | UBS Group AG | 57.238 | -14,57 | 1.262 | -17,31 | ||||
| 2025-08-05 | 13F | Bank Of Montreal /can/ | 0 | -100,00 | 0 | |||||
| 2025-07-31 | 13F | Mycio Wealth Partners, Llc | 0 | -100,00 | 0 | |||||
| 2025-08-12 | 13F | CIBC Private Wealth Group, LLC | 1.500 | 0,00 | 33 | 10,00 | ||||
| 2025-08-14 | 13F | Fmr Llc | 0 | -100,00 | 0 | |||||
| 2025-08-14 | 13F | CoreCap Advisors, LLC | 394 | 0,00 | 9 | 0,00 | ||||
| 2025-07-09 | 13F | Breakwater Investment Management | 8.493 | -57,29 | 187 | -58,63 | ||||
| 2025-08-14 | 13F | SIH Partners, LLLP | Call | 0 | -100,00 | 0 | ||||
| 2025-05-15 | 13F | Wolverine Trading, Llc | Put | 0 | -100,00 | 0 | ||||
| 2025-08-25 | 13F/A | Neuberger Berman Group LLC | 41.262 | -14,86 | 909 | -17,59 | ||||
| 2025-08-14 | 13F | Jane Street Group, Llc | 35.491 | -86,31 | 782 | -86,75 | ||||
| 2025-08-05 | 13F | Key FInancial Inc | 158 | 0,00 | 3 | 0,00 | ||||
| 2025-08-12 | 13F | AlphaCore Capital LLC | 11.348 | 0,00 | 250 | -3,10 | ||||
| 2025-07-17 | 13F | Sound Income Strategies, LLC | 1.852 | 41 | ||||||
| 2025-08-19 | 13F | Asset Dedication, LLC | 1.125 | 0,00 | 25 | -4,00 | ||||
| 2025-05-15 | 13F | Wolverine Trading, Llc | Call | 0 | -100,00 | 0 | ||||
| 2025-08-14 | 13F | Comerica Bank | 6.383 | 0,00 | 141 | -3,45 | ||||
| 2025-08-01 | 13F | Red Lighthouse Investment Management, Llc | 650 | 0,00 | 14 | 0,00 | ||||
| 2025-08-11 | 13F | Brown Brothers Harriman & Co | 0 | -100,00 | 0 | |||||
| 2025-08-13 | 13F | M Holdings Securities, Inc. | 132.290 | 47,40 | 3 | 0,00 | ||||
| 2025-07-25 | 13F | Stephens Consulting, LLC | 580 | 0,00 | 13 | -7,69 | ||||
| 2025-08-07 | 13F | Kestra Private Wealth Services, Llc | 12.090 | 266 | ||||||
| 2025-07-16 | 13F | Patton Fund Management, Inc. | 69.454 | -1,81 | 1.531 | -4,97 | ||||
| 2025-08-15 | 13F | CI Private Wealth, LLC | 14.634 | 7,44 | 323 | 3,87 | ||||
| 2025-08-14 | 13F | Ameriprise Financial Inc | 98.599 | -42,78 | 2.173 | -44,62 | ||||
| 2025-08-18 | 13F/A | National Bank Of Canada /fi/ | 47.948 | -35,22 | 1.057 | -37,25 | ||||
| 2025-07-28 | 13F | Harbour Investments, Inc. | 369 | 0,00 | 8 | 0,00 | ||||
| 2025-08-06 | 13F | Commonwealth Equity Services, Llc | 65.954 | 70,26 | 1 | |||||
| 2025-04-30 | 13F | Sofos Investments, Inc. | 82 | 2 | ||||||
| 2025-08-15 | 13F | Tower Research Capital LLC (TRC) | 364 | 8 | ||||||
| 2025-08-08 | 13F | Pnc Financial Services Group, Inc. | 2.170 | 0,00 | 48 | -4,08 | ||||
| 2025-05-15 | 13F | First Commonwealth Financial Corp /pa/ | 0 | -100,00 | 0 | |||||
| 2025-08-14 | 13F | Group One Trading, L.p. | Call | 1.100 | 0,00 | 24 | -4,00 |