Grundlæggende statistik
| Institutionelle ejere | 89 total, 89 long only, 0 short only, 0 long/short - change of 0,00% MRQ |
| Gennemsnitlig porteføljeallokering | 0.3480 % - change of 61,02% MRQ |
| Institutionelle aktier (lange) | 2.345.608 (ex 13D/G) - change of -0,15MM shares -6,06% MRQ |
| Institutionel værdi (lang) | $ 245.242 USD ($1000) |
Institutionelt ejerskab og aktionærer
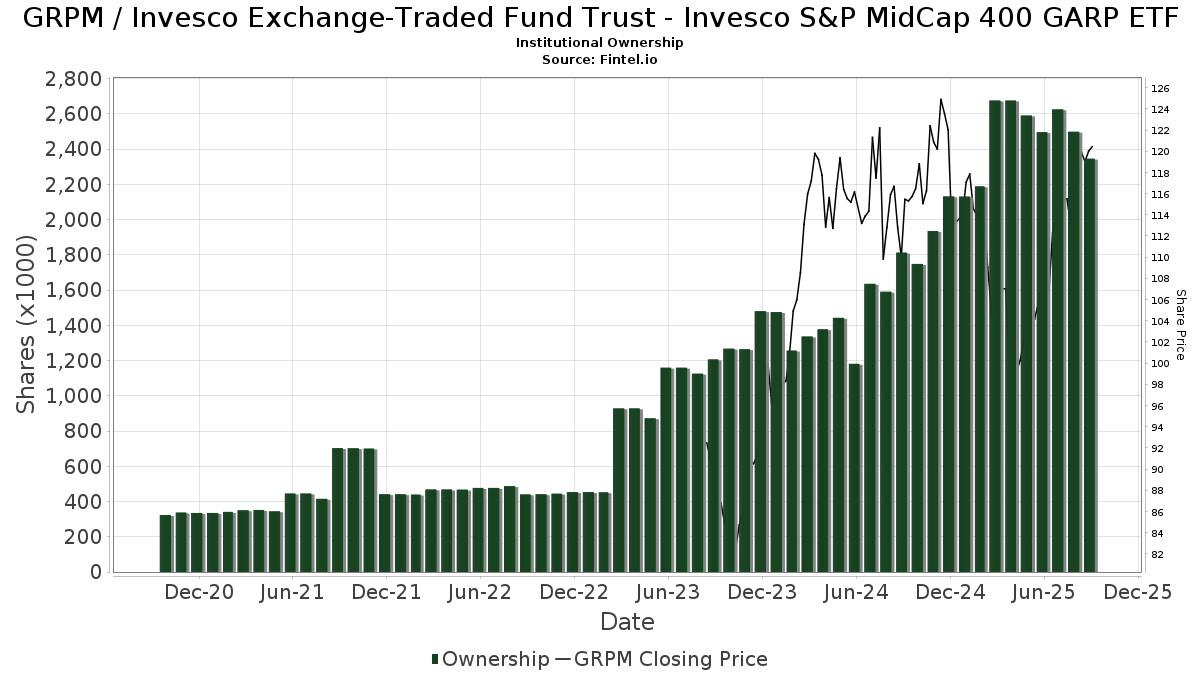
Invesco Exchange-Traded Fund Trust - Invesco S&P MidCap 400 GARP ETF (US:GRPM) har 89 institutionelle ejere og aktionærer, der har indsendt 13D/G- eller 13F-formularer til Securities Exchange Commission (SEC). Disse institutioner har i alt 2,345,608 aktier. Største aktionærer omfatter Morgan Stanley, LPL Financial LLC, Fortitude Financial, LLC, Northwestern Mutual Wealth Management Co, Bank Of America Corp /de/, Advisor Group Holdings, Inc., 626 Financial, LLC, Private Advisor Group, LLC, Jones Financial Companies Lllp, and WealthCare Investment Partners, LLC .
Invesco Exchange-Traded Fund Trust - Invesco S&P MidCap 400 GARP ETF (ARCA:GRPM) institutionel ejerskabsstruktur viser aktuelle positioner i virksomheden efter institutioner og fonde, samt seneste ændringer i positionsstørrelse. Større aktionærer kan omfatte individuelle investorer, investeringsforeninger, hedgefonde eller institutioner. Skema 13D angiver, at investoren besidder (eller besidder) mere end 5 % af virksomheden og har til hensigt (eller har til hensigt at) aktivt at forfølge en ændring i forretningsstrategi. Skema 13G indikerer en passiv investering på over 5%.
The share price as of September 9, 2025 is 119,58 / share. Previously, on September 10, 2024, the share price was 109,46 / share. This represents an increase of 9,25% over that period.
Fondens stemningsscore
Fund Sentiment Score (fka Ownership Accumulation Score) finder de aktier, der bliver mest købt af fonde. Det er resultatet af en sofistikeret, multi-faktor kvantitativ model, der identificerer virksomheder med de højeste niveauer af institutionel akkumulering. Scoringsmodellen bruger en kombination af den samlede stigning i oplyste ejere, ændringerne i porteføljeallokeringer i disse ejere og andre målinger. Tallet går fra 0 til 100, hvor højere tal indikerer et højere niveau af akkumulering for sine jævnaldrende, og 50 er gennemsnittet.
Opdateringsfrekvens: Dagligt
Se Ownership Explorer, som giver en liste over højest rangerende virksomheder.
Institutionel Put/Call-forhold
Ud over at indberette standardaktie- og gældsudstedelser skal institutter med mere end 100 mill. aktiver under forvaltning også oplyse deres put- og call-optionsbeholdninger. Da salgsoptioner generelt indikerer negativ stemning, og købsoptioner indikerer positiv stemning, kan vi få en fornemmelse af den overordnede institutionelle stemning ved at plotte forholdet mellem put og kald. Diagrammet til højre viser det historiske put/call-forhold for dette instrument.
Brug af Put/Call Ratio som en indikator for investorernes stemning overvinder en af de vigtigste mangler ved at bruge totalt institutionelt ejerskab, som er, at en betydelig mængde af aktiver under forvaltning investeres passivt for at spore indekser. Passivt forvaltede fonde køber typisk ikke optioner, så indikatoren for put/call-forholdet følger mere nøje følelsen af aktivt forvaltede fonde.
13F og NPORT arkivering
Detaljer om 13F-arkivering er gratis. Detaljer om NP-ansøgninger kræver et premium-medlemskab. Grønne rækker angiver nye positioner. Røde rækker angiver lukkede positioner. Klik på linket ikon for at se den fulde transaktionshistorik.
Opgrader
for at låse premium-data op og eksportere til Excel ![]() .
.
| Fil dato | Kilde | Investor | Type | Gennemsnitlig pris (Øst) |
Aktier | Δ Aktier (%) |
Rapporteret Værdi ($1000) |
Δ Værdi (%) |
Port Alloc (%) |
|
|---|---|---|---|---|---|---|---|---|---|---|
| 2025-07-21 | 13F | Seros Financial, LLC | 8.336 | 2,36 | 911 | 6,92 | ||||
| 2025-08-08 | 13F | Larson Financial Group LLC | 792 | 87 | ||||||
| 2025-08-14 | 13F | GWM Advisors LLC | 2.758 | 925,28 | 301 | 975,00 | ||||
| 2025-07-31 | 13F | Glass Jacobson Investment Advisors llc | 605 | -9,70 | 66 | -12,00 | ||||
| 2025-08-08 | 13F | Gts Securities Llc | 27.099 | 55,74 | 2.962 | 62,60 | ||||
| 2025-08-08 | 13F | Capital Investment Advisory Services, LLC | 325 | -52,76 | 36 | -51,39 | ||||
| 2025-08-13 | 13F | Crescent Grove Advisors, LLC | 2.300 | 0,00 | 251 | 4,58 | ||||
| 2025-08-04 | 13F | Spire Wealth Management | 0 | -100,00 | 0 | |||||
| 2025-06-30 | NP | Northern Lights Fund Trust - PFG Invesco(R) Thematic ESG Strategy Class R Shares | 26.272 | 5,48 | 2.634 | -7,35 | ||||
| 2025-04-22 | 13F | Crews Bank & Trust | 0 | -100,00 | 0 | |||||
| 2025-08-12 | 13F | PSI Advisors, LLC | 0 | -100,00 | 0 | |||||
| 2025-07-10 | 13F | Exchange Traded Concepts, Llc | 108 | 12 | ||||||
| 2025-08-11 | 13F | Private Advisor Group, LLC | 70.828 | 99,99 | 7.741 | 108,74 | ||||
| 2025-07-24 | 13F | IFP Advisors, Inc | 20 | -94,74 | 2 | -94,87 | ||||
| 2025-05-02 | 13F | Prevail Innovative Wealth Advisors, Llc | 0 | -100,00 | 0 | |||||
| 2025-08-15 | 13F | Kestra Advisory Services, LLC | 5.363 | 5,26 | 586 | 9,94 | ||||
| 2025-08-12 | 13F | LPL Financial LLC | 160.429 | -8,81 | 17.533 | -4,81 | ||||
| 2025-08-14 | 13F | Integrated Wealth Concepts LLC | 18.656 | 2.039 | ||||||
| 2025-08-14 | 13F | Goldman Sachs Group Inc | 28.643 | 80,11 | 3.130 | 87,99 | ||||
| 2025-08-14 | 13F | Wells Fargo & Company/mn | 337 | -18,60 | 37 | -16,28 | ||||
| 2025-08-14 | 13F | EP Wealth Advisors, Inc. | 1.835 | 201 | ||||||
| 2025-05-13 | 13F/A | Heck Capital Advisors, LLC | 0 | -100,00 | 0 | -100,00 | ||||
| 2025-08-14 | 13F | Modern Wealth Management, LLC | 31.864 | 18,88 | 3.482 | 24,09 | ||||
| 2025-08-04 | 13F | Quaker Wealth Management, LLC | 140 | 15 | ||||||
| 2025-08-14 | 13F | Royal Bank Of Canada | 11.268 | -70,10 | 1.231 | -68,80 | ||||
| 2025-08-19 | 13F | Cape Investment Advisory, Inc. | 66 | 7 | ||||||
| 2025-07-25 | 13F | Cwm, Llc | 107 | 0,00 | 0 | |||||
| 2025-05-09 | 13F | North Ridge Wealth Advisors, Inc. | 0 | -100,00 | 0 | |||||
| 2025-08-06 | 13F | Commonwealth Equity Services, Llc | 20.320 | 3,92 | 2 | 0,00 | ||||
| 2025-08-13 | 13F | Victory Financial Group, Llc | 0 | -100,00 | 0 | |||||
| 2025-08-14 | 13F | Mariner, LLC | 4.278 | -1,20 | 468 | 3,09 | ||||
| 2025-08-12 | 13F | Ameritas Investment Partners, Inc. | 46.861 | 11,00 | 5.121 | 15,86 | ||||
| 2025-04-21 | 13F | Compass Capital Corp /ma/ /adv | 0 | -100,00 | 0 | |||||
| 2025-08-13 | 13F | Stenger Family Office, LLC | 38.498 | 5.348 | ||||||
| 2025-08-04 | 13F | Creative Financial Designs Inc /adv | 3.254 | 23,35 | 356 | 28,62 | ||||
| 2025-07-09 | 13F | WealthCare Investment Partners, LLC | 56.551 | -0,16 | 6.403 | 18,27 | ||||
| 2025-08-14 | 13F | Jane Street Group, Llc | 3.822 | -15,48 | 418 | -11,84 | ||||
| 2025-07-22 | 13F | Merit Financial Group, LLC | 17.723 | -73,08 | 1.937 | -71,91 | ||||
| 2025-07-21 | 13F | Ameritas Advisory Services, LLC | 344 | 38 | ||||||
| 2025-08-14 | 13F | Bank Of America Corp /de/ | 122.739 | -27,80 | 13.414 | -24,63 | ||||
| 2025-07-08 | 13F | Davis Investment Partners, LLC | 14.825 | -0,84 | 1.642 | 13,02 | ||||
| 2025-07-10 | 13F | Redhawk Wealth Advisors, Inc. | 4.011 | -37,08 | 438 | -34,33 | ||||
| 2025-08-14 | 13F | Susquehanna International Group, Llp | 8.405 | 13,64 | 919 | 18,60 | ||||
| 2025-08-13 | 13F | Northwestern Mutual Wealth Management Co | 129.346 | -30,97 | 14.136 | -27,94 | ||||
| 2025-07-31 | 13F | Cambridge Investment Research Advisors, Inc. | 41.225 | 91,79 | 5 | 100,00 | ||||
| 2025-08-12 | 13F | Proequities, Inc. | 0 | 0 | ||||||
| 2025-08-06 | 13F | AE Wealth Management LLC | 186 | -65,30 | 20 | -64,29 | ||||
| 2025-04-23 | 13F | Embree Financial Group | 0 | -100,00 | 0 | |||||
| 2025-08-13 | 13F | Cerity Partners LLC | 29.029 | -2,41 | 3.173 | 1,86 | ||||
| 2025-08-13 | 13F | Balance Wealth, LLC | 0 | -100,00 | 0 | |||||
| 2025-05-08 | 13F | Endeavor Private Wealth, Inc. | 0 | -100,00 | 0 | |||||
| 2025-08-11 | 13F | Principal Securities, Inc. | 789 | 995,83 | 86 | 975,00 | ||||
| 2025-07-25 | 13F | Courage Miller Partners, LLC | 1.983 | 0,00 | 217 | 4,35 | ||||
| 2025-08-08 | 13F | Cetera Investment Advisers | 56.033 | -44,76 | 6.124 | -42,34 | ||||
| 2025-08-15 | 13F | Morgan Stanley | 430.893 | -23,70 | 47.092 | -20,35 | ||||
| 2025-07-15 | 13F | Main Street Group, LTD | 1.860 | 70,02 | 203 | 78,07 | ||||
| 2025-09-04 | 13F/A | Advisor Group Holdings, Inc. | 112.369 | 76,79 | 12.294 | 84,76 | ||||
| 2025-08-08 | 13F | Creative Planning | 53.754 | -11,67 | 5.875 | -7,80 | ||||
| 2025-04-22 | 13F | Nilsine Partners, LLC | 0 | -100,00 | 0 | |||||
| 2025-08-05 | 13F | Bank Of Montreal /can/ | 3.729 | 0,49 | 408 | 4,90 | ||||
| 2025-08-01 | 13F | Envestnet Asset Management Inc | 31.081 | 0,28 | 3.397 | 4,65 | ||||
| 2025-08-04 | 13F | Integrity Alliance, Llc. | 0 | -100,00 | 0 | |||||
| 2025-08-14 | 13F | Fmr Llc | 469 | -36,62 | 51 | -33,77 | ||||
| 2025-08-14 | 13F | Raymond James Financial Inc | 39.050 | -4,76 | 4.268 | -0,58 | ||||
| 2025-08-05 | 13F | Arrowroot Family Office, LLC | 9.720 | -6,51 | 1.062 | -9,39 | ||||
| 2025-08-05 | 13F | Sigma Planning Corp | 19.252 | -3,62 | 2.104 | 0,62 | ||||
| 2025-07-29 | 13F | Private Trust Co Na | 150 | 16 | ||||||
| 2025-08-04 | 13F | Quaker Wealth Management, LLC | Put | 0 | -100,00 | 0 | -100,00 | |||
| 2025-08-07 | 13F | BOK Financial Private Wealth, Inc. | 146 | 0,00 | 16 | 0,00 | ||||
| 2025-08-04 | 13F/A | 626 Financial, LLC | 98.918 | -4,00 | 10.811 | 0,20 | ||||
| 2025-07-17 | 13F | Wagner Wealth Management, Llc | 0 | -100,00 | 0 | |||||
| 2025-08-07 | 13F | PFG Advisors | 4.686 | 3,38 | 512 | 8,02 | ||||
| 2025-08-15 | 13F | Asset Allocation Strategies LLC | 11.783 | 1.288 | ||||||
| 2025-07-24 | 13F | Us Bancorp \de\ | 749 | 0,00 | 82 | 3,85 | ||||
| 2025-07-24 | 13F | Tandem Capital Management Corp /adv | 4.755 | -1,76 | 520 | 2,57 | ||||
| 2025-04-28 | 13F | Financial Advocates Investment Management | 0 | -100,00 | 0 | |||||
| 2025-05-06 | 13F | SYM FINANCIAL Corp | 0 | -100,00 | 0 | |||||
| 2025-06-11 | 13F | Fortitude Financial, LLC | 143.018 | 825,14 | 14.974 | 759,04 | ||||
| 2025-08-12 | 13F | Cornerstone Wealth Management, LLC | 7.448 | -9,50 | 814 | -5,46 | ||||
| 2025-08-14 | 13F | UBS Group AG | 37.040 | 8,99 | 4.048 | 13,77 | ||||
| 2025-07-31 | 13F | Oppenheimer & Co Inc | 8.428 | 0,00 | 921 | 4,42 | ||||
| 2025-07-25 | 13F | Concurrent Investment Advisors, LLC | 16.622 | 1,32 | 1.817 | 5,77 | ||||
| 2025-07-28 | 13F | Sagespring Wealth Partners, Llc | 15.365 | 139,52 | 1.679 | 150,22 | ||||
| 2025-08-13 | 13F | Jones Financial Companies Lllp | 65.982 | 3,40 | 7.200 | 7,93 | ||||
| 2025-04-11 | 13F | Harbor Group, Inc. | 0 | -100,00 | 0 | |||||
| 2025-08-12 | 13F | Steward Partners Investment Advisory, Llc | 1.473 | 161 | ||||||
| 2025-08-06 | 13F | North Capital, Inc. | 24 | 0,00 | 3 | 0,00 | ||||
| 2025-08-08 | 13F | Avantax Advisory Services, Inc. | 11.171 | -1,00 | 1.221 | 3,30 | ||||
| 2025-08-04 | 13F | Bay Colony Advisory Group, Inc d/b/a Bay Colony Advisors | 2.646 | -11,80 | 289 | -7,67 | ||||
| 2025-08-26 | 13F/A | Thrivent Financial For Lutherans | 0 | -100,00 | 0 | |||||
| 2025-08-14 | 13F | Two Sigma Securities, Llc | 2.120 | -28,16 | 232 | -25,00 | ||||
| 2025-08-14 | 13F | Stifel Financial Corp | 38.898 | -51,61 | 4.255 | -49,48 | ||||
| 2025-07-28 | 13F | Axxcess Wealth Management, Llc | 7.475 | -6,76 | 817 | -2,74 | ||||
| 2025-08-14 | 13F | Citadel Advisors Llc | 13.436 | 47,42 | 1.468 | 53,88 | ||||
| 2025-05-05 | 13F | Mainstay Capital Management Llc /adv | 0 | -100,00 | 0 | |||||
| 2025-07-29 | 13F | Signature Estate & Investment Advisors Llc | 2.493 | -2,43 | 272 | 1,87 | ||||
| 2025-08-07 | 13F | Kestra Private Wealth Services, Llc | 47.392 | 5,24 | 5.179 | 9,86 | ||||
| 2025-08-12 | 13F | Gladstone Institutional Advisory LLC | 2.445 | 0,00 | 267 | 4,71 | ||||
| 2025-07-28 | 13F | Harbour Investments, Inc. | 143 | -83,04 | 16 | -82,95 | ||||
| 2025-08-13 | 13F | Flow Traders U.s. Llc | 5.832 | 155,68 | 1 | |||||
| 2025-07-24 | 13F | Capital Advisors, Ltd. LLC | 2.186 | 0,23 | 0 | |||||
| 2025-08-14 | 13F | Ameriprise Financial Inc | 31.442 | -3,10 | 3.436 | 0,61 | ||||
| 2025-05-12 | 13F | Townsquare Capital Llc | 0 | -100,00 | 0 | |||||
| 2025-08-08 | 13F | Thoroughbred Financial Services, Llc | 27.841 | -33,40 | 3 | -25,00 | ||||
| 2025-08-08 | 13F | Foundations Investment Advisors, LLC | 0 | -100,00 | 0 | |||||
| 2025-08-12 | 13F | Global Retirement Partners, LLC | 900 | 51,01 | 98 | 46,27 | ||||
| 2025-08-14 | 13F | Mml Investors Services, Llc | 5.367 | 21,48 | 1 | |||||
| 2025-07-17 | 13F | Janney Montgomery Scott LLC | 2.255 | 0,40 | 0 | |||||
| 2025-08-05 | 13F | Key FInancial Inc | 73 | 0,00 | 8 | 0,00 | ||||
| 2025-07-18 | 13F | Truist Financial Corp | 16.649 | -7,12 | 1.736 | -9,21 | ||||
| 2025-07-11 | 13F | International Private Wealth Advisors LLC | 4.560 | -1,81 | 498 | 2,47 | ||||
| 2025-08-13 | 13F | Lido Advisors, LLC | 3.147 | 0,00 | 344 | 4,26 | ||||
| 2025-05-12 | 13F | Independent Advisor Alliance | 0 | -100,00 | 0 | |||||
| 2025-08-14 | 13F | Marshall Investment Management, Llc | 0 | -100,00 | 0 | |||||
| 2025-04-22 | 13F | Manning & Napier Advisors Llc | 0 | -100,00 | 0 |