Grundlæggende statistik
| Institutionelle ejere | 37 total, 37 long only, 0 short only, 0 long/short - change of 15,62% MRQ |
| Gennemsnitlig porteføljeallokering | 0.2474 % - change of 45,39% MRQ |
| Institutionelle aktier (lange) | 1.277.666 (ex 13D/G) - change of 0,25MM shares 24,26% MRQ |
| Institutionel værdi (lang) | $ 32.590 USD ($1000) |
Institutionelt ejerskab og aktionærer
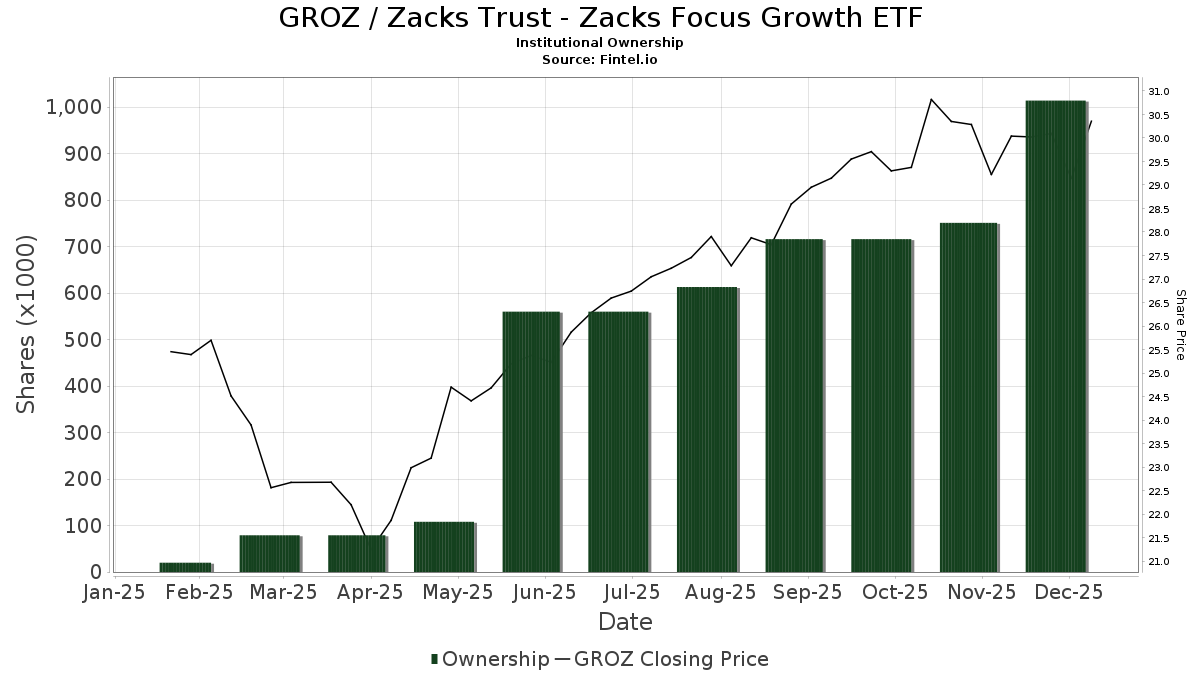
Zacks Trust - Zacks Focus Growth ETF (US:GROZ) har 37 institutionelle ejere og aktionærer, der har indsendt 13D/G- eller 13F-formularer til Securities Exchange Commission (SEC). Disse institutioner har i alt 1,277,666 aktier. Største aktionærer omfatter Change Path, LLC, Arete Wealth Advisors, LLC, Prosperity Financial Group, Inc., Strive Financial Group ,LLC, Strategic Blueprint, LLC, M1 Capital Management LLC, CoreCap Advisors, LLC, GeoWealth Management, LLC, Axim Planning & Wealth, and Koshinski Asset Management, Inc. .
Zacks Trust - Zacks Focus Growth ETF (BATS:GROZ) institutionel ejerskabsstruktur viser aktuelle positioner i virksomheden efter institutioner og fonde, samt seneste ændringer i positionsstørrelse. Større aktionærer kan omfatte individuelle investorer, investeringsforeninger, hedgefonde eller institutioner. Skema 13D angiver, at investoren besidder (eller besidder) mere end 5 % af virksomheden og har til hensigt (eller har til hensigt at) aktivt at forfølge en ændring i forretningsstrategi. Skema 13G indikerer en passiv investering på over 5%.
The share price as of April 24, 2026 is 30,69 / share. Previously, on April 28, 2025, the share price was 22,83 / share. This represents an increase of 34,43% over that period.
Fondens stemningsscore
Fund Sentiment Score (fka Ownership Accumulation Score) finder de aktier, der bliver mest købt af fonde. Det er resultatet af en sofistikeret, multi-faktor kvantitativ model, der identificerer virksomheder med de højeste niveauer af institutionel akkumulering. Scoringsmodellen bruger en kombination af den samlede stigning i oplyste ejere, ændringerne i porteføljeallokeringer i disse ejere og andre målinger. Tallet går fra 0 til 100, hvor højere tal indikerer et højere niveau af akkumulering for sine jævnaldrende, og 50 er gennemsnittet.
Opdateringsfrekvens: Dagligt
Se Ownership Explorer, som giver en liste over højest rangerende virksomheder.
AI+ Ask Fintel’s AI assistant about Zacks Trust - Zacks Focus Growth ETF.
Select a question to share a public post with an AI-crafted answer.
Thinking of good questions…
Institutionel Put/Call-forhold
Ud over at indberette standardaktie- og gældsudstedelser skal institutter med mere end 100 mill. aktiver under forvaltning også oplyse deres put- og call-optionsbeholdninger. Da salgsoptioner generelt indikerer negativ stemning, og købsoptioner indikerer positiv stemning, kan vi få en fornemmelse af den overordnede institutionelle stemning ved at plotte forholdet mellem put og kald. Diagrammet til højre viser det historiske put/call-forhold for dette instrument.
Brug af Put/Call Ratio som en indikator for investorernes stemning overvinder en af de vigtigste mangler ved at bruge totalt institutionelt ejerskab, som er, at en betydelig mængde af aktiver under forvaltning investeres passivt for at spore indekser. Passivt forvaltede fonde køber typisk ikke optioner, så indikatoren for put/call-forholdet følger mere nøje følelsen af aktivt forvaltede fonde.
13F og NPORT arkivering
Detaljer om 13F-arkivering er gratis. Detaljer om NP-ansøgninger kræver et premium-medlemskab. Grønne rækker angiver nye positioner. Røde rækker angiver lukkede positioner. Klik på linket ikon for at se den fulde transaktionshistorik.
Opgrader
for at låse premium-data op og eksportere til Excel ![]() .
.
| Fil dato | Kilde | Investor | Type | Gennemsnitlig pris (Øst) |
Aktier | Δ Aktier (%) |
Rapporteret Værdi ($1000) |
Δ Værdi (%) |
Port Alloc (%) |
|
|---|---|---|---|---|---|---|---|---|---|---|
| 2026-01-27 | 13F | Revisor Wealth Management LLC | 7.228 | 215 | ||||||
| 2026-04-13 | 13F | IFP Advisors, Inc | 24 | 0,00 | 1 | |||||
| 2026-02-02 | 13F | Cornerstone Planning Group LLC | 158 | 5 | ||||||
| 2026-04-24 | 13F | EJMK Ventures LLC | 21.678 | -35,92 | 598 | -40,77 | ||||
| 2026-04-16 | 13F | Balboa Wealth Partners | 21.051 | 51,17 | 580 | 40,10 | ||||
| 2026-02-13 | 13F | Advyzon Investment Management, LLC | 20.052 | 598 | ||||||
| 2026-02-17 | 13F | Strive Financial Group ,LLC | 74.527 | 2.221 | ||||||
| 2026-02-12 | 13F | Rossby Financial, LCC | 2.429 | 44,67 | 72 | 46,94 | ||||
| 2026-02-05 | 13F | Allworth Financial LP | 0 | -100,00 | 0 | |||||
| 2026-02-10 | 13F | Vantus Wealth LLC | 13.217 | 394 | ||||||
| 2026-02-11 | 13F | Alteri Wealth LLC | 14.475 | 4,30 | 431 | 5,90 | ||||
| 2026-02-13 | 13F | TRUE Private Wealth Advisors | 20.761 | -7,53 | 619 | -6,08 | ||||
| 2026-02-12 | 13F | M1 Capital Management LLC | 51.421 | 13,42 | 1.532 | 15,27 | ||||
| 2026-02-13 | 13F | Axim Planning & Wealth | 29.339 | 51,83 | 874 | 54,42 | ||||
| 2026-02-12 | 13F | von Borstel & Associates, Inc. | 0 | -100,00 | 0 | |||||
| 2026-02-13 | 13F | Change Path, LLC | 301.256 | 1,74 | 8.977 | 3,35 | ||||
| 2026-02-17 | 13F | Susquehanna International Group, Llp | 9.209 | 13,20 | 274 | 15,13 | ||||
| 2026-02-06 | 13F | Axxcess Wealth Management, Llc | 11.085 | -2,91 | 330 | -1,20 | ||||
| 2026-04-21 | 13F | Navigation Wealth Management, Inc. | 18.203 | 12,49 | 502 | 3,94 | ||||
| 2026-04-07 | 13F | CoreCap Advisors, LLC | 46.468 | 23,63 | 1.280 | 14,29 | ||||
| 2026-01-30 | 13F | Simplicity Wealth,LLC | 0 | -100,00 | 0 | |||||
| 2026-02-03 | 13F | Koshinski Asset Management, Inc. | 25.734 | 182,39 | 767 | 186,89 | ||||
| 2026-02-05 | 13F | Cambridge Investment Research Advisors, Inc. | 10.661 | 2,80 | 0 | |||||
| 2026-02-10 | 13F | Foundations Investment Advisors, LLC | 0 | -100,00 | 0 | |||||
| 2026-02-12 | 13F | Hardworking Capital Advisors, LLC | 22.420 | 668 | ||||||
| 2026-02-13 | 13F | Arete Wealth Advisors, LLC | 139.500 | 3,32 | 4 | 33,33 | ||||
| 2026-02-23 | 13F | Continental Investors Services, Inc. | 24.921 | 105,98 | 756 | 112,96 | ||||
| 2026-01-26 | 13F | Prosperity Financial Group, Inc. | 132.834 | 4,95 | 3.958 | 6,63 | ||||
| 2026-01-30 | 13F | Strategic Blueprint, LLC | 65.714 | 14,72 | 1.958 | 16,55 | ||||
| 2026-02-11 | 13F | Paragon Private Wealth Management, LLC | 7.053 | 210 | ||||||
| 2026-04-07 | 13F | GK Wealth Management LLC | 0 | -100,00 | 0 | |||||
| 2026-02-17 | 13F | Citadel Advisors Llc | 9.382 | 280 | ||||||
| 2026-04-17 | 13F | Ambassador Advisors, LLC | 12.793 | 37,41 | 353 | 27,08 | ||||
| 2026-02-13 | 13F | SRS Capital Advisors, Inc. | 901 | 27 | ||||||
| 2026-04-07 | 13F | Retirement Wealth Solutions LLC | 0 | -100,00 | 0 | |||||
| 2026-02-17 | 13F | Creative Planning | 14.185 | 11,39 | 423 | 13,14 | ||||
| 2026-02-17 | 13F | GeoWealth Management, LLC | 46.308 | 113,84 | 1.380 | 117,17 | ||||
| 2026-02-09 | 13F | Harbour Investments, Inc. | 258 | 316,13 | 8 | 600,00 | ||||
| 2026-02-10 | 13F | Envestnet Asset Management Inc | 15.883 | 30,72 | 473 | 32,87 | ||||
| 2026-02-17 | 13F | Advisory Services Network, LLC | 15.675 | -2,15 | 467 | -0,43 | ||||
| 2026-02-12 | 13F | Wayfinding Financial, LLC | 24.850 | 0,00 | 1 | |||||
| 2026-01-15 | 13F | Victory Financial Group, Llc | 23.602 | -8,14 | 703 | -6,64 | ||||
| 2026-04-21 | 13F | Vise Technologies, Inc. | 22.411 | 0,00 | 668 | 0,00 |