Grundlæggende statistik
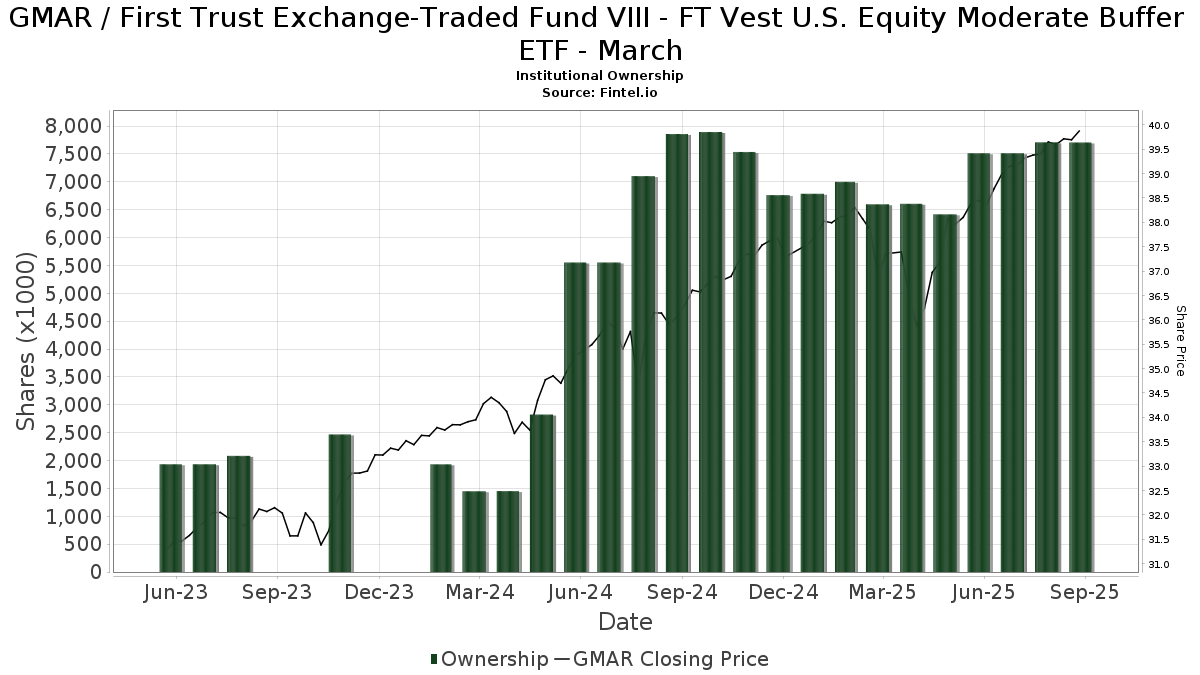
| Institutionelle ejere | 121 total, 121 long only, 0 short only, 0 long/short - change of 8,04% MRQ |
| Gennemsnitlig porteføljeallokering | 0.3113 % - change of -2,14% MRQ |
| Institutionelle aktier (lange) | 7.706.320 (ex 13D/G) - change of 0,19MM shares 2,56% MRQ |
| Institutionel værdi (lang) | $ 233.969 USD ($1000) |
Institutionelt ejerskab og aktionærer
First Trust Exchange-Traded Fund VIII - FT Vest U.S. Equity Moderate Buffer ETF - March (US:GMAR) har 121 institutionelle ejere og aktionærer, der har indsendt 13D/G- eller 13F-formularer til Securities Exchange Commission (SEC). Disse institutioner har i alt 7,706,320 aktier. Største aktionærer omfatter Raymond James Financial Inc, Commonwealth Equity Services, Llc, BUFZ - FT Vest Laddered Moderate Buffer ETF, BUFT - FT Cboe Vest Buffered Allocation Defensive ETF, ORG Partners LLC, Advisor Group Holdings, Inc., Cetera Investment Advisers, LPL Financial LLC, Envestnet Asset Management Inc, and Kestra Advisory Services, LLC .
First Trust Exchange-Traded Fund VIII - FT Vest U.S. Equity Moderate Buffer ETF - March (BATS:GMAR) institutionel ejerskabsstruktur viser aktuelle positioner i virksomheden efter institutioner og fonde, samt seneste ændringer i positionsstørrelse. Større aktionærer kan omfatte individuelle investorer, investeringsforeninger, hedgefonde eller institutioner. Skema 13D angiver, at investoren besidder (eller besidder) mere end 5 % af virksomheden og har til hensigt (eller har til hensigt at) aktivt at forfølge en ændring i forretningsstrategi. Skema 13G indikerer en passiv investering på over 5%.
The share price as of September 12, 2025 is 39,96 / share. Previously, on September 16, 2024, the share price was 36,31 / share. This represents an increase of 10,05% over that period.
Fondens stemningsscore
Fund Sentiment Score (fka Ownership Accumulation Score) finder de aktier, der bliver mest købt af fonde. Det er resultatet af en sofistikeret, multi-faktor kvantitativ model, der identificerer virksomheder med de højeste niveauer af institutionel akkumulering. Scoringsmodellen bruger en kombination af den samlede stigning i oplyste ejere, ændringerne i porteføljeallokeringer i disse ejere og andre målinger. Tallet går fra 0 til 100, hvor højere tal indikerer et højere niveau af akkumulering for sine jævnaldrende, og 50 er gennemsnittet.
Opdateringsfrekvens: Dagligt
Se Ownership Explorer, som giver en liste over højest rangerende virksomheder.
Institutionel Put/Call-forhold
Ud over at indberette standardaktie- og gældsudstedelser skal institutter med mere end 100 mill. aktiver under forvaltning også oplyse deres put- og call-optionsbeholdninger. Da salgsoptioner generelt indikerer negativ stemning, og købsoptioner indikerer positiv stemning, kan vi få en fornemmelse af den overordnede institutionelle stemning ved at plotte forholdet mellem put og kald. Diagrammet til højre viser det historiske put/call-forhold for dette instrument.
Brug af Put/Call Ratio som en indikator for investorernes stemning overvinder en af de vigtigste mangler ved at bruge totalt institutionelt ejerskab, som er, at en betydelig mængde af aktiver under forvaltning investeres passivt for at spore indekser. Passivt forvaltede fonde køber typisk ikke optioner, så indikatoren for put/call-forholdet følger mere nøje følelsen af aktivt forvaltede fonde.
13D/G-arkivering
Vi præsenterer 13D/G ansøgninger separat fra 13F ansøgninger på grund af den forskellige behandling af SEC. 13D/G-ansøgninger kan indgives af grupper af investorer (med én ledende), hvorimod 13F-ansøgninger ikke kan. Dette resulterer i situationer, hvor en investor kan indsende en 13D/G, der rapporterer én værdi for de samlede aktier (der repræsenterer alle de aktier, der ejes af investorgruppen), men derefter indsender en 13F, der rapporterer en anden værdi for de samlede aktier (der udelukkende repræsenterer deres egne) ejendomsret). Det betyder, at aktieejerskab af 13D/G-arkiver og 13F-arkiveringer ofte ikke er direkte sammenlignelige, så vi præsenterer dem separat.
Bemærk: Fra den 16. maj 2021 viser vi ikke længere ejere, der ikke har indsendt en 13D/G inden for det seneste år. Tidligere viste vi den fulde historie af 13D/G-arkiver. Generelt skal enheder, der er forpligtet til at indgive 13D/G-ansøgninger, indgive mindst årligt, før de indsender en afsluttende ansøgning. Dog forlader fonde nogle gange positioner uden at indsende en afsluttende ansøgning (dvs. de afvikler), så visning af den fulde historie resulterede nogle gange i forvirring om det nuværende ejerskab. For at undgå forvirring viser vi nu kun 'aktuelle' ejere - det vil sige - ejere, der har anmeldt inden for det seneste år.
Upgrade to unlock premium data.
| Fil dato | Form | Investor | Forrige Aktier |
Seneste Aktier |
Δ Aktier (Procent) |
Ejendomsret (Procent) |
Δ Ejerskab (Procent) |
|
|---|---|---|---|---|---|---|---|---|
| 2025-04-16 | FIRST TRUST PORTFOLIOS LP | 1,150,278 | 1,422,254 | 23.64 | 13.02 | -10.88 |
13F og NPORT arkivering
Detaljer om 13F-arkivering er gratis. Detaljer om NP-ansøgninger kræver et premium-medlemskab. Grønne rækker angiver nye positioner. Røde rækker angiver lukkede positioner. Klik på linket ikon for at se den fulde transaktionshistorik.
Opgrader
for at låse premium-data op og eksportere til Excel ![]() .
.
| Fil dato | Kilde | Investor | Type | Gennemsnitlig pris (Øst) |
Aktier | Δ Aktier (%) |
Rapporteret Værdi ($1000) |
Δ Værdi (%) |
Port Alloc (%) |
|
|---|---|---|---|---|---|---|---|---|---|---|
| 2025-08-13 | 13F | StoneX Group Inc. | 5.382 | 210 | ||||||
| 2025-08-13 | 13F | Transce3nd, LLC | 0 | -100,00 | 0 | |||||
| 2025-08-14 | 13F | CoreCap Advisors, LLC | 8.127 | 0,57 | 317 | 5,33 | ||||
| 2025-08-29 | 13F | Centaurus Financial, Inc. | 12.349 | 0,00 | 0 | |||||
| 2025-08-04 | 13F | Kovack Advisors, Inc. | 16.800 | 0,00 | 654 | 4,81 | ||||
| 2025-08-13 | 13F | Capital Analysts, Inc. | 1.859 | 113,68 | 0 | |||||
| 2025-08-13 | 13F | Cary Street Partners Financial Llc | 7.840 | -14,50 | 305 | -10,56 | ||||
| 2025-05-12 | 13F | Americana Partners, LLC | 0 | -100,00 | 0 | |||||
| 2025-08-14 | 13F/A | Barclays Plc | 3.388 | 0 | ||||||
| 2025-07-31 | 13F | Hanlon Investment Management, Inc. | 6.767 | 5,62 | 264 | 10,50 | ||||
| 2025-08-13 | 13F | Townsquare Capital Llc | 0 | -100,00 | 0 | |||||
| 2025-08-14 | 13F | Integrated Wealth Concepts LLC | 6.434 | 0,00 | 251 | 4,60 | ||||
| 2025-08-14 | 13F | LM Advisors LLC | 8.248 | 10,44 | 0 | |||||
| 2025-07-09 | 13F | HFG Wealth Management, LLC | 35.829 | -10,55 | 1.333 | -11,20 | ||||
| 2025-05-15 | 13F/A | Orion Portfolio Solutions, LLC | 6.261 | 3,64 | 233 | 2,65 | ||||
| 2025-07-16 | 13F | Maridea Wealth Management LLC | 6.195 | 241 | ||||||
| 2025-07-28 | 13F | Holistic Planning, LLC | 54.496 | -4,49 | 2.123 | 0,00 | ||||
| 2025-07-30 | 13F | Strategic Blueprint, LLC | 0 | -100,00 | 0 | |||||
| 2025-04-22 | 13F | Synergy Financial Management, LLC | 0 | -100,00 | 0 | |||||
| 2025-08-08 | 13F | Tanglewood Legacy Advisors, LLC | 18.535 | 27,74 | 722 | 33,77 | ||||
| 2025-07-09 | 13F | Keystone Wealth Services, LLC | 38.465 | 0,00 | 1.498 | 4,76 | ||||
| 2025-07-25 | NP | BUFZ - FT Vest Laddered Moderate Buffer ETF | 1.001.251 | 12,51 | 38.198 | 12,72 | ||||
| 2025-08-13 | 13F | Grantvest Financial Group LLC | 11.072 | -6,00 | 431 | -1,60 | ||||
| 2025-08-12 | 13F | Wood Tarver Financial Group, LLC | 158.728 | 953,41 | 6 | -98,93 | ||||
| 2025-07-29 | 13F | International Assets Investment Management, Llc | 16.090 | 627 | ||||||
| 2025-05-09 | 13F | Atria Wealth Solutions, Inc. | 0 | -100,00 | 0 | |||||
| 2025-08-14 | 13F | Susquehanna International Group, Llp | 8.933 | -61,58 | 348 | -59,84 | ||||
| 2025-05-13 | 13F | UBS Group AG | 0 | -100,00 | 0 | |||||
| 2025-08-06 | 13F | AE Wealth Management LLC | 0 | -100,00 | 0 | |||||
| 2025-09-04 | 13F/A | Advisor Group Holdings, Inc. | 294.780 | -77,34 | 11.482 | -76,28 | ||||
| 2025-08-14 | 13F | Sunbelt Securities, Inc. | 88.521 | -5,93 | 3.316 | -5,26 | ||||
| 2025-04-21 | 13F | Envestnet Portfolio Solutions, Inc. | 0 | -100,00 | 0 | |||||
| 2025-08-07 | 13F | Kestra Private Wealth Services, Llc | 7.205 | 0,00 | 281 | 4,48 | ||||
| 2025-05-14 | 13F | Ameriprise Financial Inc | 0 | -100,00 | 0 | -100,00 | ||||
| 2025-05-09 | 13F | GeoWealth Management, LLC | 0 | -100,00 | 0 | |||||
| 2025-07-08 | 13F | Nbc Securities, Inc. | 940 | 0,00 | 0 | |||||
| 2025-08-15 | 13F | Kestra Advisory Services, LLC | 173.104 | 10,75 | 6.742 | 15,96 | ||||
| 2025-08-11 | 13F | Anfield Capital Management, LLC | 41.482 | 1.616 | ||||||
| 2025-05-07 | 13F | Foundations Investment Advisors, LLC | 0 | -100,00 | 0 | |||||
| 2025-08-14 | 13F | Colony Group, LLC | 6.910 | 269 | ||||||
| 2025-08-12 | 13F | Change Path, LLC | 27.747 | 13,55 | 1.081 | 18,81 | ||||
| 2025-08-11 | 13F | Brass Tax Wealth Management, Inc | 20.341 | -0,25 | 792 | 4,49 | ||||
| 2025-07-11 | 13F | Farther Finance Advisors, LLC | 701 | -7,15 | 27 | -3,57 | ||||
| 2025-05-14 | 13F | Caitlin John, LLC | 0 | -100,00 | 0 | |||||
| 2025-07-30 | 13F | BlueChip Wealth Advisors LLC | 13.401 | 0,00 | 522 | 4,62 | ||||
| 2025-08-12 | 13F | Insigneo Advisory Services, Llc | 16.342 | 6,07 | 637 | 10,99 | ||||
| 2025-07-22 | 13F | Diligent Investors, LLC | 23.568 | 0,00 | 918 | 4,68 | ||||
| 2025-08-04 | 13F | Atria Investments Llc | 8.627 | 30,10 | 336 | 36,59 | ||||
| 2025-08-08 | 13F | Cetera Investment Advisers | 273.253 | -0,29 | 10.643 | 4,40 | ||||
| 2025-07-31 | 13F | Cambridge Investment Research Advisors, Inc. | 62.777 | 304,13 | 2 | |||||
| 2025-08-12 | 13F | PKS Advisory Services, LLC | 9.261 | 13,56 | 361 | 18,81 | ||||
| 2025-07-14 | 13F | Chris Bulman Inc | 16.363 | 1,07 | 637 | 5,81 | ||||
| 2025-07-10 | 13F | NorthCrest Asset Manangement, LLC | 10.422 | 0,00 | 407 | 5,17 | ||||
| 2025-08-04 | 13F | Arkadios Wealth Advisors | 37.533 | -7,40 | 1.462 | -3,05 | ||||
| 2025-08-08 | 13F | Bouchey Financial Group Ltd | 119.425 | -1,49 | 4.652 | 3,15 | ||||
| 2025-08-05 | 13F | Integrity Financial Corp /WA | 1.744 | 0,00 | 68 | 4,69 | ||||
| 2025-08-05 | 13F | EPG Wealth Management LLC | 0 | -100,00 | 0 | |||||
| 2025-08-11 | 13F | Principal Securities, Inc. | 500 | -86,67 | 19 | -86,43 | ||||
| 2025-08-12 | 13F | Archer Investment Corp | 5.597 | 0,18 | 218 | 4,83 | ||||
| 2025-07-18 | 13F | Madrona Financial Services, LLC | 16.039 | 0,00 | 625 | 4,70 | ||||
| 2025-07-29 | 13F | AssuredPartners Investment Advisors, LLC | 128.307 | -0,25 | 4.998 | 4,45 | ||||
| 2025-08-14 | 13F | Cascades Capital Asset Management, LLC | 0 | -100,00 | 0 | |||||
| 2025-04-15 | 13F | Noble Wealth Management PBC | 20.869 | -1,48 | 776 | -2,14 | ||||
| 2025-07-08 | 13F | Range Financial Group LLC | 17.511 | 101,93 | 682 | 111,80 | ||||
| 2025-04-04 | 13F | Sage Capital Advisors,llc | 0 | -100,00 | 0 | |||||
| 2025-08-04 | 13F | Spire Wealth Management | 5.666 | 0,00 | 221 | 4,76 | ||||
| 2025-07-15 | 13F | LVZ Advisors, Inc. | 9.513 | 0,00 | 371 | 4,82 | ||||
| 2025-08-12 | 13F | J.w. Cole Advisors, Inc. | 5.994 | 0,00 | 233 | 4,95 | ||||
| 2025-08-12 | 13F | Ameritas Investment Partners, Inc. | 300 | 0,00 | 12 | 0,00 | ||||
| 2025-08-12 | 13F | Proequities, Inc. | 0 | 0 | ||||||
| 2025-08-14 | 13F | Old Mission Capital Llc | 25.052 | 976 | ||||||
| 2025-07-28 | 13F | Harbour Investments, Inc. | 6.500 | -9,21 | 253 | -4,89 | ||||
| 2025-07-03 | 13F | TrueWealth Advisors, LLC | 7.816 | 304 | ||||||
| 2025-08-14 | 13F | Jane Street Group, Llc | 7.575 | -65,00 | 295 | -63,35 | ||||
| 2025-08-11 | 13F | Blue Bell Private Wealth Management, Llc | 1.550 | 63,16 | 60 | 71,43 | ||||
| 2025-08-18 | 13F | Geneos Wealth Management Inc. | 4.045 | 60,13 | 158 | 68,82 | ||||
| 2025-07-17 | 13F | Janney Montgomery Scott LLC | 163.960 | 125,76 | 6 | 200,00 | ||||
| 2025-07-17 | 13F | City Holding Co | 133.250 | 0,66 | 5.190 | 5,40 | ||||
| 2025-08-19 | 13F | National Asset Management, Inc. | 0 | -100,00 | 0 | |||||
| 2025-07-11 | 13F | Pinnacle Bancorp, Inc. | 325 | 0,00 | 13 | 0,00 | ||||
| 2025-07-28 | 13F | Mutual Advisors, LLC | 10.913 | 0,00 | 430 | 6,97 | ||||
| 2025-07-29 | 13F | Schubert & Co | 26.237 | -13,75 | 1.022 | -9,73 | ||||
| 2025-07-16 | 13F | ORG Partners LLC | 397.268 | -23,01 | 15.493 | -19,39 | ||||
| 2025-07-25 | 13F | Cwm, Llc | 2.860 | 0,00 | 0 | |||||
| 2025-07-18 | 13F | Truist Financial Corp | 36.551 | 13,08 | 1.424 | 18,39 | ||||
| 2025-07-24 | 13F | Cascade Investment Group, Inc. | 13.983 | -5,65 | 545 | -1,27 | ||||
| 2025-07-30 | 13F | IMG Wealth Management, Inc. | 588 | 0,00 | 23 | 4,76 | ||||
| 2025-08-12 | 13F | LPL Financial LLC | 252.243 | 21,58 | 9.825 | 27,30 | ||||
| 2025-07-22 | 13F | Beacon Financial Advisory LLC | 5.560 | 0,00 | 217 | 4,85 | ||||
| 2025-07-30 | 13F | Brookstone Capital Management | 22.330 | 32,92 | 870 | 39,26 | ||||
| 2025-08-06 | 13F | Commonwealth Equity Services, Llc | 1.052.741 | 411,44 | 41 | 485,71 | ||||
| 2025-07-25 | 13F | We Are One Seven, LLC | 27.515 | 1.072 | ||||||
| 2025-07-14 | 13F | Park Avenue Securities Llc | 5.719 | 0 | ||||||
| 2025-04-21 | 13F | Luken Investment Analytics, LLC | 0 | -100,00 | 0 | |||||
| 2025-07-15 | 13F | BostonPremier Wealth LLC | 6.646 | 0,00 | 259 | 4,45 | ||||
| 2025-08-14 | 13F | Sequent Planning LLC | 5.547 | 216 | ||||||
| 2025-08-15 | 13F | Captrust Financial Advisors | 7.200 | 0,00 | 280 | 4,87 | ||||
| 2025-07-25 | NP | BUFT - FT Cboe Vest Buffered Allocation Defensive ETF This fund is a listed as child fund of First Trust Advisors Lp and if that institution has disclosed ownership in this security, then these positions will not be double counted when calculating total shares and total value | 420.950 | -2,72 | 16.059 | -2,54 | ||||
| 2025-07-28 | 13F | Sagespring Wealth Partners, Llc | 8.147 | 0,00 | 317 | 4,62 | ||||
| 2025-07-21 | 13F | Ameritas Advisory Services, LLC | 2.925 | 114 | ||||||
| 2025-08-14 | 13F | Citadel Advisors Llc | 16.240 | 62,79 | 633 | 70,35 | ||||
| 2025-08-14 | 13F | Mml Investors Services, Llc | 154.805 | 358,21 | 6 | 500,00 | ||||
| 2025-07-29 | 13F | Koshinski Asset Management, Inc. | 9.250 | 23,01 | 360 | 29,03 | ||||
| 2025-07-29 | 13F | Stratos Wealth Advisors, LLC | 7.366 | 287 | ||||||
| 2025-08-05 | 13F | Prosperity Consulting Group, LLC | 5.652 | 0,00 | 220 | 4,76 | ||||
| 2025-08-14 | 13F | Gallagher Fiduciary Advisors, LLC | 13.063 | 0,00 | 509 | 4,74 | ||||
| 2025-07-15 | 13F | Legacy Solutions, Llc | 7.177 | 0,00 | 280 | 4,89 | ||||
| 2025-08-08 | 13F | Hartland & Co., LLC | 0 | -100,00 | 0 | |||||
| 2025-07-09 | 13F | Alesco Advisors Llc | 15.737 | -28,08 | 613 | -24,72 | ||||
| 2025-07-23 | 13F | REAP Financial Group, LLC | 62.028 | -1,35 | 2.416 | 3,25 | ||||
| 2025-08-07 | 13F | Allworth Financial LP | 589 | 23 | ||||||
| 2025-08-27 | 13F/A | Brinker Capital Investments, LLC | 5.614 | -10,33 | 219 | -6,03 | ||||
| 2025-07-15 | 13F | Armis Advisers, LLC | 62.028 | -1,29 | 2.416 | 3,34 | ||||
| 2025-07-21 | 13F | DHJJ Financial Advisors, Ltd. | 7.660 | 0,00 | 298 | 4,93 | ||||
| 2025-08-06 | 13F | Founders Financial Securities Llc | 82.703 | 216,86 | 3.156 | 227,62 | ||||
| 2025-08-01 | 13F | Envestnet Asset Management Inc | 216.233 | 12,94 | 8.422 | 18,25 | ||||
| 2025-08-06 | 13F | Bullseye Investment Management, LLC | 26.572 | 0,00 | 988 | 0,00 | ||||
| 2025-08-12 | 13F | Global Retirement Partners, LLC | 400 | 0,00 | 16 | 7,14 | ||||
| 2025-04-21 | 13F | Kingswood Wealth Advisors, Llc | 0 | -100,00 | 0 | |||||
| 2025-07-14 | 13F | Signature Securities Group Corporation | 7.741 | 10,22 | 302 | 15,33 | ||||
| 2025-08-05 | 13F | GPS Wealth Strategies Group, LLC | 1.881 | 0,00 | 73 | 5,80 | ||||
| 2025-08-12 | 13F | Jpmorgan Chase & Co | 1.276 | -86,78 | 50 | -86,35 | ||||
| 2025-08-14 | 13F | Raymond James Financial Inc | 1.131.873 | -18,25 | 44.086 | -14,40 | ||||
| 2025-07-24 | 13F | Stonebridge Financial Group, LLC | 5.267 | 146,93 | 205 | 159,49 | ||||
| 2025-08-12 | 13F | MAI Capital Management | 74.566 | -0,59 | 2.904 | 4,09 | ||||
| 2025-08-14 | 13F | Snowden Capital Advisors LLC | 6.643 | 0,00 | 259 | 4,45 | ||||
| 2025-08-14 | 13F | Diversify Advisory Services, LLC | 20.281 | 1,92 | 803 | 9,10 | ||||
| 2025-07-10 | 13F | Wealth Enhancement Advisory Services, Llc | 6.259 | 245 | ||||||
| 2025-07-29 | 13F | Stephens Inc /ar/ | 14.151 | 0,00 | 551 | 4,75 | ||||
| 2025-08-14 | 13F | Financial Network Wealth Advisors LLC | 1.073 | -33,97 | 42 | -31,67 | ||||
| 2025-07-07 | 13F | Schulz Wealth, LTD. | 37.637 | 6,25 | 1.466 | 11,24 | ||||
| 2025-08-12 | 13F | Steward Partners Investment Advisory, Llc | 9.609 | 123,57 | 374 | 135,22 | ||||
| 2025-08-14 | 13F | GWM Advisors LLC | 27.700 | -4,26 | 1.079 | 0,19 | ||||
| 2025-08-15 | 13F | Fsb Premier Wealth Management, Inc. | 5.339 | 208 | ||||||
| 2025-07-14 | 13F | AdvisorNet Financial, Inc | 6.806 | 0,00 | 265 | 4,74 | ||||
| 2025-08-13 | 13F | Cresset Asset Management, LLC | 9.991 | -2,44 | 389 | 2,37 | ||||
| 2025-07-23 | 13F | Avantra Family Wealth, Inc. | 13.953 | 0,81 | 543 | 5,64 | ||||
| 2025-08-14 | 13F | Hrt Financial Lp | 31.291 | 1 | ||||||
| 2025-07-25 | 13F | Hazlett, Burt & Watson, Inc. | 2.735 | 0,00 | 0 | |||||
| 2025-08-14 | 13F | Aqr Capital Management Llc | 18.460 | 719 | ||||||
| 2025-08-08 | 13F/A | Ignite Planners, LLC | 24.883 | -0,36 | 975 | 5,41 |