Grundlæggende statistik
| Institutionelle ejere | 63 total, 63 long only, 0 short only, 0 long/short - change of 14,29% MRQ |
| Gennemsnitlig porteføljeallokering | 0.1306 % - change of -37,61% MRQ |
| Institutionelle aktier (lange) | 18.318.448 (ex 13D/G) - change of 0,17MM shares 0,94% MRQ |
| Institutionel værdi (lang) | $ 717.744 USD ($1000) |
Institutionelt ejerskab og aktionærer
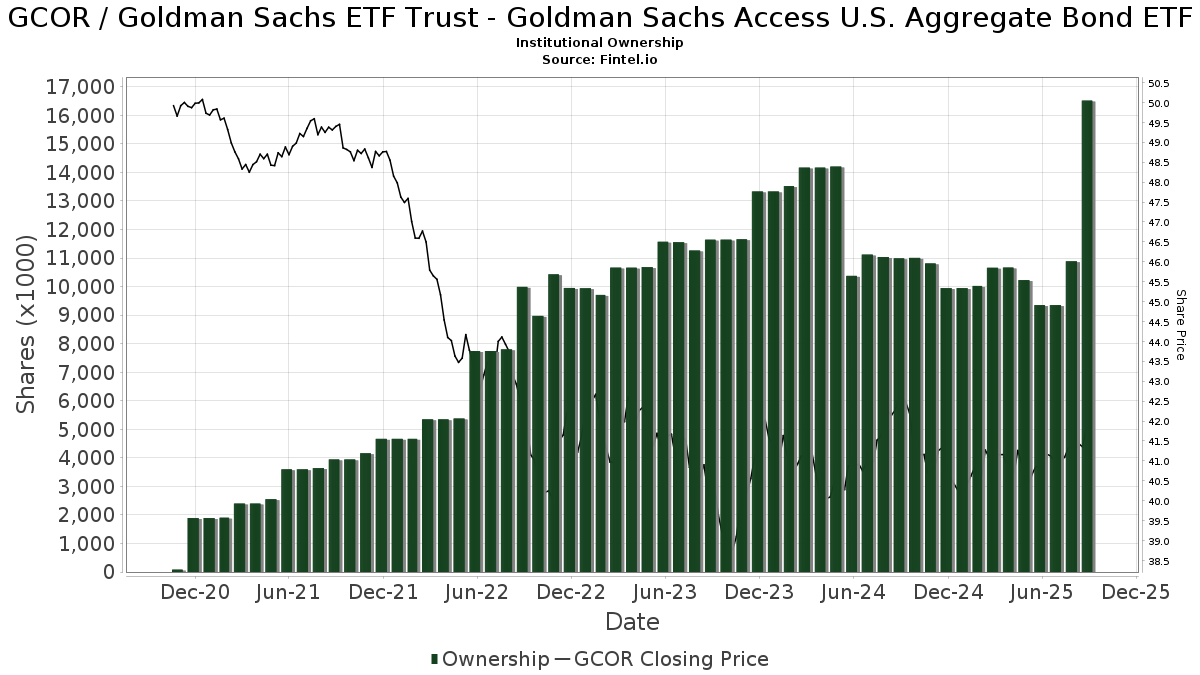
Goldman Sachs ETF Trust - Goldman Sachs Access U.S. Aggregate Bond ETF (US:GCOR) har 63 institutionelle ejere og aktionærer, der har indsendt 13D/G- eller 13F-formularer til Securities Exchange Commission (SEC). Disse institutioner har i alt 18,318,448 aktier. Største aktionærer omfatter LPL Financial LLC, Envestnet Asset Management Inc, Principal Securities, Inc., Goldman Sachs Group Inc, Morgan Stanley, Betterment LLC, Cetera Investment Advisers, Envestnet Portfolio Solutions, Inc., Sowell Financial Services LLC, and Keebeck Wealth Management, LLC .
Goldman Sachs ETF Trust - Goldman Sachs Access U.S. Aggregate Bond ETF (ARCA:GCOR) institutionel ejerskabsstruktur viser aktuelle positioner i virksomheden efter institutioner og fonde, samt seneste ændringer i positionsstørrelse. Større aktionærer kan omfatte individuelle investorer, investeringsforeninger, hedgefonde eller institutioner. Skema 13D angiver, at investoren besidder (eller besidder) mere end 5 % af virksomheden og har til hensigt (eller har til hensigt at) aktivt at forfølge en ændring i forretningsstrategi. Skema 13G indikerer en passiv investering på over 5%.
The share price as of April 2, 2026 is 41,26 / share. Previously, on April 7, 2025, the share price was 41,00 / share. This represents an increase of 0,63% over that period.
Fondens stemningsscore
Fund Sentiment Score (fka Ownership Accumulation Score) finder de aktier, der bliver mest købt af fonde. Det er resultatet af en sofistikeret, multi-faktor kvantitativ model, der identificerer virksomheder med de højeste niveauer af institutionel akkumulering. Scoringsmodellen bruger en kombination af den samlede stigning i oplyste ejere, ændringerne i porteføljeallokeringer i disse ejere og andre målinger. Tallet går fra 0 til 100, hvor højere tal indikerer et højere niveau af akkumulering for sine jævnaldrende, og 50 er gennemsnittet.
Opdateringsfrekvens: Dagligt
Se Ownership Explorer, som giver en liste over højest rangerende virksomheder.
AI+ Ask Fintel’s AI assistant about Goldman Sachs ETF Trust - Goldman Sachs Access U.S. Aggregate Bond ETF.
Select a question to share a public post with an AI-crafted answer.
Thinking of good questions…
Institutionel Put/Call-forhold
Ud over at indberette standardaktie- og gældsudstedelser skal institutter med mere end 100 mill. aktiver under forvaltning også oplyse deres put- og call-optionsbeholdninger. Da salgsoptioner generelt indikerer negativ stemning, og købsoptioner indikerer positiv stemning, kan vi få en fornemmelse af den overordnede institutionelle stemning ved at plotte forholdet mellem put og kald. Diagrammet til højre viser det historiske put/call-forhold for dette instrument.
Brug af Put/Call Ratio som en indikator for investorernes stemning overvinder en af de vigtigste mangler ved at bruge totalt institutionelt ejerskab, som er, at en betydelig mængde af aktiver under forvaltning investeres passivt for at spore indekser. Passivt forvaltede fonde køber typisk ikke optioner, så indikatoren for put/call-forholdet følger mere nøje følelsen af aktivt forvaltede fonde.
13F og NPORT arkivering
Detaljer om 13F-arkivering er gratis. Detaljer om NP-ansøgninger kræver et premium-medlemskab. Grønne rækker angiver nye positioner. Røde rækker angiver lukkede positioner. Klik på linket ikon for at se den fulde transaktionshistorik.
Opgrader
for at låse premium-data op og eksportere til Excel ![]() .
.
| Fil dato | Kilde | Investor | Type | Gennemsnitlig pris (Øst) |
Aktier | Δ Aktier (%) |
Rapporteret Værdi ($1000) |
Δ Værdi (%) |
Port Alloc (%) |
|
|---|---|---|---|---|---|---|---|---|---|---|
| 2026-02-02 | 13F | Robertson Stephens Wealth Management, LLC | 47.993 | -18,55 | 2.001 | -18,73 | ||||
| 2026-02-11 | 13F | LPL Financial LLC | 6.612.495 | 7,34 | 274.551 | 6,67 | ||||
| 2026-02-13 | 13F | Mml Investors Services, Llc | 5.653 | 235 | ||||||
| 2026-02-17 | 13F | Regal Investment Advisors LLC | 15.142 | -2,47 | 629 | -3,09 | ||||
| 2026-02-13 | 13F | Beacon Financial Advisory LLC | 19.195 | 131,38 | 797 | 130,06 | ||||
| 2026-02-17 | 13F | Perennial Investment Advisors, LLC | 10.591 | 2,85 | 440 | 2,09 | ||||
| 2026-01-23 | 13F | Optima Capital Llc | 404 | 17 | ||||||
| 2026-02-05 | 13F | Atria Investments Llc | 6.543 | 6,29 | 272 | 5,45 | ||||
| 2026-02-12 | 13F | Commonwealth Equity Services, Llc | 88.919 | 0,56 | 3.692 | 122.933,33 | ||||
| 2026-01-26 | 13F | Cwm, Llc | 421 | 0,00 | 0 | |||||
| 2026-02-04 | 13F | Pensionmark Financial Group, Llc | 8.091 | 336 | ||||||
| 2026-01-13 | 13F | CoreCap Advisors, LLC | 59.751 | 19,55 | 2.481 | 18,77 | ||||
| 2026-01-21 | 13F | Sowell Financial Services LLC | 222.255 | 251,89 | 9.228 | 249,81 | ||||
| 2026-02-05 | 13F | Castle Rock Wealth Management, LLC | 54.813 | -5,74 | 2.273 | -6,39 | ||||
| 2026-02-10 | 13F | Envestnet Asset Management Inc | 3.437.763 | -3,68 | 142.736 | -4,28 | ||||
| 2026-02-12 | 13F | Brinker Capital Investments, LLC | 38.742 | 8,79 | 1.609 | 8,14 | ||||
| 2026-02-18 | 13F | GWM Advisors LLC | 73.165 | 20,09 | 3.038 | 19,33 | ||||
| 2026-01-26 | 13F | David Kennon Inc | 93.136 | 1,08 | 3.867 | 0,47 | ||||
| 2026-02-17 | 13F | Citadel Advisors Llc | 0 | -100,00 | 0 | |||||
| 2026-02-10 | 13F | Goldman Sachs Group Inc | 1.100.168 | 17,18 | 45.679 | 16,45 | ||||
| 2026-01-26 | 13F | Patriot Financial Group Insurance Agency, LLC | 17.671 | 1,94 | 734 | 1,24 | ||||
| 2025-11-10 | 13F | Signature Securities Group Corporation | 0 | -100,00 | 0 | |||||
| 2025-11-12 | 13F | Cambridge Investment Research Advisors, Inc. | 0 | -100,00 | 0 | |||||
| 2026-02-13 | 13F | Centaurus Financial, Inc. | 9.637 | -87,41 | 0 | -100,00 | ||||
| 2026-02-13 | 13F | Ausdal Financial Partners, Inc. | 21.996 | 10,44 | 913 | 9,74 | ||||
| 2026-02-13 | 13F | Flow Traders U.s. Llc | 0 | -100,00 | 0 | |||||
| 2026-02-13 | 13F | Morgan Stanley | 1.081.329 | 5,62 | 44.897 | 4,96 | ||||
| 2025-11-04 | 13F | Umb Bank N A/mo | 0 | -100,00 | 0 | |||||
| 2026-01-20 | 13F | SOA Wealth Advisors, LLC. | 1.287 | 1,10 | 53 | 0,00 | ||||
| 2026-01-27 | 13F | Legacy Advisors, LLC | 22.902 | 0,62 | 955 | 0,42 | ||||
| 2025-11-13 | 13F | Wells Fargo & Company/mn | 0 | -100,00 | 0 | |||||
| 2025-10-24 | 13F | Bristlecone Advisors, LLC | 156.815 | 13,59 | 6.552 | 14,79 | ||||
| 2026-02-09 | 13F | LifePlan Investment Advisors, Inc. | 96.648 | 8,00 | 4.013 | 7,33 | ||||
| 2026-01-16 | 13F | Perigon Wealth Management, LLC | 28.255 | 36,93 | 1.173 | 36,08 | ||||
| 2026-02-06 | 13F | Envestnet Portfolio Solutions, Inc. | 772.682 | 23,75 | 32.082 | 22,98 | ||||
| 2026-02-12 | 13F | Principal Securities, Inc. | 1.317.711 | 0,37 | 54.711 | -0,25 | ||||
| 2026-02-11 | 13F | Jpmorgan Chase & Co | 743 | 31 | ||||||
| 2026-01-23 | 13F | Stonehaven Wealth & Tax Solutions, Llc | 6.060 | -42,68 | 252 | -43,08 | ||||
| 2026-02-13 | 13F | Integrated Wealth Concepts LLC | 32.596 | 18,24 | 1.353 | 17,55 | ||||
| 2026-02-11 | 13F | Parallel Advisors, LLC | 0 | 0 | ||||||
| 2026-02-09 | 13F | Integrity Alliance, Llc. | 15.382 | 639 | ||||||
| 2026-02-06 | 13F | Global Retirement Partners, LLC | 25.935 | 3,05 | 1.077 | 2,38 | ||||
| 2026-02-17 | 13F | Private Advisor Group, LLC | 15.110 | -2,28 | 627 | -2,79 | ||||
| 2026-02-17 | 13F | Fmr Llc | 740 | -44,78 | 31 | -45,45 | ||||
| 2026-02-19 | 13F | CI Private Wealth, LLC | 148.846 | 6.180 | ||||||
| 2026-02-05 | 13F | Allworth Financial LP | 4.109 | -7,33 | 171 | -8,11 | ||||
| 2026-02-17 | 13F | Bank Of America Corp /de/ | 36.286 | -17,05 | 1.507 | -17,57 | ||||
| 2026-02-12 | 13F | Mount Yale Investment Advisors, LLC | 61.854 | 114,54 | 2.579 | 114,12 | ||||
| 2025-11-14 | 13F | Susquehanna International Group, Llp | 0 | -100,00 | 0 | |||||
| 2026-02-17 | 13F | Cetera Investment Advisers | 822.867 | 5,49 | 34.165 | 4,83 | ||||
| 2026-01-26 | 13F | Consolidated Portfolio Review Corp | 0 | -100,00 | 0 | |||||
| 2026-02-17 | 13F | GeoWealth Management, LLC | 985 | 41 | ||||||
| 2026-01-29 | 13F | UBS Group AG | 81 | 3 | ||||||
| 2026-01-07 | 13F | Magnus Financial Group LLC | 18.037 | 749 | ||||||
| 2026-01-26 | 13F | Private Trust Co Na | 52.815 | 2,82 | 2.193 | 2,14 | ||||
| 2026-02-10 | 13F | Bank of New York Mellon Corp | 107.073 | 3,08 | 4.446 | 2,44 | ||||
| 2026-02-12 | 13F | Colonial Trust Advisors | 1 | -99,93 | 0 | -100,00 | ||||
| 2026-02-17 | 13F | Royal Bank Of Canada | 1.466 | 61 | ||||||
| 2026-02-13 | 13F | Transamerica Financial Advisors, Inc. | 10.973 | 52,40 | 458 | 52,33 | ||||
| 2026-02-13 | 13F | Maia Wealth LLC | 18.230 | -0,34 | 763 | 0,13 | ||||
| 2026-02-06 | 13F | Vestmark Advisory Solutions, Inc. | 69.202 | 140,03 | 2.873 | 138,62 | ||||
| 2026-01-29 | 13F | Sanctuary Advisors, LLC | 24.579 | 3,79 | 1.021 | 3,13 | ||||
| 2026-02-12 | 13F | Betterment LLC | 1.024.281 | 4,89 | 43 | 5,00 | ||||
| 2026-02-17 | 13F | Ameriprise Financial Inc | 0 | -100,00 | 0 | |||||
| 2026-02-17 | 13F | Captrust Financial Advisors | 156.686 | 1,49 | 6.506 | 0,85 | ||||
| 2026-02-17 | 13F | Raymond James Financial Inc | 15.685 | 43,97 | 651 | 43,08 | ||||
| 2026-02-17 | 13F | Advisor Group Holdings, Inc. | 28.085 | -41,03 | 1.166 | -41,14 | ||||
| 2026-02-17 | 13F | Keebeck Wealth Management, LLC | 180.582 | 10,23 | 7.529 | 10,01 | ||||
| 2026-02-13 | 13F | Kestra Advisory Services, LLC | 3.513 | 146 | ||||||
| 2026-02-14 | 13F | Rockefeller Capital Management L.P. | 1.865 | 78 | ||||||
| 2025-11-14 | 13F | Jane Street Group, Llc | 0 | -100,00 | 0 | |||||
| 2026-02-09 | 13F | Harbour Investments, Inc. | 293 | 0,00 | 12 | 0,00 | ||||
| 2026-02-10 | 13F | Syntegra Private Wealth Group, LLC | 11.118 | 3,23 | 462 | 2,67 | ||||
| 2026-02-11 | 13F | O'shaughnessy Asset Management, Llc | 197 | 0,00 | 8 | 0,00 |