Grundlæggende statistik
| Institutionelle aktier (lange) | 11.531.022 - 17,52% (ex 13D/G) - change of 0,96MM shares 9,11% MRQ |
| Institutionel værdi (lang) | $ 46.503 USD ($1000) |
Institutionelt ejerskab og aktionærer
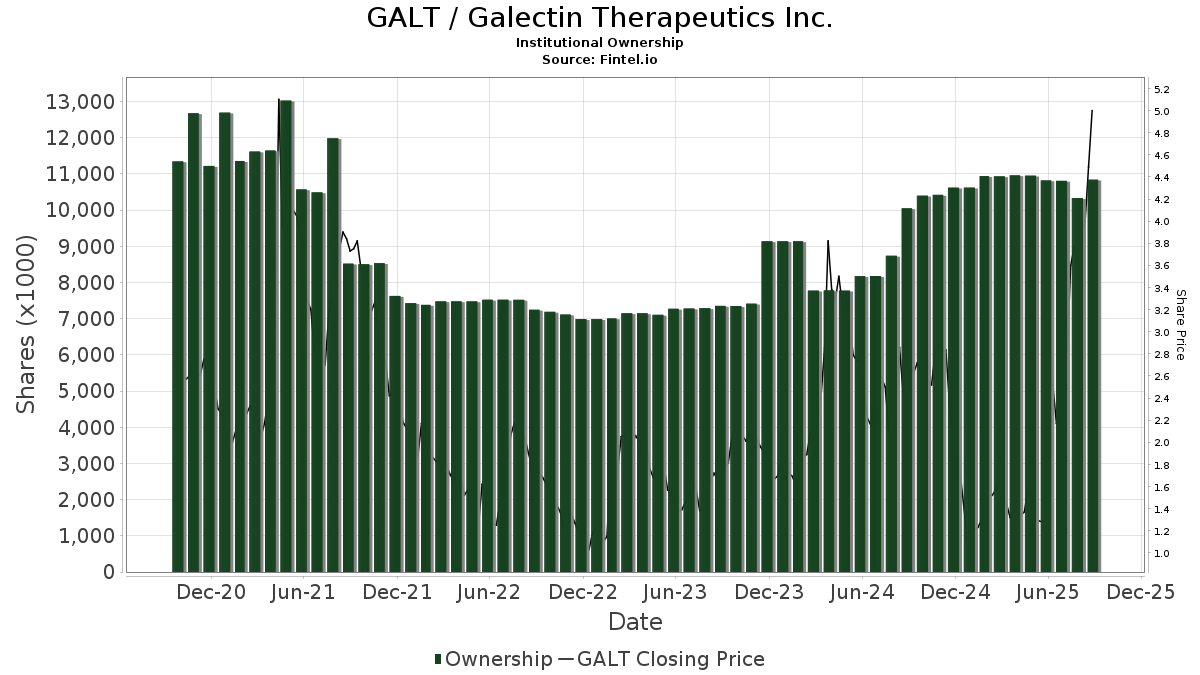
Galectin Therapeutics Inc. (US:GALT) har 100 institutionelle ejere og aktionærer, der har indsendt 13D/G- eller 13F-formularer til Securities Exchange Commission (SEC). Disse institutioner har i alt 11,531,022 aktier. Største aktionærer omfatter Vanguard Group Inc, Advisor Group Holdings, Inc., BlackRock, Inc., Group One Trading, L.p., Marshall Wace, Llp, Wealthspire Advisors, LLC, Geode Capital Management, Llc, Susquehanna International Group, Llp, Commonwealth Equity Services, Llc, and LPL Financial LLC .
Galectin Therapeutics Inc. (NasdaqCM:GALT) institutionel ejerskabsstruktur viser aktuelle positioner i virksomheden efter institutioner og fonde, samt seneste ændringer i positionsstørrelse. Større aktionærer kan omfatte individuelle investorer, investeringsforeninger, hedgefonde eller institutioner. Skema 13D angiver, at investoren besidder (eller besidder) mere end 5 % af virksomheden og har til hensigt (eller har til hensigt at) aktivt at forfølge en ændring i forretningsstrategi. Skema 13G indikerer en passiv investering på over 5%.
The share price as of April 2, 2026 is 2,67 / share. Previously, on April 4, 2025, the share price was 1,32 / share. This represents an increase of 102,27% over that period.
Fondens stemningsscore
Fund Sentiment Score (fka Ownership Accumulation Score) finder de aktier, der bliver mest købt af fonde. Det er resultatet af en sofistikeret, multi-faktor kvantitativ model, der identificerer virksomheder med de højeste niveauer af institutionel akkumulering. Scoringsmodellen bruger en kombination af den samlede stigning i oplyste ejere, ændringerne i porteføljeallokeringer i disse ejere og andre målinger. Tallet går fra 0 til 100, hvor højere tal indikerer et højere niveau af akkumulering for sine jævnaldrende, og 50 er gennemsnittet.
Opdateringsfrekvens: Dagligt
Se Ownership Explorer, som giver en liste over højest rangerende virksomheder.
AI+ Ask Fintel’s AI assistant about Galectin Therapeutics Inc..
Select a question to share a public post with an AI-crafted answer.
Thinking of good questions…
Institutionel Put/Call-forhold
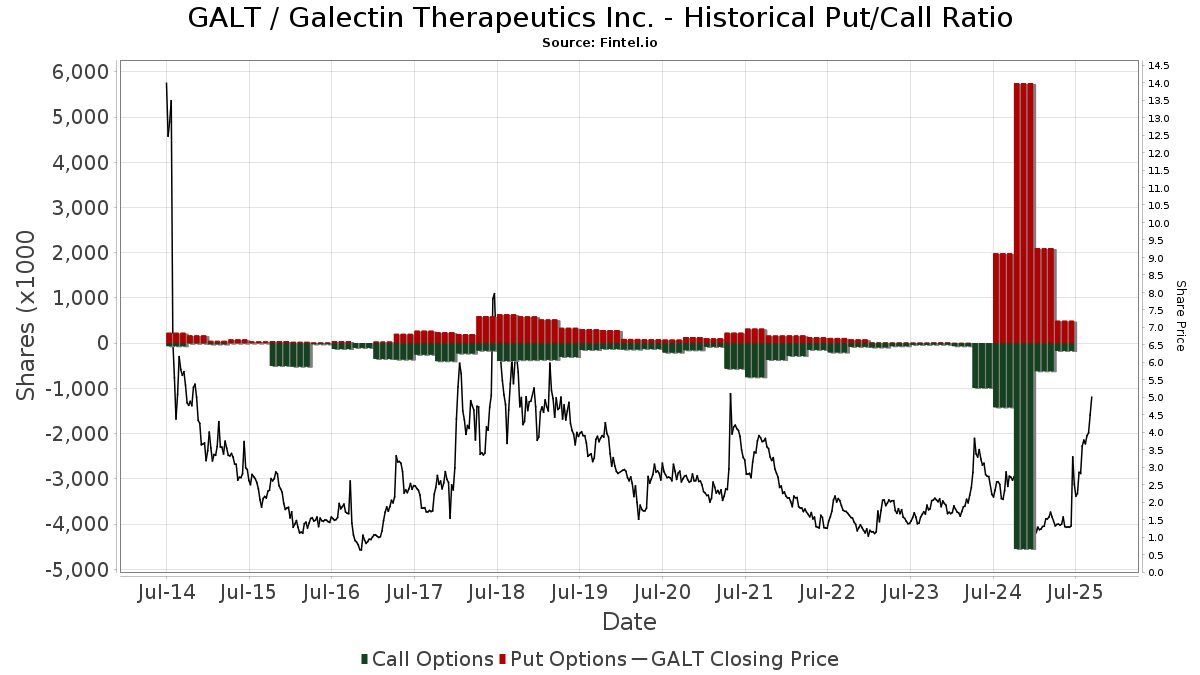
Ud over at indberette standardaktie- og gældsudstedelser skal institutter med mere end 100 mill. aktiver under forvaltning også oplyse deres put- og call-optionsbeholdninger. Da salgsoptioner generelt indikerer negativ stemning, og købsoptioner indikerer positiv stemning, kan vi få en fornemmelse af den overordnede institutionelle stemning ved at plotte forholdet mellem put og kald. Diagrammet til højre viser det historiske put/call-forhold for dette instrument.
Brug af Put/Call Ratio som en indikator for investorernes stemning overvinder en af de vigtigste mangler ved at bruge totalt institutionelt ejerskab, som er, at en betydelig mængde af aktiver under forvaltning investeres passivt for at spore indekser. Passivt forvaltede fonde køber typisk ikke optioner, så indikatoren for put/call-forholdet følger mere nøje følelsen af aktivt forvaltede fonde.
13F og NPORT arkivering
Detaljer om 13F-arkivering er gratis. Detaljer om NP-ansøgninger kræver et premium-medlemskab. Grønne rækker angiver nye positioner. Røde rækker angiver lukkede positioner. Klik på linket ikon for at se den fulde transaktionshistorik.
Opgrader
for at låse premium-data op og eksportere til Excel ![]() .
.
| Fil dato | Kilde | Investor | Type | Gennemsnitlig pris (Øst) |
Aktier | Δ Aktier (%) |
Rapporteret Værdi ($1000) |
Δ Værdi (%) |
Port Alloc (%) |
|
|---|---|---|---|---|---|---|---|---|---|---|
| 2026-02-11 | 13F | Bradley & Co. Private Wealth Management, LLC | 0 | -100,00 | 0 | |||||
| 2026-01-28 | 13F | Atwood & Palmer Inc | 10.000 | 0,00 | 42 | -2,38 | ||||
| 2026-02-17 | 13F | Mangrove Partners | 18.783 | 78 | ||||||
| 2026-02-17 | 13F | Optiver Holding B.V. | 18 | 0,00 | 0 | |||||
| 2025-11-12 | 13F | Soltis Investment Advisors LLC | 0 | -100,00 | 0 | -100,00 | ||||
| 2026-02-17 | 13F | Lighthouse Investment Partners, LLC | 18.900 | 79 | ||||||
| 2026-02-17 | 13F | Creative Planning | 11.265 | 8,47 | 47 | 6,98 | ||||
| 2026-02-11 | 13F | LPL Financial LLC | 325.256 | -9,72 | 1.353 | -11,28 | ||||
| 2026-02-06 | 13F | HighTower Advisors, LLC | 88.375 | 0,00 | 368 | -1,87 | ||||
| 2026-02-13 | 13F | Hudson Bay Capital Management LP | 78.145 | 427,08 | 325 | 424,19 | ||||
| 2026-01-08 | 13F | True Wealth Design, LLC | 17 | 0,00 | 0 | |||||
| 2026-02-10 | 13F/A | Northwestern Mutual Wealth Management Co | 600 | 2 | ||||||
| 2026-02-09 | 13F | Harbour Investments, Inc. | 150 | 1 | ||||||
| 2026-02-23 | 13F | Virtu Financial LLC | 53.551 | 37,42 | 0 | |||||
| 2025-11-14 | 13F | Cubist Systematic Strategies, LLC | 0 | -100,00 | 0 | -100,00 | ||||
| 2026-02-17 | 13F | Qube Research & Technologies Ltd | 74.643 | 22,63 | 311 | 20,62 | ||||
| 2026-01-21 | 13F | Sound Income Strategies, LLC | 2.980 | 0,00 | 9 | -35,71 | ||||
| 2026-02-10 | 13F | Lido Advisors, LLC | 36.327 | 0,00 | 154 | 0,00 | ||||
| 2026-02-09 | 13F | Hantz Financial Services, Inc. | 0 | -100,00 | 0 | |||||
| 2026-01-12 | 13F | Traynor Capital Management, Inc. | 101.600 | 2,52 | 423 | 0,72 | ||||
| 2025-10-08 | 13F/A | New York State Common Retirement Fund | 0 | -100,00 | 0 | -100,00 | ||||
| 2025-11-05 | 13F | SBI Securities Co., Ltd. | 0 | -100,00 | 0 | |||||
| 2026-02-17 | 13F | Cetera Investment Advisers | 14.220 | 59 | ||||||
| 2026-02-12 | 13F | Jane Street Group, Llc | 199.339 | 1.258,27 | 829 | 1.237,10 | ||||
| 2025-11-14 | 13F | Point72 Asia (Singapore) Pte. Ltd. | 0 | -100,00 | 0 | -100,00 | ||||
| 2026-02-12 | 13F | Jane Street Group, Llc | Call | 180.300 | 750 | |||||
| 2026-02-13 | 13F | Charles Schwab Investment Management Inc | 29.985 | -33,35 | 125 | -34,74 | ||||
| 2026-02-09 | 13F | Solutions 4 Wealth, Ltd | 25.377 | 0,00 | 106 | -1,87 | ||||
| 2026-02-17 | 13F | Argyle Capital Partners, LLC | 13.375 | 0,00 | 56 | -1,79 | ||||
| 2026-02-11 | 13F | Group One Trading, L.p. | Put | 12.000 | -69,39 | 50 | -70,48 | |||
| 2026-02-13 | 13F | Vivaldi Capital Management, LLC | 204.070 | -20,21 | 849 | -21,70 | ||||
| 2026-01-29 | 13F | D.a. Davidson & Co. | 0 | -100,00 | 0 | -100,00 | ||||
| 2026-02-11 | 13F | Group One Trading, L.p. | Call | 637.100 | 346,46 | 2.650 | 338,74 | |||
| 2026-02-11 | 13F | Horizon Kinetics Asset Management Llc | 51.484 | -4,20 | 214 | -5,73 | ||||
| 2026-02-06 | 13F | EverSource Wealth Advisors, LLC | 1 | -98,70 | 0 | |||||
| 2026-01-28 | 13F | Geneos Wealth Management Inc. | 243.327 | -32,44 | 1.012 | -33,73 | ||||
| 2026-01-15 | 13F | Fortitude Family Office, LLC | 90 | 0 | ||||||
| 2025-11-14 | 13F | Hrt Financial Lp | 0 | -100,00 | 0 | |||||
| 2026-01-13 | 13F | CoreCap Advisors, LLC | 4.594 | 0,00 | 19 | 0,00 | ||||
| 2026-01-12 | 13F | Salem Investment Counselors Inc | 0 | -100,00 | 0 | |||||
| 2026-02-13 | 13F | Mariner, LLC | 19.905 | -27,80 | 83 | -29,31 | ||||
| 2026-02-13 | 13F | Citigroup Inc | 11.225 | 8.153,68 | 47 | |||||
| 2026-02-13 | 13F | OMERS ADMINISTRATION Corp | 63.200 | 263 | ||||||
| 2026-01-29 | 13F | UBS Group AG | 39.104 | 24,08 | 163 | 21,80 | ||||
| 2026-02-17 | 13F | Pinnacle Financial Partners, Inc. | 48.000 | 200 | ||||||
| 2026-02-13 | 13F | State Street Corp | 242.232 | 5,16 | 1.008 | 3,28 | ||||
| 2026-01-30 | 13F | Archer Investment Corp | 12.893 | 17,21 | 54 | 15,22 | ||||
| 2025-11-13 | 13F | Affinity Asset Advisors, LLC | Put | 0 | -100,00 | 0 | -100,00 | |||
| 2026-02-02 | 13F | Truist Financial Corp | 68.000 | 0,00 | 283 | -1,74 | ||||
| 2026-02-13 | 13F | Barclays Plc | 106.401 | 272,20 | 443 | 466,67 | ||||
| 2026-02-17 | 13F | Gladstone Institutional Advisory LLC | 23.900 | -3,04 | 99 | -4,81 | ||||
| 2026-02-17 | 13F | Ancora Advisors, LLC | 0 | -100,00 | 0 | -100,00 | ||||
| 2026-02-17 | 13F | Fmr Llc | 12.807 | 0,79 | 53 | 0,00 | ||||
| 2026-02-17 | 13F | Citadel Advisors Llc | Call | 27.500 | -61,96 | 114 | -62,75 | |||
| 2026-01-16 | 13F | Ronald Blue Trust, Inc. | 7.000 | 0,00 | 29 | 0,00 | ||||
| 2026-01-15 | 13F | Nisa Investment Advisors, Llc | 716 | 0,00 | 3 | -33,33 | ||||
| 2026-02-19 | 13F | Invesco Ltd. | 10.278 | 43 | ||||||
| 2026-02-17 | 13F | Susquehanna International Group, Llp | Put | 79.100 | 14,64 | 329 | 12,67 | |||
| 2026-02-13 | 13F | Squarepoint Ops LLC | 16.462 | 68 | ||||||
| 2026-02-17 | 13F | Susquehanna International Group, Llp | Call | 515.600 | 889,64 | 2.145 | 874,55 | |||
| 2026-02-10 | 13F | Goldman Sachs Group Inc | 307.229 | 1.295,61 | 1.278 | 1.274,19 | ||||
| 2026-01-30 | 13F | Activest Wealth Management | 2.000 | 0,00 | 8 | 0,00 | ||||
| 2026-02-12 | 13F | BlackRock, Inc. | 796.558 | -0,14 | 3.314 | -1,92 | ||||
| 2026-01-07 | 13F | Cahaba Wealth Management, Inc. | 21.000 | 0,00 | 87 | -1,14 | ||||
| 2025-10-14 | 13F | Berkshire Money Management, Inc. | 0 | -100,00 | 0 | -100,00 | ||||
| 2026-01-21 | 13F | Stock Yards Bank & Trust Co | 10.500 | 0,00 | 44 | -2,27 | ||||
| 2026-02-14 | 13F | Rockefeller Capital Management L.P. | 4.386 | 0,00 | 18 | 0,00 | ||||
| 2026-01-20 | 13F | Signaturefd, Llc | 1.663 | 7,36 | 7 | 0,00 | ||||
| 2026-02-17 | 13F | Tower Research Capital LLC (TRC) | 6.013 | 25 | ||||||
| 2026-02-10 | 13F | Bnp Paribas Arbitrage, Sa | 13.518 | 9.767,15 | 56 | |||||
| 2026-02-05 | 13F | Cambridge Investment Research Advisors, Inc. | 126.019 | 3,97 | 1 | |||||
| 2026-01-08 | 13F | Wealth Enhancement Advisory Services, Llc | 35.217 | -0,06 | 121 | -27,98 | ||||
| 2026-02-17 | 13F | Bank Of America Corp /de/ | 25.063 | -1,04 | 104 | -2,80 | ||||
| 2026-02-17 | 13F | Susquehanna International Group, Llp | 286.919 | -35,75 | 1.194 | -36,91 | ||||
| 2026-02-13 | 13F | Integrated Wealth Concepts LLC | 0 | -100,00 | 0 | |||||
| 2025-11-14 | 13F | MIRAE ASSET GLOBAL ETFS HOLDINGS Ltd. | 0 | -100,00 | 0 | |||||
| 2026-01-26 | 13F | Cwm, Llc | 306 | -7,27 | 0 | |||||
| 2026-02-12 | 13F | Wealthspire Advisors, LLC | 601.973 | 25,54 | 2.504 | 23,35 | ||||
| 2026-01-20 | 13F | Stratos Wealth Partners, LTD. | 19.088 | -36,48 | 79 | -37,80 | ||||
| 2026-02-17 | 13F | Sig Brokerage, Lp | 13.596 | -13,49 | 57 | -15,15 | ||||
| 2025-11-07 | 13F | Beacon Capital Management, LLC | 0 | -100,00 | 0 | |||||
| 2026-01-20 | 13F | Sovran Advisors, LLC | 225.874 | 43,50 | 712 | -10,90 | ||||
| 2026-02-11 | 13F | Jpmorgan Chase & Co | 11.043 | -28,62 | 46 | -30,77 | ||||
| 2026-02-17 | 13F | Northern Trust Corp | 130.448 | 7,75 | 543 | 5,86 | ||||
| 2026-02-13 | 13F | Wells Fargo & Company/mn | 4.091 | 0,00 | 17 | 0,00 | ||||
| 2025-10-09 | 13F | Dynamic Advisor Solutions LLC | 0 | -100,00 | 0 | |||||
| 2026-01-29 | 13F | Sanctuary Advisors, LLC | 45.785 | -9,49 | 190 | -11,21 | ||||
| 2026-02-17 | 13F | Blair William & Co/il | 37.884 | 0,00 | 158 | -1,87 | ||||
| 2025-11-07 | 13F | Synovus Financial Corp | 48.000 | 0,00 | 203 | 100,99 | ||||
| 2026-02-11 | 13F | Group One Trading, L.p. | 0 | -100,00 | 0 | -100,00 | ||||
| 2026-02-17 | 13F | Citadel Advisors Llc | Put | 0 | -100,00 | 0 | ||||
| 2026-02-17 | 13F | Russell Investments Group, Ltd. | 18.074 | 9.997,21 | 75 | |||||
| 2026-03-03 | 13F | Tulsa Wealth Advisors, INC | 23.394 | 97 | ||||||
| 2026-01-23 | 13F | Retirement Guys Formula Llc | 184.562 | 11,19 | 768 | 9,26 | ||||
| 2026-01-28 | 13F | Barrett & Company, Inc. | 0 | -100,00 | 0 | -100,00 | ||||
| 2026-02-13 | 13F | Colony Group, LLC | 12.596 | 2,72 | 52 | 1,96 | ||||
| 2026-02-17 | 13F | Summit Trail Advisors, Llc | 20.000 | 0,00 | 83 | -1,19 | ||||
| 2026-02-13 | 13F | Inspire Advisors, LLC | 21.095 | 0,00 | 88 | -2,25 | ||||
| 2026-01-27 | 13F | Belpointe Asset Management LLC | 106.139 | 442 | ||||||
| 2026-02-17 | 13F | Royal Bank Of Canada | 6.175 | 1.197,27 | 25 | 1.150,00 | ||||
| 2025-11-14 | 13F | Aqr Capital Management Llc | 0 | -100,00 | 0 | |||||
| 2026-01-27 | 13F | Fortis Capital Advisors, LLC | 106.139 | 442 | ||||||
| 2026-02-09 | 13F | Geode Capital Management, Llc | 598.074 | -5,53 | 2.489 | -7,20 | ||||
| 2026-01-29 | 13F | Vanguard Group Inc | 2.288.848 | 1,82 | 9.522 | 0,01 | ||||
| 2025-11-14 | 13F | Tang Capital Management Llc | 0 | -100,00 | 0 | -100,00 | ||||
| 2025-11-14 | 13F | Sofos Investments, Inc. | 0 | -100,00 | 0 | -100,00 | ||||
| 2026-02-06 | 13F | Global Retirement Partners, LLC | 250 | 0,00 | 1 | 0,00 | ||||
| 2026-02-17 | 13F | Citadel Advisors Llc | 0 | -100,00 | 0 | |||||
| 2025-11-14 | 13F | Wolverine Trading, Llc | Call | 18.000 | 62,16 | 76 | 200,00 | |||
| 2026-02-09 | 13F | Hartland & Co., LLC | Call | 8 | ||||||
| 2026-02-13 | 13F | SRS Capital Advisors, Inc. | 0 | -100,00 | 0 | |||||
| 2026-02-17 | 13F | Wellington Management Group Llp | 142.220 | 592 | ||||||
| 2026-02-09 | 13F | Hartland & Co., LLC | 6.000 | 0,00 | 25 | -4,00 | ||||
| 2026-02-13 | 13F | MAI Capital Management | 1.000 | 0,00 | 4 | 0,00 | ||||
| 2026-02-17 | 13F | XTX Topco Ltd | 51.936 | 216 | ||||||
| 2026-02-06 | 13F | Gsa Capital Partners Llp | 101.966 | 17,08 | 0 | |||||
| 2026-02-13 | 13F | Morgan Stanley | 279.288 | 22,32 | 1.162 | 20,19 | ||||
| 2026-02-17 | 13F | Advisor Group Holdings, Inc. | 1.090.590 | -10,95 | 4.537 | -13,45 | ||||
| 2026-02-12 | 13F | CIBC Private Wealth Group, LLC | 200 | 1 | ||||||
| 2026-02-12 | 13F | Commonwealth Equity Services, Llc | 334.096 | 13,29 | 1.390 | 138.800,00 | ||||
| 2026-02-17 | 13F | Two Sigma Investments, Lp | 16.612 | -0,21 | 69 | -1,43 | ||||
| 2026-02-13 | 13F | Marshall Wace, Llp | 602.134 | 2.505 | ||||||
| 2026-02-11 | 13F | Simplex Trading, Llc | Put | 6.000 | -88,30 | 25 | ||||
| 2026-02-13 | 13F | Quattro Advisors LLC | 634 | 3 | ||||||
| 2026-02-11 | 13F | Simplex Trading, Llc | 5.579 | -91,72 | 23 | |||||
| 2026-02-17 | 13F | Raymond James Financial Inc | 13.717 | 57 | ||||||
| 2026-02-17 | 13F | Millennium Management Llc | 235.508 | 113,28 | 980 | 109,64 | ||||
| 2026-02-17 | 13F | 683 Capital Management, LLC | 162.484 | 676 | ||||||
| 2025-11-14 | 13F | Point72 (DIFC) Ltd | 0 | -100,00 | 0 | |||||
| 2026-02-11 | 13F | Simplex Trading, Llc | Call | 114.400 | 535,56 | 476 | ||||
| 2026-02-11 | 13F | Hilton Head Capital Partners, LLC | 800 | 3 | ||||||
| 2026-02-17 | 13F | Balyasny Asset Management Llc | 21.709 | 90 | ||||||
| 2026-02-09 | 13F | Jefferies Financial Group Inc. | 16.435 | -5,00 | 68 | -6,85 |
Other Listings
| DE:PHPN | 2,14 € |