Grundlæggende statistik
| Institutionelle aktier (lange) | 17.572.864 - 46,77% (ex 13D/G) - change of -7,38MM shares -29,23% MRQ |
| Institutionel værdi (lang) | $ 678.447 USD ($1000) |
Institutionelt ejerskab og aktionærer
German American Bancorp, Inc. (US:GABC) har 180 institutionelle ejere og aktionærer, der har indsendt 13D/G- eller 13F-formularer til Securities Exchange Commission (SEC). Disse institutioner har i alt 17,572,864 aktier. Største aktionærer omfatter BlackRock, Inc., Vanguard Group Inc, Franklin Resources Inc, Charles Schwab Investment Management Inc, Dimensional Fund Advisors Lp, Geode Capital Management, Llc, State Street Corp, Royce & Associates Lp, Raymond James Financial Inc, and Northern Trust Corp .
German American Bancorp, Inc. (NasdaqGS:GABC) institutionel ejerskabsstruktur viser aktuelle positioner i virksomheden efter institutioner og fonde, samt seneste ændringer i positionsstørrelse. Større aktionærer kan omfatte individuelle investorer, investeringsforeninger, hedgefonde eller institutioner. Skema 13D angiver, at investoren besidder (eller besidder) mere end 5 % af virksomheden og har til hensigt (eller har til hensigt at) aktivt at forfølge en ændring i forretningsstrategi. Skema 13G indikerer en passiv investering på over 5%.
The share price as of March 27, 2026 is 41,19 / share. Previously, on March 31, 2025, the share price was 37,50 / share. This represents an increase of 9,84% over that period.

Fondens stemningsscore
Fund Sentiment Score (fka Ownership Accumulation Score) finder de aktier, der bliver mest købt af fonde. Det er resultatet af en sofistikeret, multi-faktor kvantitativ model, der identificerer virksomheder med de højeste niveauer af institutionel akkumulering. Scoringsmodellen bruger en kombination af den samlede stigning i oplyste ejere, ændringerne i porteføljeallokeringer i disse ejere og andre målinger. Tallet går fra 0 til 100, hvor højere tal indikerer et højere niveau af akkumulering for sine jævnaldrende, og 50 er gennemsnittet.
Opdateringsfrekvens: Dagligt
Se Ownership Explorer, som giver en liste over højest rangerende virksomheder.
AI+ Ask Fintel’s AI assistant about German American Bancorp, Inc..
Select a question to share a public post with an AI-crafted answer.
Thinking of good questions…
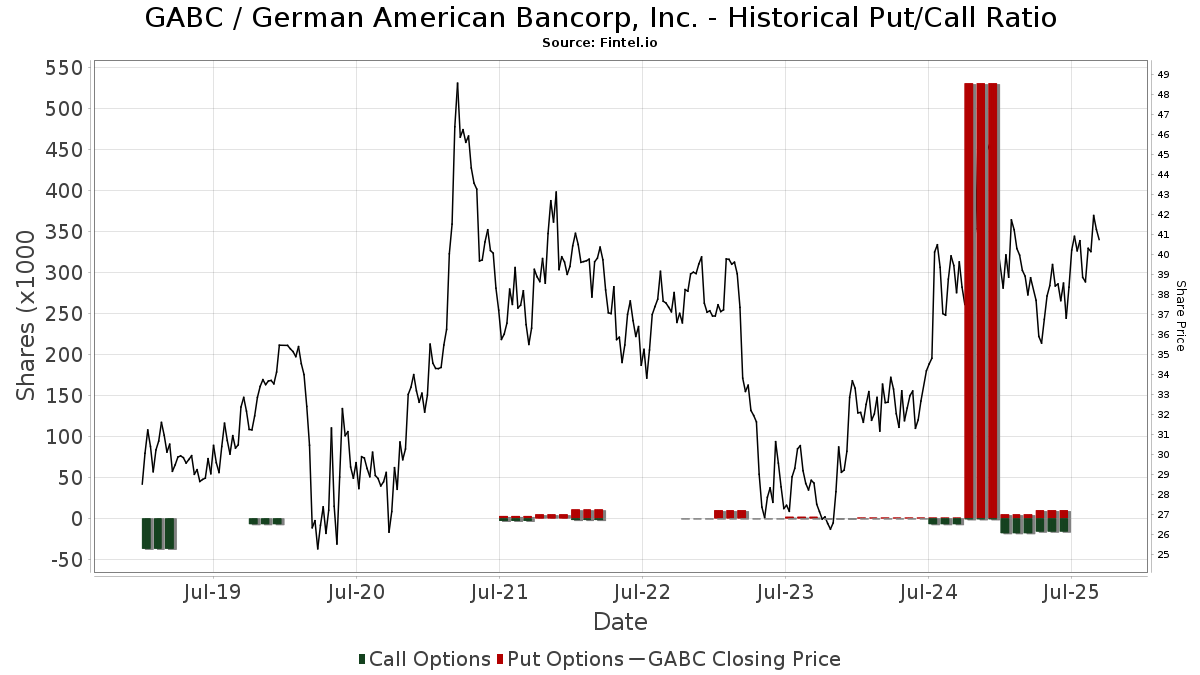
Institutionel Put/Call-forhold
Ud over at indberette standardaktie- og gældsudstedelser skal institutter med mere end 100 mill. aktiver under forvaltning også oplyse deres put- og call-optionsbeholdninger. Da salgsoptioner generelt indikerer negativ stemning, og købsoptioner indikerer positiv stemning, kan vi få en fornemmelse af den overordnede institutionelle stemning ved at plotte forholdet mellem put og kald. Diagrammet til højre viser det historiske put/call-forhold for dette instrument.
Brug af Put/Call Ratio som en indikator for investorernes stemning overvinder en af de vigtigste mangler ved at bruge totalt institutionelt ejerskab, som er, at en betydelig mængde af aktiver under forvaltning investeres passivt for at spore indekser. Passivt forvaltede fonde køber typisk ikke optioner, så indikatoren for put/call-forholdet følger mere nøje følelsen af aktivt forvaltede fonde.
13D/G-arkivering
Vi præsenterer 13D/G ansøgninger separat fra 13F ansøgninger på grund af den forskellige behandling af SEC. 13D/G-ansøgninger kan indgives af grupper af investorer (med én ledende), hvorimod 13F-ansøgninger ikke kan. Dette resulterer i situationer, hvor en investor kan indsende en 13D/G, der rapporterer én værdi for de samlede aktier (der repræsenterer alle de aktier, der ejes af investorgruppen), men derefter indsender en 13F, der rapporterer en anden værdi for de samlede aktier (der udelukkende repræsenterer deres egne) ejendomsret). Det betyder, at aktieejerskab af 13D/G-arkiver og 13F-arkiveringer ofte ikke er direkte sammenlignelige, så vi præsenterer dem separat.
Bemærk: Fra den 16. maj 2021 viser vi ikke længere ejere, der ikke har indsendt en 13D/G inden for det seneste år. Tidligere viste vi den fulde historie af 13D/G-arkiver. Generelt skal enheder, der er forpligtet til at indgive 13D/G-ansøgninger, indgive mindst årligt, før de indsender en afsluttende ansøgning. Dog forlader fonde nogle gange positioner uden at indsende en afsluttende ansøgning (dvs. de afvikler), så visning af den fulde historie resulterede nogle gange i forvirring om det nuværende ejerskab. For at undgå forvirring viser vi nu kun 'aktuelle' ejere - det vil sige - ejere, der har anmeldt inden for det seneste år.
Upgrade to unlock premium data.
| Fil dato | Form | Investor | Forrige Aktier |
Seneste Aktier |
Δ Aktier (Procent) |
Ejendomsret (Procent) |
Δ Ejerskab (Procent) |
|
|---|---|---|---|---|---|---|---|---|
| 2026-03-26 | VANGUARD GROUP INC | 1,689,061 | 0 | -100.00 | 0.00 | -100.00 | ||
| 2025-05-09 | FRANKLIN MUTUAL ADVISERS LLC | 1,688,375 | 1,766,274 | 4.61 | 4.70 | -17.54 | ||
| 2025-04-24 | BlackRock, Inc. | 2,439,527 | 2,420,398 | -0.78 | 6.50 | -20.73 |
13F og NPORT arkivering
Detaljer om 13F-arkivering er gratis. Detaljer om NP-ansøgninger kræver et premium-medlemskab. Grønne rækker angiver nye positioner. Røde rækker angiver lukkede positioner. Klik på linket ikon for at se den fulde transaktionshistorik.
Opgrader
for at låse premium-data op og eksportere til Excel ![]() .
.
| Fil dato | Kilde | Investor | Type | Gennemsnitlig pris (Øst) |
Aktier | Δ Aktier (%) |
Rapporteret Værdi ($1000) |
Δ Værdi (%) |
Port Alloc (%) |
|
|---|---|---|---|---|---|---|---|---|---|---|
| 2026-02-12 | 13F | BlackRock, Inc. | 2.728.984 | 0,83 | 106.922 | 0,59 | ||||
| 2026-02-13 | 13F | Victory Capital Management Inc | 20.000 | 0,00 | 784 | -0,25 | ||||
| 2026-02-10 | 13F | Intech Investment Management Llc | 14.100 | -9,45 | 552 | -9,66 | ||||
| 2026-02-13 | 13F | Ubs Asset Management Americas Inc | 65.451 | 6,72 | 2.564 | 6,48 | ||||
| 2026-02-17 | 13F | Susquehanna International Group, Llp | 14.125 | 34,68 | 553 | 34,55 | ||||
| 2026-02-12 | 13F | Jane Street Group, Llc | 0 | -100,00 | 0 | |||||
| 2026-02-17 | 13F | German American Bancorp, Inc. | 0 | -100,00 | 0 | |||||
| 2026-02-17 | 13F | Susquehanna International Group, Llp | Call | 9.100 | 357 | |||||
| 2026-02-13 | 13F | Champlain Investment Partners, LLC | 0 | -100,00 | 0 | |||||
| 2026-02-05 | 13F | Bessemer Group Inc | 21.420 | -4,08 | 1 | |||||
| 2026-02-13 | 13F | Manufacturers Life Insurance Company, The | 0 | -100,00 | 0 | |||||
| 2025-11-13 | 13F | Martingale Asset Management L P | 0 | -100,00 | 0 | |||||
| 2026-02-13 | 13F | Barclays Plc | 60.479 | -12,69 | 2.370 | -11,74 | ||||
| 2026-01-27 | 13F | Strategic Value Bank Partners LLC | 148.837 | 0,00 | 5.831 | -0,22 | ||||
| 2026-02-05 | 13F | Beese Fulmer Investment Management, Inc. | 0 | -100,00 | 0 | |||||
| 2026-02-11 | 13F | Picton Mahoney Asset Management | 29 | 0,00 | 1 | |||||
| 2026-02-17 | 13F | Aster Capital Management (DIFC) Ltd | 39 | -58,95 | 2 | -66,67 | ||||
| 2026-01-23 | 13F | State of Alaska, Department of Revenue | 1.499 | 0,00 | 0 | |||||
| 2026-02-03 | 13F | SBI Securities Co., Ltd. | 0 | -100,00 | 0 | |||||
| 2026-02-13 | 13F | Fort Point Capital Partners LLC | 5.000 | 203 | ||||||
| 2026-02-12 | 13F | Campbell & CO Investment Adviser LLC | 13.648 | 535 | ||||||
| 2026-02-10 | 13F/A | Northwestern Mutual Wealth Management Co | 5.427 | 2,34 | 213 | 1,92 | ||||
| 2026-02-17 | 13F | D. E. Shaw & Co., Inc. | 5.442 | 213 | ||||||
| 2026-02-10 | 13F | Godfrey Financial Associates, Inc. | 3 | 0 | ||||||
| 2026-02-13 | 13F | Citigroup Inc | 3.025 | 10,64 | 119 | 10,28 | ||||
| 2025-11-12 | 13F | Simplex Trading, Llc | Call | 0 | -100,00 | 0 | ||||
| 2026-02-10 | 13F | Bruce G. Allen Investments, LLC | 8 | 0 | ||||||
| 2026-02-13 | 13F | Y-Intercept (Hong Kong) Ltd | 13.954 | 547 | ||||||
| 2026-01-26 | 13F | KBC Group NV | 1.468 | 0,00 | 0 | |||||
| 2026-02-17 | 13F | California State Teachers Retirement System | 35.421 | -4,10 | 1.388 | -4,34 | ||||
| 2026-02-09 | 13F | MQS Management LLC | 0 | -100,00 | 0 | |||||
| 2026-01-29 | 13F | Comerica Bank | 13.124 | -2,59 | 514 | -2,84 | ||||
| 2026-02-09 | 13F | Hantz Financial Services, Inc. | 27.696 | -10,58 | 1 | 0,00 | ||||
| 2026-02-06 | 13F | ProShare Advisors LLC | 6.629 | 6,87 | 260 | 6,58 | ||||
| 2026-01-26 | 13F | Cwm, Llc | 10.165 | 151,61 | 0 | |||||
| 2026-01-15 | 13F | SILVER OAK SECURITIES, Inc | 734 | 0,00 | 29 | 3,57 | ||||
| 2026-01-16 | 13F | Ronald Blue Trust, Inc. | 246 | 0,41 | 10 | 0,00 | ||||
| 2026-02-11 | 13F | Franklin Resources Inc | 1.829.271 | -0,97 | 71.671 | -1,20 | ||||
| 2026-02-18 | 13F | Mackenzie Financial Corp | 0 | -100,00 | 0 | |||||
| 2026-02-13 | 13F | Quarry LP | 587 | 23 | ||||||
| 2026-02-12 | 13F | Swiss National Bank | 73.950 | 1,79 | 2.897 | 1,58 | ||||
| 2026-02-13 | 13F | De Lisle Partners LLP | 14.102 | 0,00 | 552 | -0,18 | ||||
| 2026-02-11 | 13F | Ameritas Investment Partners, Inc. | 3.031 | 119 | ||||||
| 2026-02-10 | 13F | Mutual Of America Capital Management Llc | 171.439 | -4,72 | 6.717 | -4,95 | ||||
| 2026-02-17 | 13F | Tower Research Capital LLC (TRC) | 464 | -68,80 | 18 | -68,97 | ||||
| 2025-10-09 | 13F | Kessler Investment Group, LLC | 0 | -100,00 | 0 | |||||
| 2026-02-11 | 13F | Rise Advisors, LLC | 0 | -100,00 | 0 | |||||
| 2026-01-21 | 13F | Kentucky Trust Co | 9.000 | 0,00 | 353 | -0,28 | ||||
| 2026-02-19 | 13F | Invesco Ltd. | 42.863 | -12,88 | 1.679 | -13,10 | ||||
| 2026-02-05 | 13F | John G Ullman & Associates Inc | 8.190 | 0,00 | 321 | -0,31 | ||||
| 2026-02-12 | 13F | MetLife Investment Management, LLC | 20.489 | -5,58 | 803 | -5,87 | ||||
| 2025-11-14 | 13F | Skopos Labs, Inc. | 0 | -100,00 | 0 | |||||
| 2026-01-05 | 13F | GAMMA Investing LLC | 237 | 1.085,00 | 9 | |||||
| 2025-11-14 | 13F | Susquehanna International Group, Llp | Put | 0 | -100,00 | 0 | -100,00 | |||
| 2026-02-17 | 13F | Engineers Gate Manager LP | 6.562 | 14,72 | 257 | 14,73 | ||||
| 2026-02-17 | 13F | Russell Investments Group, Ltd. | 225.351 | 3,07 | 8.829 | 2,83 | ||||
| 2026-01-28 | 13F | Field & Main Bank | 3.000 | 0,00 | 118 | 0,00 | ||||
| 2026-02-11 | 13F | Los Angeles Capital Management Llc | 70 | 3 | ||||||
| 2026-01-14 | 13F | Wedge Capital Management L L P/nc | 65.340 | -1,97 | 2.560 | -2,18 | ||||
| 2026-02-09 | 13F | Geode Capital Management, Llc | 914.637 | 0,05 | 35.842 | -0,17 | ||||
| 2026-02-13 | 13F | Colony Group, LLC | 182.986 | -0,32 | 7.169 | -1,51 | ||||
| 2026-01-27 | 13F | Zurcher Kantonalbank (Zurich Cantonalbank) | 10.398 | 20,95 | 407 | 20,77 | ||||
| 2026-02-13 | 13F | Great West Life Assurance Co /can/ | 2.803 | 0,00 | 0 | |||||
| 2026-01-21 | 13F | Indiana Trust & Investment Management CO | 1.728 | 0,00 | 68 | 0,00 | ||||
| 2026-02-13 | 13F | American Century Companies Inc | 90.562 | -2,71 | 3.548 | -2,93 | ||||
| 2026-02-17 | 13F | Raymond James Financial Inc | 468.972 | -1,96 | 18.374 | -2,18 | ||||
| 2026-01-08 | 13F | Wealth Enhancement Advisory Services, Llc | 23.490 | 0,30 | 933 | 2,41 | ||||
| 2026-02-20 | 13F | Sunbelt Securities, Inc. | 1 | 0 | ||||||
| 2026-02-12 | 13F | State Board Of Administration Of Florida Retirement System | 8.006 | 0,00 | 314 | -0,32 | ||||
| 2026-02-06 | 13F | Pnc Financial Services Group, Inc. | 24.175 | 0,02 | 947 | -0,21 | ||||
| 2026-02-06 | 13F | Covestor Ltd | 9 | -10,00 | 0 | |||||
| 2025-11-17 | 13F | GWM Advisors LLC | 0 | -100,00 | 0 | -100,00 | ||||
| 2026-02-12 | 13F | Commonwealth Equity Services, Llc | 12.759 | -0,51 | 500 | |||||
| 2026-01-30 | 13F | State of New Jersey Common Pension Fund D | 56.566 | 6,11 | 2.216 | 5,88 | ||||
| 2026-02-09 | 13F | Quest Partners LLC | 7.397 | -8,03 | 290 | -8,25 | ||||
| 2026-02-10 | 13F | Lido Advisors, LLC | 5.850 | 0,00 | 230 | 0,00 | ||||
| 2026-01-28 | 13F | Arizona State Retirement System | 10.474 | -5,29 | 410 | -5,53 | ||||
| 2026-02-02 | 13F | Fifth Third Bancorp | 2.531 | 0,00 | 99 | 0,00 | ||||
| 2026-02-10 | 13F | Bank of New York Mellon Corp | 209.984 | 4,84 | 8.227 | 4,60 | ||||
| 2026-02-13 | 13F | First Trust Advisors Lp | 49.252 | -39,02 | 1.930 | -39,17 | ||||
| 2026-02-13 | 13F | Marshall Wace, Llp | 115.941 | 36,96 | 4.543 | 36,64 | ||||
| 2026-01-07 | 13F | Massmutual Trust Co Fsb/adv | 32 | 0,00 | 1 | 0,00 | ||||
| 2026-02-13 | 13F | Parkside Financial Bank & Trust | 30 | 0,00 | 1 | 0,00 | ||||
| 2026-02-13 | 13F | Caitong International Asset Management Co., Ltd | 0 | -100,00 | 0 | |||||
| 2026-01-23 | 13F | Brown Miller Wealth Management, LLC | 34.369 | 0,00 | 1.347 | -0,22 | ||||
| 2026-02-04 | 13F | Swiss Life Asset Management Ltd | 5.163 | 202 | ||||||
| 2026-02-05 | 13F | Amalgamated Bank | 1.140 | 18,26 | 0 | |||||
| 2026-02-11 | 13F | Group One Trading, L.p. | Call | 0 | -100,00 | 0 | ||||
| 2026-02-12 | 13F | Pettinga Financial Advisors, LLC | 11.613 | 4,42 | 455 | 4,36 | ||||
| 2026-02-13 | 13F | Charles Schwab Investment Management Inc | 1.414.363 | 1,70 | 55.415 | 1,47 | ||||
| 2026-01-27 | 13F | Symmetry Partners, LLC | 8.660 | -12,21 | 339 | -12,40 | ||||
| 2026-02-13 | 13F | Police & Firemen's Retirement System of New Jersey | 10.061 | -0,12 | 394 | -0,25 | ||||
| 2026-02-17 | 13F | Optiver Holding B.V. | 130 | -49,61 | 5 | -50,00 | ||||
| 2026-02-13 | 13F | BNP Paribas Asset Management Holding S.A. | 212 | 7,07 | 0 | |||||
| 2026-02-17 | 13F | Advisor Group Holdings, Inc. | 10.392 | 0,04 | 407 | -5,57 | ||||
| 2026-02-13 | 13F | SRS Capital Advisors, Inc. | 386 | -58,67 | 15 | -58,33 | ||||
| 2026-02-11 | 13F | Cerity Partners LLC | 26.745 | 0,33 | 1.048 | 0,10 | ||||
| 2026-02-04 | 13F | Valeo Financial Advisors, LLC | 34.008 | -2,77 | 1.332 | -2,99 | ||||
| 2026-01-15 | 13F | Nisa Investment Advisors, Llc | 326 | 676,19 | 13 | 1.100,00 | ||||
| 2026-02-13 | 13F | State Street Corp | 910.749 | 0,11 | 35.683 | -0,12 | ||||
| 2025-10-30 | 13F | Teacher Retirement System Of Texas | 0 | -100,00 | 0 | |||||
| 2026-01-26 | 13F | Mirae Asset Global Investments Co., Ltd. | 33.895 | -3,07 | 1.328 | -3,28 | ||||
| 2026-02-13 | 13F | Cito Capital Group, LLC | 5.623 | 0,00 | 0 | |||||
| 2026-02-17 | 13F | Cetera Investment Advisers | 7.878 | 18,57 | 309 | 18,46 | ||||
| 2026-02-13 | 13F | FJ Capital Management LLC | 109.019 | -3,16 | 4.271 | -3,39 | ||||
| 2026-02-17 | 13F | VARCOV Co. | 6.503 | 255 | ||||||
| 2026-01-28 | 13F | Old National Bancorp /in/ | 6.192 | 243 | ||||||
| 2026-01-30 | 13F | Us Bancorp \de\ | 4.577 | -0,11 | 179 | 0,00 | ||||
| 2026-02-11 | 13F | MCF Advisors LLC | 178 | 0,00 | 7 | 0,00 | ||||
| 2026-01-28 | 13F | John W. Rosenthal Capital Management, Inc. | 58.199 | 0,00 | 2.280 | -0,22 | ||||
| 2026-02-17 | 13F | Susquehanna Fundamental Investments, Llc | 9.747 | 382 | ||||||
| 2026-02-17 | 13F | Qube Research & Technologies Ltd | 135.708 | 94,72 | 5.317 | 94,33 | ||||
| 2026-02-12 | 13F | Principal Securities, Inc. | 0 | -100,00 | 0 | -100,00 | ||||
| 2026-02-17 | 13F | Creative Planning | 41.085 | -2,60 | 1.610 | -2,84 | ||||
| 2026-01-23 | 13F | Farther Finance Advisors, LLC | 176 | 2.100,00 | 7 | |||||
| 2026-02-09 | 13F | Fisher Asset Management, LLC | 40.413 | -6,23 | 1.583 | -6,44 | ||||
| 2026-02-13 | 13F | Squarepoint Ops LLC | 5.121 | 201 | ||||||
| 2026-02-13 | 13F | Aptus Capital Advisors, LLC | 269.597 | 0,44 | 10.563 | 0,21 | ||||
| 2026-02-17 | 13F | Fmr Llc | 2.848 | 26,19 | 112 | 26,14 | ||||
| 2026-02-12 | 13F | Voya Investment Management Llc | 7.155 | 0,00 | 280 | 0,00 | ||||
| 2026-01-23 | 13F | Private Wealth Management Group, LLC | 48 | 0,00 | 2 | 0,00 | ||||
| 2026-01-07 | 13F | Everhart Financial Group, Inc. | 11.882 | -0,27 | 466 | -0,43 | ||||
| 2026-02-17 | 13F | PharVision Advisers, LLC | 8.678 | 340 | ||||||
| 2026-01-29 | 13F | UBS Group AG | 48.250 | 0,41 | 1.890 | 0,16 | ||||
| 2026-02-10 | 13F | Goldman Sachs Group Inc | 173.231 | 155,67 | 6.787 | 155,15 | ||||
| 2025-10-24 | 13F | We Are One Seven, LLC | 0 | -100,00 | 0 | -100,00 | ||||
| 2026-02-17 | 13F | Atom Investors LP | 14.468 | 567 | ||||||
| 2026-01-29 | 13F | Pictet Asset Management Holding SA | 5.409 | 0,00 | 212 | -0,47 | ||||
| 2026-02-17 | 13F | Alliancebernstein L.p. | 198.271 | -7,47 | 7.768 | -7,68 | ||||
| 2026-02-17 | 13F | Royal Bank Of Canada | 3.919 | -8,99 | 153 | -9,47 | ||||
| 2026-02-17 | 13F | Bank Of America Corp /de/ | 52.425 | 66,25 | 2.054 | 65,91 | ||||
| 2026-01-09 | 13F | Diversified Trust Co | 16.464 | 12,66 | 645 | 12,57 | ||||
| 2026-02-12 | 13F | Renaissance Technologies Llc | 94.749 | 100,53 | 3.712 | 100,11 | ||||
| 2026-02-13 | 13F | Timucuan Asset Management Inc/fl | 15.000 | 0,00 | 588 | -0,34 | ||||
| 2026-02-17 | 13F | Tudor Investment Corp Et Al | 60.070 | 2.354 | ||||||
| 2025-11-04 | 13F | L.m. Kohn & Company | 0 | -100,00 | 0 | |||||
| 2026-02-10 | 13F | Envestnet Asset Management Inc | 5.337 | -2,40 | 209 | -2,34 | ||||
| 2026-02-10 | 13F | Bnp Paribas Arbitrage, Sa | 8.014 | 6,82 | 314 | 6,46 | ||||
| 2026-02-12 | 13F | Quadrant Capital Group Llc | 1.765 | -3,45 | 69 | -2,82 | ||||
| 2026-02-13 | 13F | Johnson Investment Counsel Inc | 0 | -100,00 | 0 | |||||
| 2026-01-14 | 13F | Chatham Capital Group, Inc. | 52.401 | 1,39 | 2.053 | 1,18 | ||||
| 2026-02-11 | 13F | Jpmorgan Chase & Co | 32.548 | 0,22 | 1.275 | 0,00 | ||||
| 2026-01-23 | 13F | TFC Financial Management | 1 | 0 | ||||||
| 2026-02-02 | 13F | Danske Bank A/s | 100 | 0,00 | 4 | 0,00 | ||||
| 2026-01-20 | 13F | Independence Bank of Kentucky | 1.500 | 0,00 | 59 | 0,00 | ||||
| 2026-02-17 | 13F | Two Sigma Advisers, Lp | 46.500 | 69,71 | 1.822 | 69,40 | ||||
| 2026-02-12 | 13F | Dimensional Fund Advisors Lp | 1.188.331 | 0,60 | 46.560 | 0,38 | ||||
| 2026-02-13 | 13F | Arrowstreet Capital, Limited Partnership | 23.630 | 0,00 | 926 | -0,22 | ||||
| 2026-01-08 | 13F | Versant Capital Management, Inc | 531 | 74,67 | 21 | 81,82 | ||||
| 2026-02-11 | 13F | Meeder Advisory Services, Inc. | 19.080 | 748 | ||||||
| 2026-02-17 | 13F | Northern Trust Corp | 308.974 | -6,43 | 12.106 | -6,65 | ||||
| 2026-02-12 | 13F | CIBC Private Wealth Group, LLC | 326 | 0,00 | 13 | 0,00 | ||||
| 2026-02-17 | 13F | Millennium Management Llc | 13.125 | -49,41 | 514 | -49,51 | ||||
| 2026-02-17 | 13F | Aqr Capital Management Llc | 32.182 | 18,13 | 1.261 | 17,87 | ||||
| 2026-02-17 | 13F | Quantinno Capital Management LP | 10.755 | 88,42 | 421 | 87,95 | ||||
| 2026-02-17 | 13F | Janus Henderson Group Plc | 15.347 | 0,00 | 601 | -0,33 | ||||
| 2026-01-23 | 13F | Deprince Race & Zollo Inc | 202.901 | 25,52 | 7.950 | 25,22 | ||||
| 2026-02-13 | 13F | Smartleaf Asset Management LLC | 304 | 0,00 | 12 | 9,09 | ||||
| 2026-02-12 | 13F | New York State Common Retirement Fund | 12.587 | 0,00 | 493 | -0,20 | ||||
| 2025-11-06 | 13F | Ameritas Advisory Services, LLC | 0 | -100,00 | 0 | |||||
| 2026-02-17 | 13F | Price T Rowe Associates Inc /md/ | 46.675 | 9,44 | 2 | 0,00 | ||||
| 2026-02-17 | 13F | Point72 Asset Management, L.P. | 7.623 | 299 | ||||||
| 2026-02-13 | 13F | Fiduciary Trust Co | 6.754 | 20,59 | 265 | 20,55 | ||||
| 2026-02-14 | 13F | Rockefeller Capital Management L.P. | 37 | 1 | ||||||
| 2026-02-05 | 13F | Allworth Financial LP | 2.702 | 0,07 | 106 | -0,94 | ||||
| 2026-01-20 | 13F | Savvy Advisors, Inc. | 6.958 | 0,00 | 273 | -0,37 | ||||
| 2026-01-30 | 13F | CFC Planning Co LLC | 18.931 | 0,00 | 742 | -0,27 | ||||
| 2026-02-13 | 13F | Wells Fargo & Company/mn | 65.202 | 24,57 | 2.555 | 24,28 | ||||
| 2026-01-29 | 13F | Vanguard Group Inc | 2.281.704 | 4,12 | 89.397 | 3,88 | ||||
| 2026-02-10 | 13F | Quantbot Technologies LP | 0 | -100,00 | 0 | |||||
| 2026-02-17 | 13F | MIRAE ASSET GLOBAL ETFS HOLDINGS Ltd. | 16.851 | -0,01 | 660 | -0,15 | ||||
| 2026-01-13 | 13F | First Financial Corp /in/ | 2.863 | 0,00 | 112 | 0,00 | ||||
| 2026-01-28 | 13F | Klp Kapitalforvaltning As | 8.000 | 0,00 | 313 | -0,32 | ||||
| 2025-11-12 | 13F | LPL Financial LLC | 0 | -100,00 | 0 | |||||
| 2026-02-13 | 13F | Sterling Capital Management LLC | 2.091 | -16,76 | 82 | -17,35 | ||||
| 2026-02-13 | 13F | Sei Investments Co | 34.252 | 1.342 | ||||||
| 2026-01-29 | 13F | UMA Financial Services, Inc. | 23 | 0,00 | 1 | |||||
| 2026-02-06 | 13F | Gsa Capital Partners Llp | 0 | -100,00 | 0 | |||||
| 2026-02-13 | 13F | MAI Capital Management | 1.900 | -17,39 | 74 | -17,78 | ||||
| 2026-02-06 | 13F | EverSource Wealth Advisors, LLC | 192 | -44,83 | 8 | -46,15 | ||||
| 2026-02-11 | 13F | SOUTH STATE Corp | 290 | -61,02 | 11 | -62,07 | ||||
| 2026-02-13 | 13F | Kestra Advisory Services, LLC | 3.317 | 130 | ||||||
| 2026-02-13 | 13F | Morgan Stanley | 203.849 | 19,42 | 7.987 | 19,14 | ||||
| 2026-02-06 | 13F | Larson Financial Group LLC | 288 | 0,00 | 11 | 0,00 | ||||
| 2026-02-12 | 13F | Nuveen, LLC | 69.096 | -0,47 | 2.707 | -0,70 | ||||
| 2026-01-20 | 13F | Signaturefd, Llc | 158 | 41,07 | 6 | 50,00 | ||||
| 2026-02-17 | 13F | Ameriprise Financial Inc | 13.524 | 1,15 | 530 | 0,76 | ||||
| 2026-01-08 | 13F | True Wealth Design, LLC | 14 | 75,00 | 1 | |||||
| 2026-02-09 | 13F | Wealthquest Corp | 19.597 | 0,00 | 768 | -0,26 | ||||
| 2026-02-18 | 13F | Onyx Bridge Wealth Group LLC | 0 | -100,00 | 0 | |||||
| 2026-02-17 | 13F | Two Sigma Investments, Lp | 143.412 | 41,06 | 5.619 | 40,73 | ||||
| 2026-02-09 | 13F | Glenview Trust Co | 7.633 | 10,10 | 299 | 9,93 | ||||
| 2026-02-11 | 13F | Parallel Advisors, LLC | 420 | 0,00 | 16 | 0,00 | ||||
| 2026-02-17 | 13F | Jones Financial Companies Lllp | 480 | 26,32 | 19 | 20,00 | ||||
| 2026-02-17 | 13F | Advisory Services Network, LLC | 0 | -100,00 | 0 | |||||
| 2025-11-04 | 13F | Principal Financial Group Inc | 0 | -100,00 | 0 | |||||
| 2026-01-09 | 13F | SG Americas Securities, LLC | 127.172 | 5 | ||||||
| 2026-02-13 | 13F | Rhumbline Advisers | 45.454 | -12,39 | 1.781 | -12,62 | ||||
| 2026-02-06 | 13F | IFP Advisors, Inc | 26 | 0,00 | 1 | 0,00 | ||||
| 2026-02-09 | 13F | Legal & General Group Plc | 40.758 | -0,11 | 1.597 | -0,37 | ||||
| 2026-02-10 | 13F | Rothschild Investment Llc | 27 | 35,00 | 1 | |||||
| 2026-02-13 | 13F | Stifel Financial Corp | 7.690 | 0,56 | 301 | 0,33 | ||||
| 2026-02-13 | 13F | Baird Financial Group, Inc. | 32.897 | -0,48 | 1.289 | -0,77 | ||||
| 2026-02-13 | 13F | Public Employees Retirement Association Of Colorado | 9.671 | 0,00 | 0 | |||||
| 2026-02-09 | 13F | Huntington National Bank | 77 | 0,00 | 3 | 0,00 | ||||
| 2026-02-17 | 13F | Citadel Advisors Llc | 22.901 | 110,60 | 897 | 110,07 | ||||
| 2026-02-11 | 13F | Deutsche Bank Ag\ | 32.890 | 6,26 | 1.289 | 6,01 | ||||
| 2026-01-23 | 13F | Avion Wealth | 17 | 0,00 | 0 | |||||
| 2026-02-09 | 13F | Royce & Associates Lp | 507.632 | 3,96 | 19.889 | 3,72 | ||||
| 2025-11-14 | 13F | ExodusPoint Capital Management, LP | 0 | -100,00 | 0 |
Other Listings
| DE:GAB | 34,20 € |