Grundlæggende statistik
| Institutionelle ejere | 124 total, 124 long only, 0 short only, 0 long/short - change of 0,81% MRQ |
| Gennemsnitlig porteføljeallokering | 0.0525 % - change of 2,17% MRQ |
| Institutionelle aktier (lange) | 2.708.003 (ex 13D/G) - change of 0,30MM shares 12,32% MRQ |
| Institutionel værdi (lang) | $ 160.006 USD ($1000) |
Institutionelt ejerskab og aktionærer
First Trust Exchange-Traded AlphaDEX Fund - First Trust Consumer Staples AlphaDEX Fund (US:FXG) har 124 institutionelle ejere og aktionærer, der har indsendt 13D/G- eller 13F-formularer til Securities Exchange Commission (SEC). Disse institutioner har i alt 2,708,003 aktier. Største aktionærer omfatter Morgan Stanley, LPL Financial LLC, Vestmark Advisory Solutions, Inc., Raymond James Financial Inc, Wells Fargo & Company/mn, Bank Of America Corp /de/, Independent Advisor Alliance, Commonwealth Equity Services, Llc, Stifel Financial Corp, and Citigroup Inc .
First Trust Exchange-Traded AlphaDEX Fund - First Trust Consumer Staples AlphaDEX Fund (ARCA:FXG) institutionel ejerskabsstruktur viser aktuelle positioner i virksomheden efter institutioner og fonde, samt seneste ændringer i positionsstørrelse. Større aktionærer kan omfatte individuelle investorer, investeringsforeninger, hedgefonde eller institutioner. Skema 13D angiver, at investoren besidder (eller besidder) mere end 5 % af virksomheden og har til hensigt (eller har til hensigt at) aktivt at forfølge en ændring i forretningsstrategi. Skema 13G indikerer en passiv investering på over 5%.
The share price as of September 18, 2025 is 63,07 / share. Previously, on September 19, 2024, the share price was 68,17 / share. This represents a decline of 7,48% over that period.

Fondens stemningsscore
Fund Sentiment Score (fka Ownership Accumulation Score) finder de aktier, der bliver mest købt af fonde. Det er resultatet af en sofistikeret, multi-faktor kvantitativ model, der identificerer virksomheder med de højeste niveauer af institutionel akkumulering. Scoringsmodellen bruger en kombination af den samlede stigning i oplyste ejere, ændringerne i porteføljeallokeringer i disse ejere og andre målinger. Tallet går fra 0 til 100, hvor højere tal indikerer et højere niveau af akkumulering for sine jævnaldrende, og 50 er gennemsnittet.
Opdateringsfrekvens: Dagligt
Se Ownership Explorer, som giver en liste over højest rangerende virksomheder.
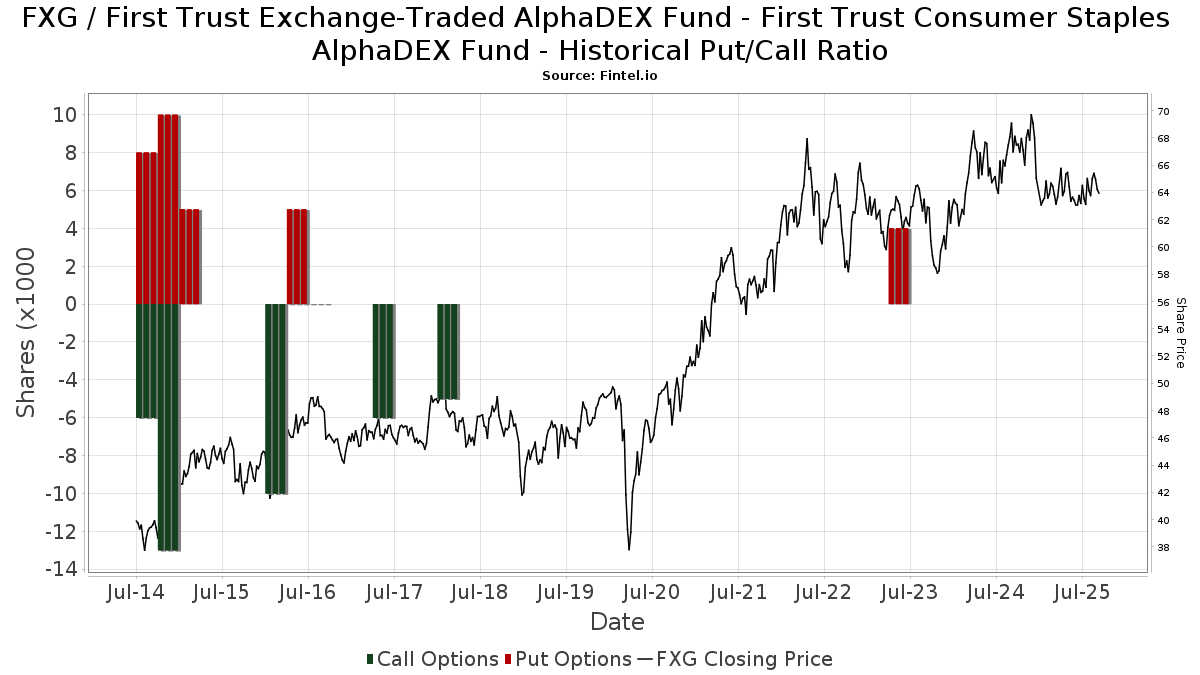
Institutionel Put/Call-forhold
Ud over at indberette standardaktie- og gældsudstedelser skal institutter med mere end 100 mill. aktiver under forvaltning også oplyse deres put- og call-optionsbeholdninger. Da salgsoptioner generelt indikerer negativ stemning, og købsoptioner indikerer positiv stemning, kan vi få en fornemmelse af den overordnede institutionelle stemning ved at plotte forholdet mellem put og kald. Diagrammet til højre viser det historiske put/call-forhold for dette instrument.
Brug af Put/Call Ratio som en indikator for investorernes stemning overvinder en af de vigtigste mangler ved at bruge totalt institutionelt ejerskab, som er, at en betydelig mængde af aktiver under forvaltning investeres passivt for at spore indekser. Passivt forvaltede fonde køber typisk ikke optioner, så indikatoren for put/call-forholdet følger mere nøje følelsen af aktivt forvaltede fonde.
13F og NPORT arkivering
Detaljer om 13F-arkivering er gratis. Detaljer om NP-ansøgninger kræver et premium-medlemskab. Grønne rækker angiver nye positioner. Røde rækker angiver lukkede positioner. Klik på linket ikon for at se den fulde transaktionshistorik.
Opgrader
for at låse premium-data op og eksportere til Excel ![]() .
.
| Fil dato | Kilde | Investor | Type | Gennemsnitlig pris (Øst) |
Aktier | Δ Aktier (%) |
Rapporteret Værdi ($1000) |
Δ Værdi (%) |
Port Alloc (%) |
|
|---|---|---|---|---|---|---|---|---|---|---|
| 2025-07-22 | 13F | Grimes & Company, Inc. | 22.562 | 1.428 | ||||||
| 2025-07-07 | 13F | Nova Wealth Management, Inc. | 9.810 | -10,14 | 621 | -13,04 | ||||
| 2025-08-04 | 13F | Creekmur Asset Management LLC | 30 | 0,00 | 2 | 0,00 | ||||
| 2025-08-12 | 13F | Park Square Financial Group, LLC | 591 | -2,15 | 37 | -5,13 | ||||
| 2025-07-25 | 13F | Stephens Consulting, LLC | 259 | 0,78 | 16 | 0,00 | ||||
| 2025-04-16 | 13F | Wealth Enhancement Advisory Services, Llc | 0 | -100,00 | 0 | -100,00 | ||||
| 2025-08-14 | 13F | Citadel Advisors Llc | 14.123 | -43,50 | 894 | -45,32 | ||||
| 2025-08-08 | 13F | Capital Investment Advisory Services, LLC | 251 | 0,00 | 16 | -6,25 | ||||
| 2025-08-14 | 13F | LaSalle St. Investment Advisors, LLC | 0 | -100,00 | 0 | |||||
| 2025-07-08 | 13F | Nbc Securities, Inc. | 1.255 | 0,72 | 0 | |||||
| 2025-07-15 | 13F | MCF Advisors LLC | 240 | 0,00 | 15 | 0,00 | ||||
| 2025-08-11 | 13F | Aptus Capital Advisors, LLC | 60 | 4 | ||||||
| 2025-05-12 | 13F | Aveo Capital Partners, LLC | 0 | -100,00 | 0 | |||||
| 2025-09-11 | 13F | Milestones Private Investment Advisors LLC | 49.598 | 3.139 | ||||||
| 2025-05-12 | 13F | Atlas Capital Advisors Llc | 0 | -100,00 | 0 | -100,00 | ||||
| 2025-07-28 | 13F | Harbour Investments, Inc. | 20.030 | -2,06 | 1.268 | -5,16 | ||||
| 2025-08-12 | 13F | Cornerstone Wealth Management, LLC | 3.665 | 0,08 | 232 | -3,35 | ||||
| 2025-08-04 | 13F | Spire Wealth Management | 4.473 | -74,96 | 283 | -75,75 | ||||
| 2025-08-08 | 13F | Creative Planning | 31.397 | -8,33 | 1.987 | -11,22 | ||||
| 2025-05-05 | 13F | Csenge Advisory Group | 0 | -100,00 | 0 | -100,00 | ||||
| 2025-07-17 | 13F | DiNuzzo Private Wealth, Inc. | 76 | 0,00 | 5 | 0,00 | ||||
| 2025-08-12 | 13F | LPL Financial LLC | 284.445 | -1,16 | 18.000 | -4,28 | ||||
| 2025-07-23 | 13F | Madden Advisory Services, Inc. | 6.656 | 0,00 | 421 | -3,00 | ||||
| 2025-07-09 | 13F | Bank of New Hampshire | 0 | -100,00 | 0 | |||||
| 2025-08-08 | 13F | Gts Securities Llc | 51.809 | 43,88 | 3.278 | 39,37 | ||||
| 2025-08-14 | 13F | Bank Of America Corp /de/ | 81.528 | -27,92 | 5.159 | -30,19 | ||||
| 2025-07-31 | 13F | Topsail Wealth Management, LLC | 135 | 0,00 | 9 | 0,00 | ||||
| 2025-08-19 | 13F | Advisory Services Network, LLC | 0 | -100,00 | 0 | |||||
| 2025-07-24 | 13F | IFP Advisors, Inc | 4.154 | -3,66 | 263 | -6,76 | ||||
| 2025-04-29 | 13F | Harel Insurance Investments & Financial Services Ltd. | 0 | -100,00 | 0 | |||||
| 2025-08-12 | 13F | Howe & Rusling Inc | 1.907 | -3,88 | 121 | -6,98 | ||||
| 2025-08-11 | 13F | Citigroup Inc | 57.284 | 1,56 | 3.625 | -1,66 | ||||
| 2025-08-12 | 13F | Global Retirement Partners, LLC | 2.640 | -23,54 | 167 | -24,43 | ||||
| 2025-08-06 | 13F | Commonwealth Equity Services, Llc | 68.709 | 121,30 | 4 | 100,00 | ||||
| 2025-08-13 | 13F | Green Harvest Asset Management LLC | 30.557 | -0,81 | 1.934 | -3,93 | ||||
| 2025-05-08 | 13F | Us Bancorp \de\ | 0 | -100,00 | 0 | |||||
| 2025-08-11 | 13F | Principal Securities, Inc. | 389 | 0,00 | 25 | 0,00 | ||||
| 2025-07-21 | 13F | Ameritas Advisory Services, LLC | 2.437 | -55,76 | 154 | -56,37 | ||||
| 2025-08-12 | 13F | BlackRock, Inc. | 274 | 0,00 | 17 | 0,00 | ||||
| 2025-08-15 | 13F | Tower Research Capital LLC (TRC) | 11.616 | 72,11 | 735 | 67,05 | ||||
| 2025-08-14 | 13F | MGB Wealth Management, LLC | 555 | 0,00 | 35 | -2,78 | ||||
| 2025-08-12 | 13F | Tableaux Llc | 2.634 | 222 | ||||||
| 2025-04-10 | 13F | Key Client Fiduciary Advisors, LLC | 0 | -100,00 | 0 | |||||
| 2025-08-13 | 13F | Northwestern Mutual Wealth Management Co | 1.844 | 5,19 | 117 | 1,75 | ||||
| 2025-07-31 | 13F | Moloney Securities Asset Management, LLC | 6.023 | -24,24 | 381 | -26,59 | ||||
| 2025-07-18 | 13F | Founders Capital Management | 3 | 0,00 | 0 | |||||
| 2025-08-04 | 13F | Assetmark, Inc | 95 | 0,00 | 6 | 0,00 | ||||
| 2025-08-13 | 13F | Flow Traders U.s. Llc | 0 | -100,00 | 0 | |||||
| 2025-07-16 | 13F/A | CX Institutional | 670 | -95,57 | 0 | |||||
| 2025-08-13 | 13F | Virtue Capital Management, LLC | 0 | -100,00 | 0 | |||||
| 2025-07-18 | 13F | Truist Financial Corp | 17.406 | 0,75 | 1.101 | -2,39 | ||||
| 2025-08-06 | 13F | AE Wealth Management LLC | 270 | -6,90 | 17 | -5,56 | ||||
| 2025-07-17 | 13F | Beacon Capital Management, LLC | 0 | -100,00 | 0 | |||||
| 2025-07-29 | 13F | Signature Estate & Investment Advisors Llc | 27.239 | -0,93 | 1.724 | -4,06 | ||||
| 2025-08-14 | 13F | Comerica Bank | 2.980 | 0,88 | 189 | -2,59 | ||||
| 2025-08-06 | 13F | Vestmark Advisory Solutions, Inc. | 197.464 | 12.496 | ||||||
| 2025-08-14 | 13F | Raymond James Financial Inc | 172.990 | -0,76 | 10.947 | -3,90 | ||||
| 2025-07-17 | 13F | Janney Montgomery Scott LLC | 34.060 | -3,07 | 2 | 0,00 | ||||
| 2025-08-01 | 13F | Envestnet Asset Management Inc | 35.746 | 217,01 | 2.262 | 207,34 | ||||
| 2025-08-14 | 13F | Wells Fargo & Company/mn | 161.518 | -0,12 | 10.221 | -3,27 | ||||
| 2025-07-31 | 13F | City State Bank | 1.000 | -48,59 | 63 | -50,39 | ||||
| 2025-08-13 | 13F | Jones Financial Companies Lllp | 3.762 | -9,31 | 237 | -11,94 | ||||
| 2025-08-12 | 13F | Founders Financial Alliance, LLC | 0 | -100,00 | 0 | |||||
| 2025-08-18 | 13F | Geneos Wealth Management Inc. | 3.690 | 200,00 | 234 | 191,25 | ||||
| 2025-07-11 | 13F | Farther Finance Advisors, LLC | 9.134 | -8,26 | 578 | -11,62 | ||||
| 2025-08-15 | 13F | Global View Capital Management LLC | 5.408 | 51,44 | 342 | 46,78 | ||||
| 2025-08-12 | 13F | SRS Capital Advisors, Inc. | 347 | 132,89 | 22 | 133,33 | ||||
| 2025-08-15 | 13F | Semmax Financial Advisors Inc. | 150 | 10 | ||||||
| 2025-07-02 | 13F | HBW Advisory Services LLC | 7.010 | 12,90 | 444 | 9,38 | ||||
| 2025-08-04 | 13F | Pensionmark Financial Group, Llc | 4.198 | 0,07 | 266 | -3,28 | ||||
| 2025-07-25 | 13F | We Are One Seven, LLC | 7.903 | 0,83 | 500 | -2,34 | ||||
| 2025-08-14 | 13F | Goldman Sachs Group Inc | 13.358 | -73,86 | 845 | -74,69 | ||||
| 2025-07-23 | 13F | Trueblood Wealth Management, LLC | 8.586 | -0,31 | 543 | -3,38 | ||||
| 2025-04-23 | 13F | Mascagni Wealth Management, Inc. | 0 | -100,00 | 0 | -100,00 | ||||
| 2025-07-25 | 13F | Atria Wealth Solutions, Inc. | 8.333 | -3,42 | 536 | -4,80 | ||||
| 2025-08-13 | 13F | Transce3nd, LLC | 79 | -30,09 | 5 | -42,86 | ||||
| 2025-08-14 | 13F | Jane Street Group, Llc | 6.725 | 426 | ||||||
| 2025-08-14 | 13F | Royal Bank Of Canada | 55.844 | -5,48 | 3.534 | -8,45 | ||||
| 2025-09-04 | 13F/A | Advisor Group Holdings, Inc. | 26.438 | 14,83 | 1.673 | 11,24 | ||||
| 2025-08-15 | 13F | Morgan Stanley | 559.568 | 64,82 | 35.410 | 59,63 | ||||
| 2025-07-23 | 13F | High Note Wealth, LLC | 49 | -50,00 | 3 | -50,00 | ||||
| 2025-08-13 | 13F | Gateway Wealth Partners, LLC | 4.737 | 300 | ||||||
| 2025-04-21 | 13F | PSI Advisors, LLC | 0 | -100,00 | 0 | |||||
| 2025-08-12 | 13F | Proequities, Inc. | 0 | 0 | ||||||
| 2025-08-13 | 13F | Russell Investments Group, Ltd. | 20 | 0,00 | 1 | 0,00 | ||||
| 2025-08-07 | 13F | Allworth Financial LP | 123 | 0,82 | 8 | 0,00 | ||||
| 2025-08-13 | 13F/A | StoneX Group Inc. | 3.865 | -10,16 | 244 | -6,18 | ||||
| 2025-08-05 | 13F | Westside Investment Management, Inc. | 127 | 0,00 | 8 | 0,00 | ||||
| 2025-08-14 | 13F | Gotham Asset Management, LLC | 4.356 | 0,00 | 276 | -3,17 | ||||
| 2025-08-12 | 13F | O'shaughnessy Asset Management, Llc | 96 | 0,00 | 6 | 0,00 | ||||
| 2025-08-06 | 13F | Stonebridge Financial Planning Group, LLC | 5.660 | 0,00 | 358 | -2,98 | ||||
| 2025-08-12 | 13F | MAI Capital Management | 1.831 | 0,00 | 116 | -3,36 | ||||
| 2025-08-11 | 13F | HighTower Advisors, LLC | 10.417 | -7,12 | 659 | -9,97 | ||||
| 2025-07-14 | 13F | AdvisorNet Financial, Inc | 0 | -100,00 | 0 | |||||
| 2025-08-05 | 13F | Sigma Planning Corp | 8.180 | -3,64 | 518 | -6,68 | ||||
| 2025-08-14 | 13F | Warren Averett Asset Management, LLC | 8.162 | -14,64 | 517 | -17,31 | ||||
| 2025-08-12 | 13F | Jpmorgan Chase & Co | 12.710 | -2,12 | 804 | -5,19 | ||||
| 2025-07-21 | 13F | DHJJ Financial Advisors, Ltd. | 1.778 | 0,00 | 113 | -3,45 | ||||
| 2025-08-14 | 13F | Fmr Llc | 1.970 | -8,03 | 125 | -10,79 | ||||
| 2025-08-14 | 13F | CoreCap Advisors, LLC | 1.468 | 0,00 | 93 | -3,16 | ||||
| 2025-08-14 | 13F | GWM Advisors LLC | 4.375 | -42,56 | 277 | -44,47 | ||||
| 2025-08-14 | 13F | Benjamin Edwards Inc | 13.120 | 830 | ||||||
| 2025-08-11 | 13F | Independent Advisor Alliance | 68.781 | 10,30 | 4.352 | 6,82 | ||||
| 2025-08-11 | 13F | Private Advisor Group, LLC | 8.929 | 4,21 | 565 | 1,07 | ||||
| 2025-05-14 | 13F | Van Hulzen Asset Management, LLC | 0 | -100,00 | 0 | |||||
| 2025-08-06 | 13F | First Horizon Advisors, Inc. | 542 | 0,00 | 34 | -2,86 | ||||
| 2025-07-30 | 13F | Rehmann Capital Advisory Group | 5.429 | -21,75 | 344 | -24,28 | ||||
| 2025-08-14 | 13F | UBS Group AG | 19.285 | -63,37 | 1.220 | -64,52 | ||||
| 2025-08-11 | 13F | Regal Investment Advisors LLC | 17.239 | 0,00 | 1.091 | -3,20 | ||||
| 2025-08-14 | 13F | Susquehanna International Group, Llp | 44.038 | 12,76 | 2.787 | 9,21 | ||||
| 2025-07-22 | 13F | Belpointe Asset Management LLC | 9.770 | -2,25 | 618 | -5,36 | ||||
| 2025-08-07 | 13F | Winch Advisory Services, LLC | 218 | 0,46 | 14 | -7,14 | ||||
| 2025-08-08 | 13F | Pnc Financial Services Group, Inc. | 2.031 | 0,05 | 129 | -3,03 | ||||
| 2025-08-12 | 13F | Steward Partners Investment Advisory, Llc | 14.679 | 86,76 | 929 | 80,90 | ||||
| 2025-07-14 | 13F | Park Avenue Securities Llc | 3.269 | 0 | ||||||
| 2025-08-08 | 13F | Meridian Wealth Management, LLC | 11.049 | 0,00 | 699 | -3,05 | ||||
| 2025-08-13 | 13F | Proactive Wealth Strategies LLC | 8.658 | -0,03 | 1 | |||||
| 2025-07-24 | 13F | Ronald Blue Trust, Inc. | 160 | 1,27 | 10 | 0,00 | ||||
| 2025-07-23 | 13F | Bellevue Asset Management, Llc | 1.895 | 0,16 | 120 | -3,25 | ||||
| 2025-08-14 | 13F | Sunbelt Securities, Inc. | 95 | 6 | ||||||
| 2025-07-16 | 13F | Signaturefd, Llc | 274 | 0,00 | 17 | 0,00 | ||||
| 2025-07-31 | 13F | Cambridge Investment Research Advisors, Inc. | 40.960 | 23,31 | 3 | 0,00 | ||||
| 2025-08-20 | 13F/A | Coppell Advisory Solutions LLC | 5.400 | -0,46 | 340 | -3,68 | ||||
| 2025-08-15 | 13F | Kestra Advisory Services, LLC | 15.315 | 2,94 | 969 | -0,31 | ||||
| 2025-07-29 | 13F | International Assets Investment Management, Llc | 4.424 | 0,00 | 280 | -3,46 | ||||
| 2025-08-13 | 13F | Twin Peaks Wealth Advisors, LLC | 1 | 0 | ||||||
| 2025-08-14 | 13F/A | Rockefeller Capital Management L.P. | 27.089 | 0,71 | 1.714 | -2,45 | ||||
| 2025-07-30 | 13F | Pacific Sun Financial Corp | 12.918 | -0,84 | 817 | -4,00 | ||||
| 2025-08-15 | 13F | Equitable Holdings, Inc. | 0 | -100,00 | 0 | |||||
| 2025-08-08 | 13F | Cetera Investment Advisers | 29.592 | 12,86 | 1.873 | 9,28 | ||||
| 2025-08-14 | 13F | Mml Investors Services, Llc | 20.998 | 86,30 | 1 | |||||
| 2025-05-06 | 13F | Navellier & Associates Inc | 0 | -100,00 | 0 | -100,00 | ||||
| 2025-07-28 | 13F | Copia Wealth Management | 158 | 0,00 | 10 | -10,00 | ||||
| 2025-08-11 | 13F | Western Wealth Management, LLC | 4.299 | -0,14 | 272 | -3,20 | ||||
| 2025-08-14 | 13F | Stifel Financial Corp | 64.243 | 19,15 | 4.065 | 15,42 | ||||
| 2025-08-04 | 13F | Creative Financial Designs Inc /adv | 240 | 0,84 | 15 | 0,00 | ||||
| 2025-07-29 | 13F | Stratos Wealth Partners, LTD. | 5.920 | 6,51 | 375 | 3,03 | ||||
| 2025-08-11 | 13F | Rothschild Investment Llc | 101 | 0,00 | 6 | 0,00 | ||||
| 2025-07-24 | 13F | WMG Financial Advisors, LLC | 3.777 | -11,63 | 239 | -14,70 | ||||
| 2025-07-25 | 13F | Cwm, Llc | 1.157 | 0,09 | 0 | |||||
| 2025-08-14 | 13F | Great Valley Advisor Group, Inc. | 5.426 | -10,20 | 343 | -12,94 | ||||
| 2025-07-14 | 13F | UMA Financial Services, Inc. | 241 | 0,00 | 15 | 0,00 | ||||
| 2025-07-23 | 13F | Schrum Private Wealth Management LLC | 14.947 | 0,00 | 946 | -3,18 | ||||
| 2025-08-06 | 13F | Bensler, LLC | 0 | -100,00 | 0 | |||||
| 2025-08-04 | 13F | Atria Investments Llc | 5.137 | 325 | ||||||
| 2025-08-05 | 13F | Huntington National Bank | 26 | 1.150,00 | ||||||
| 2025-08-08 | 13F | Larson Financial Group LLC | 285 | 0,00 | 18 | 0,00 |
Other Listings
| MX:FXG |