Grundlæggende statistik
| Institutionelle ejere | 43 total, 36 long only, 0 short only, 7 long/short - change of -12,00% MRQ |
| Gennemsnitlig porteføljeallokering | 0.0571 % - change of -44,66% MRQ |
| Institutionelle aktier (lange) | 1.052.586 (ex 13D/G) - change of -0,29MM shares -21,58% MRQ |
| Institutionel værdi (lang) | $ 69.535 USD ($1000) |
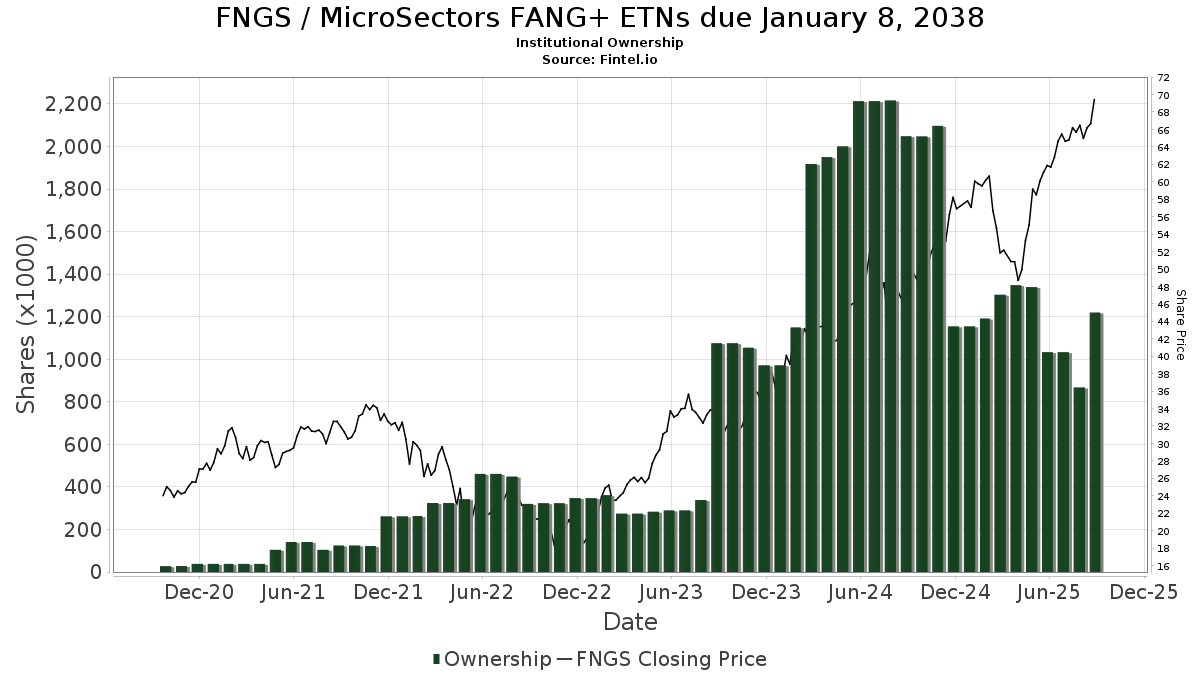
Institutionelt ejerskab og aktionærer
MicroSectors FANG+ ETNs due January 8, 2038 (US:FNGS) har 43 institutionelle ejere og aktionærer, der har indsendt 13D/G- eller 13F-formularer til Securities Exchange Commission (SEC). Disse institutioner har i alt 1,052,586 aktier. Største aktionærer omfatter Advisor Group Holdings, Inc., Wealth Enhancement Advisory Services, Llc, HBW Advisory Services LLC, Citadel Advisors Llc, Capital Investment Advisory Services, LLC, Susquehanna International Group, Llp, Gts Securities Llc, Cetera Investment Advisers, IMC-Chicago, LLC, and Citadel Advisors Llc .
MicroSectors FANG+ ETNs due January 8, 2038 (ARCA:FNGS) institutionel ejerskabsstruktur viser aktuelle positioner i virksomheden efter institutioner og fonde, samt seneste ændringer i positionsstørrelse. Større aktionærer kan omfatte individuelle investorer, investeringsforeninger, hedgefonde eller institutioner. Skema 13D angiver, at investoren besidder (eller besidder) mere end 5 % af virksomheden og har til hensigt (eller har til hensigt at) aktivt at forfølge en ændring i forretningsstrategi. Skema 13G indikerer en passiv investering på over 5%.
The share price as of April 28, 2026 is 69,80 / share. Previously, on April 29, 2025, the share price was 53,77 / share. This represents an increase of 29,81% over that period.
Fondens stemningsscore
Fund Sentiment Score (fka Ownership Accumulation Score) finder de aktier, der bliver mest købt af fonde. Det er resultatet af en sofistikeret, multi-faktor kvantitativ model, der identificerer virksomheder med de højeste niveauer af institutionel akkumulering. Scoringsmodellen bruger en kombination af den samlede stigning i oplyste ejere, ændringerne i porteføljeallokeringer i disse ejere og andre målinger. Tallet går fra 0 til 100, hvor højere tal indikerer et højere niveau af akkumulering for sine jævnaldrende, og 50 er gennemsnittet.
Opdateringsfrekvens: Dagligt
Se Ownership Explorer, som giver en liste over højest rangerende virksomheder.
AI+ Ask Fintel’s AI assistant about MicroSectors FANG+ ETNs due January 8, 2038.
Select a question to share a public post with an AI-crafted answer.
Thinking of good questions…
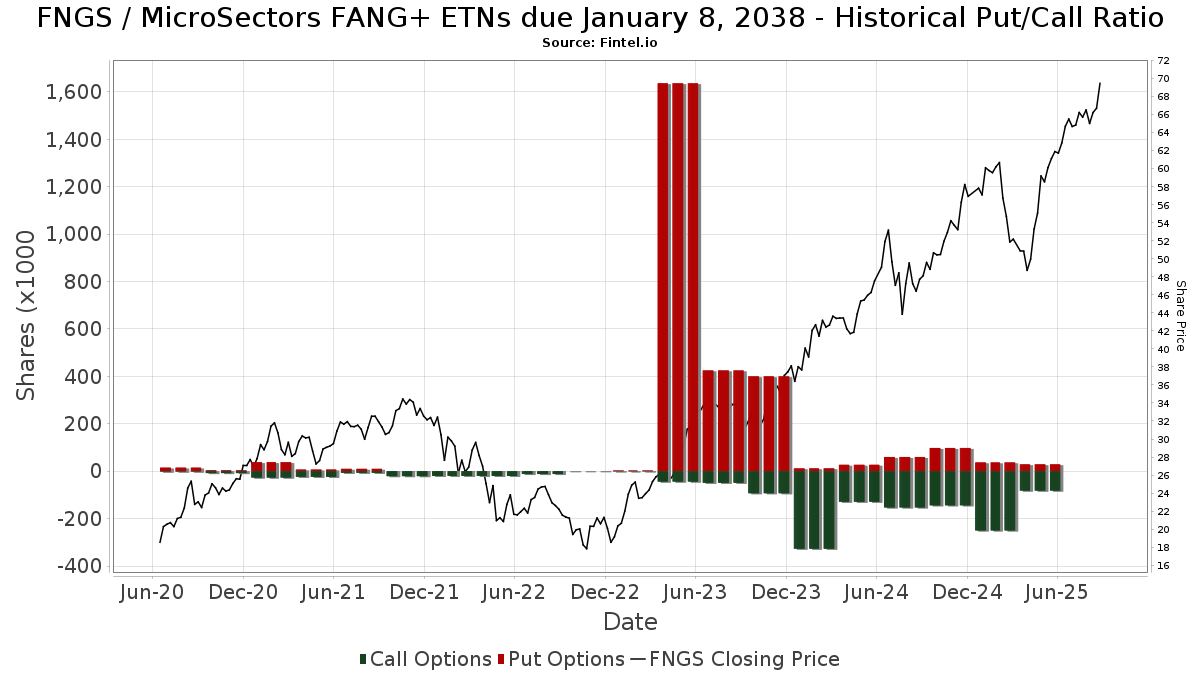
Institutionel Put/Call-forhold
Ud over at indberette standardaktie- og gældsudstedelser skal institutter med mere end 100 mill. aktiver under forvaltning også oplyse deres put- og call-optionsbeholdninger. Da salgsoptioner generelt indikerer negativ stemning, og købsoptioner indikerer positiv stemning, kan vi få en fornemmelse af den overordnede institutionelle stemning ved at plotte forholdet mellem put og kald. Diagrammet til højre viser det historiske put/call-forhold for dette instrument.
Brug af Put/Call Ratio som en indikator for investorernes stemning overvinder en af de vigtigste mangler ved at bruge totalt institutionelt ejerskab, som er, at en betydelig mængde af aktiver under forvaltning investeres passivt for at spore indekser. Passivt forvaltede fonde køber typisk ikke optioner, så indikatoren for put/call-forholdet følger mere nøje følelsen af aktivt forvaltede fonde.
13F og NPORT arkivering
Detaljer om 13F-arkivering er gratis. Detaljer om NP-ansøgninger kræver et premium-medlemskab. Grønne rækker angiver nye positioner. Røde rækker angiver lukkede positioner. Klik på linket ikon for at se den fulde transaktionshistorik.
Opgrader
for at låse premium-data op og eksportere til Excel ![]() .
.
| Fil dato | Kilde | Investor | Type | Gennemsnitlig pris (Øst) |
Aktier | Δ Aktier (%) |
Rapporteret Værdi ($1000) |
Δ Værdi (%) |
Port Alloc (%) |
|
|---|---|---|---|---|---|---|---|---|---|---|
| 2026-02-13 | 13F | Morgan Stanley | 4.816 | 71,88 | 328 | 66,84 | ||||
| 2026-02-13 | 13F | Mml Investors Services, Llc | 24.760 | 11,85 | 1.685 | 8,72 | ||||
| 2026-02-17 | 13F | Advisor Group Holdings, Inc. | 289.399 | -25,71 | 19.693 | -23,45 | ||||
| 2026-01-23 | 13F | Diversify Advisory Services, LLC | 6.458 | 1,21 | 431 | -7,51 | ||||
| 2026-02-05 | 13F | Allworth Financial LP | 8.737 | -1,04 | 595 | -3,73 | ||||
| 2026-02-12 | 13F | Concorde Asset Management, LLC | 4.481 | 0,00 | 305 | -2,88 | ||||
| 2026-02-17 | 13F | SageView Advisory Group, LLC | 500 | 34 | ||||||
| 2026-04-07 | 13F | Farther Finance Advisors, LLC | 192 | 0,00 | 12 | -15,38 | ||||
| 2026-04-13 | 13F | IFP Advisors, Inc | 2.735 | 31,87 | 163 | 15,60 | ||||
| 2026-02-11 | 13F | Group One Trading, L.p. | Put | 100 | 0,00 | 7 | 0,00 | |||
| 2026-02-17 | 13F | Bank Of America Corp /de/ | 4 | |||||||
| 2026-04-15 | 13F | Capital Advisory Group Advisory Services, LLC | 0 | -100,00 | 0 | |||||
| 2026-02-11 | 13F | Simplex Trading, Llc | 0 | -100,00 | 0 | |||||
| 2026-02-11 | 13F | Group One Trading, L.p. | Call | 900 | 28,57 | 61 | 27,08 | |||
| 2026-02-13 | 13F | SRS Capital Advisors, Inc. | 0 | -100,00 | 0 | |||||
| 2025-11-14 | 13F | Wolverine Trading, Llc | 5.129 | 56,32 | 360 | 69,34 | ||||
| 2025-11-14 | 13F | Wolverine Trading, Llc | Call | 11.300 | 34,52 | 792 | 46,13 | |||
| 2025-11-14 | 13F | Wolverine Trading, Llc | Put | 4.700 | 330 | |||||
| 2025-11-14 | 13F | Raymond James Financial Inc | 0 | -100,00 | 0 | |||||
| 2026-02-13 | 13F | National Bank Of Canada /fi/ | 619 | 0,00 | 42 | -2,33 | ||||
| 2025-11-13 | 13F | Wells Fargo & Company/mn | 0 | -100,00 | 0 | |||||
| 2026-02-17 | 13F | Citadel Advisors Llc | Put | 34.000 | -28,87 | 2.314 | -30,85 | |||
| 2026-02-17 | 13F | Cetera Investment Advisers | 36.137 | 2,31 | 2.459 | -0,49 | ||||
| 2026-02-18 | 13F | GWM Advisors LLC | 12.424 | -12,61 | 845 | -14,99 | ||||
| 2026-02-10 | 13F | Goldman Sachs Group Inc | 0 | -100,00 | 0 | |||||
| 2026-02-17 | 13F | Snowden Capital Advisors LLC | 17.464 | 0,00 | 1.188 | -2,78 | ||||
| 2026-01-23 | 13F | HBW Advisory Services LLC | 79.284 | 29,39 | 5.395 | 25,82 | ||||
| 2025-11-14 | 13F | Truvestments Capital Llc | 0 | -100,00 | 0 | |||||
| 2026-04-28 | 13F | Kingswood Wealth Advisors, Llc | 4.241 | 33,24 | 253 | 16,67 | ||||
| 2026-04-16 | 13F | SG Americas Securities, LLC | 0 | -100,00 | 0 | |||||
| 2026-02-09 | 13F | Client First Investment Management LLC | 0 | -100,00 | 0 | |||||
| 2025-11-07 | 13F | Perfromance Wealth Partners, LLC | 0 | -100,00 | 0 | |||||
| 2026-01-29 | 13F | IMC-Chicago, LLC | Call | 35.800 | 22,60 | 2.436 | 19,24 | |||
| 2025-11-03 | 13F | Absolute Capital Management, LLC | 0 | -100,00 | 0 | |||||
| 2026-02-17 | 13F | VestGen Advisors, LLC | 10.007 | 2,54 | 681 | -0,29 | ||||
| 2026-02-17 | 13F | Boothbay Fund Management, Llc | 5.100 | -28,17 | 347 | -30,04 | ||||
| 2026-02-12 | 13F | Jane Street Group, Llc | 31.985 | 2.177 | ||||||
| 2026-02-13 | 13F | Glen Eagle Advisors, LLC | 200 | 0,00 | 14 | 0,00 | ||||
| 2026-02-11 | 13F | LPL Financial LLC | 3.659 | 0,00 | 249 | -3,12 | ||||
| 2026-02-11 | 13F | OneAscent Financial Services LLC | 0 | -100,00 | 0 | -100,00 | ||||
| 2026-02-17 | 13F | Citadel Advisors Llc | 72.529 | 285,69 | 4.936 | 275,29 | ||||
| 2026-02-17 | 13F | Citadel Advisors Llc | Call | 9.700 | -23,02 | 660 | -25,09 | |||
| 2026-03-09 | 13F | Lifetime Wealth Management P.C. | 22 | 437 | ||||||
| 2026-04-08 | 13F | Wealth Enhancement Advisory Services, Llc | 183.152 | -6,97 | 11.161 | -16,32 | ||||
| 2026-04-07 | 13F | Ethos Capital Management, Inc. | 30.833 | -18,67 | 1.838 | -28,77 | ||||
| 2025-11-04 | 13F | Sollinda Capital Management LLC | 0 | -100,00 | 0 | -100,00 | ||||
| 2026-01-29 | 13F | IMC-Chicago, LLC | Put | 12.100 | 823 | |||||
| 2026-02-13 | 13F | 17 Capital Partners, Llc | 0 | -100,00 | 0 | |||||
| 2026-02-13 | 13F | Gts Securities Llc | 39.231 | -47,71 | 2.670 | -49,16 | ||||
| 2026-03-12 | 13F | Bawa N Mallick Trust | 3.000 | 0,00 | 204 | -2,39 | ||||
| 2026-02-10 | 13F | Belvedere Trading LLC | Call | 5.300 | 120,83 | 361 | 115,57 | |||
| 2026-02-10 | 13F | Belvedere Trading LLC | 100 | -95,00 | 7 | -95,68 | ||||
| 2026-02-11 | 13F | Parallel Advisors, LLC | 276 | 93,01 | 19 | 80,00 | ||||
| 2026-02-10 | 13F | Belvedere Trading LLC | Put | 4.700 | 0,00 | 320 | -2,74 | |||
| 2026-02-13 | 13F | Mariner, LLC | 25.867 | 3,55 | 1.760 | 0,69 | ||||
| 2026-02-10 | 13F | Envestnet Asset Management Inc | 25.250 | 2,58 | 1.718 | -0,23 | ||||
| 2026-01-29 | 13F | UBS Group AG | 5.165 | -5,45 | 351 | -8,12 | ||||
| 2026-02-12 | 13F | Hrt Financial Lp | 8.081 | -19,29 | 1 | |||||
| 2026-02-17 | 13F | Creative Planning | 3.022 | 0,17 | 206 | -2,84 | ||||
| 2026-02-11 | 13F | Simplex Trading, Llc | Put | 100 | -75,00 | 7 | ||||
| 2026-02-13 | 13F | Kestra Advisory Services, LLC | 0 | -100,00 | 0 | |||||
| 2026-02-09 | 13F | Cypress Capital Management LLC (WY) | 723 | 0,00 | 49 | -2,00 | ||||
| 2026-02-11 | 13F | Simplex Trading, Llc | Call | 1.400 | 16,67 | 95 | ||||
| 2026-02-05 | 13F | Cambridge Investment Research Advisors, Inc. | 0 | -100,00 | 0 | |||||
| 2026-02-13 | 13F | Citigroup Inc | 1 | 0 | ||||||
| 2026-02-17 | 13F | Susquehanna International Group, Llp | Call | 67.600 | 69,85 | 4.600 | 65,17 | |||
| 2026-02-13 | 13F | Centaurus Financial, Inc. | 4.991 | -23,25 | 0 | |||||
| 2026-02-17 | 13F | Susquehanna International Group, Llp | 14.267 | 971 | ||||||
| 2026-02-17 | 13F | Susquehanna International Group, Llp | Put | 22.400 | -68,09 | 1.524 | -68,97 | |||
| 2026-04-16 | 13F | Tactive Advisors, LLC | 0 | -100,00 | 0 | |||||
| 2025-11-14 | 13F | Walleye Capital LLC | 0 | -100,00 | 0 | |||||
| 2026-01-21 | 13F | Capital Investment Advisory Services, LLC | 70.517 | 2,56 | 4.799 | -0,27 | ||||
| 2026-02-17 | 13F | Royal Bank Of Canada | 17.232 | 15,84 | 1.173 | 12,79 |