Grundlæggende statistik
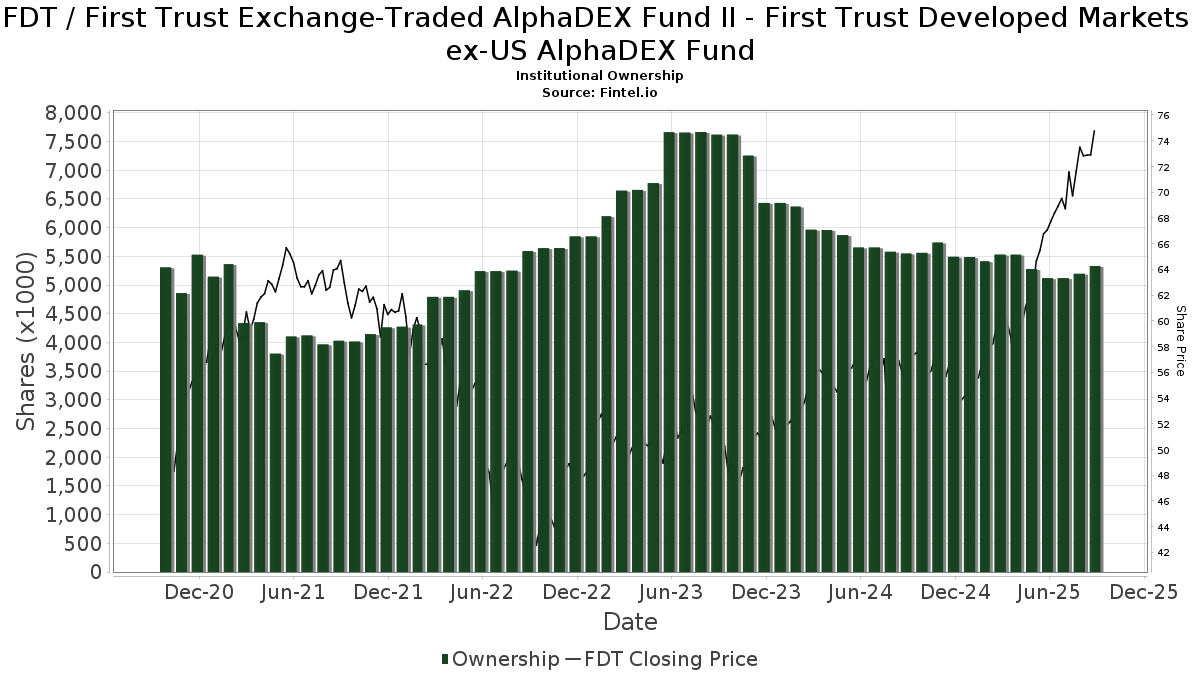
| Institutionelle ejere | 162 total, 162 long only, 0 short only, 0 long/short - change of 16,43% MRQ |
| Gennemsnitlig porteføljeallokering | 0.1758 % - change of 1,39% MRQ |
| Institutionelle aktier (lange) | 6.620.430 (ex 13D/G) - change of 0,42MM shares 6,73% MRQ |
| Institutionel værdi (lang) | $ 508.551 USD ($1000) |
Institutionelt ejerskab og aktionærer
First Trust Exchange-Traded AlphaDEX Fund II - First Trust Developed Markets ex-US AlphaDEX Fund (US:FDT) har 162 institutionelle ejere og aktionærer, der har indsendt 13D/G- eller 13F-formularer til Securities Exchange Commission (SEC). Disse institutioner har i alt 6,620,430 aktier. Største aktionærer omfatter Morgan Stanley, LPL Financial LLC, Wells Fargo & Company/mn, Envestnet Asset Management Inc, UBS Group AG, Cetera Investment Advisers, Royal Bank Of Canada, SMI Advisory Services, LLC, Raymond James Financial Inc, and Cambridge Investment Research Advisors, Inc. .
First Trust Exchange-Traded AlphaDEX Fund II - First Trust Developed Markets ex-US AlphaDEX Fund (NasdaqGM:FDT) institutionel ejerskabsstruktur viser aktuelle positioner i virksomheden efter institutioner og fonde, samt seneste ændringer i positionsstørrelse. Større aktionærer kan omfatte individuelle investorer, investeringsforeninger, hedgefonde eller institutioner. Skema 13D angiver, at investoren besidder (eller besidder) mere end 5 % af virksomheden og har til hensigt (eller har til hensigt at) aktivt at forfølge en ændring i forretningsstrategi. Skema 13G indikerer en passiv investering på over 5%.
The share price as of April 20, 2026 is 93,46 / share. Previously, on April 21, 2025, the share price was 58,63 / share. This represents an increase of 59,41% over that period.
Fondens stemningsscore
Fund Sentiment Score (fka Ownership Accumulation Score) finder de aktier, der bliver mest købt af fonde. Det er resultatet af en sofistikeret, multi-faktor kvantitativ model, der identificerer virksomheder med de højeste niveauer af institutionel akkumulering. Scoringsmodellen bruger en kombination af den samlede stigning i oplyste ejere, ændringerne i porteføljeallokeringer i disse ejere og andre målinger. Tallet går fra 0 til 100, hvor højere tal indikerer et højere niveau af akkumulering for sine jævnaldrende, og 50 er gennemsnittet.
Opdateringsfrekvens: Dagligt
Se Ownership Explorer, som giver en liste over højest rangerende virksomheder.
AI+ Ask Fintel’s AI assistant about First Trust Exchange-Traded AlphaDEX Fund II - First Trust Developed Markets ex-US AlphaDEX Fund.
Select a question to share a public post with an AI-crafted answer.
Thinking of good questions…
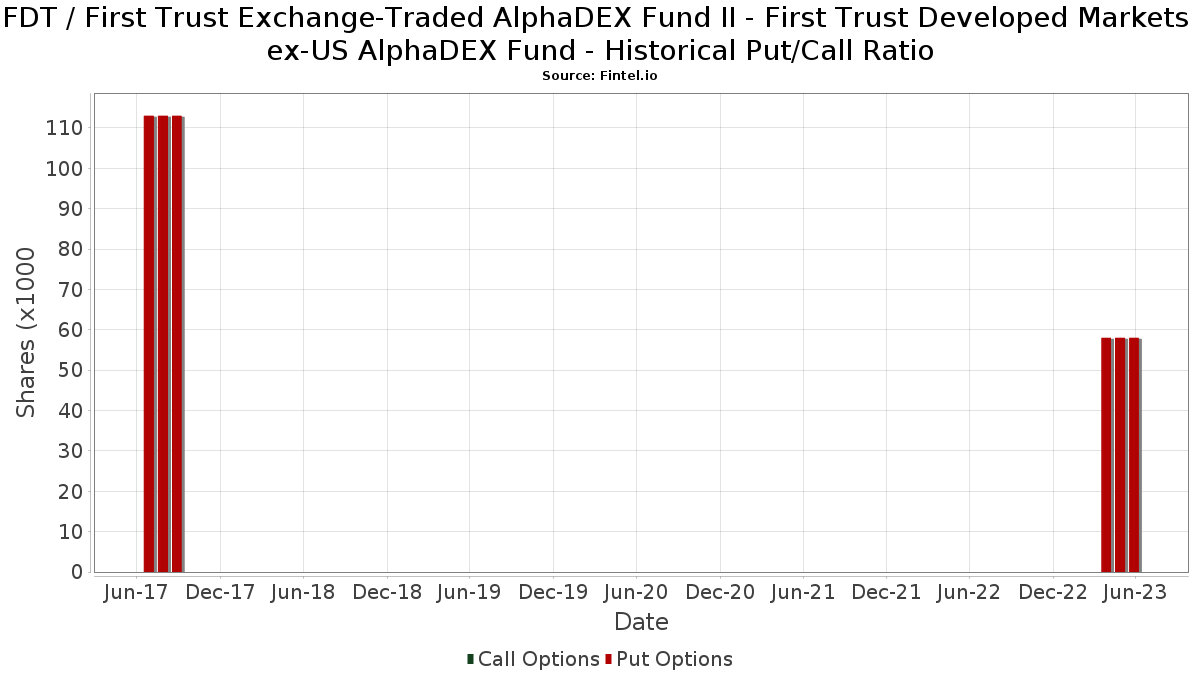
Institutionel Put/Call-forhold
Ud over at indberette standardaktie- og gældsudstedelser skal institutter med mere end 100 mill. aktiver under forvaltning også oplyse deres put- og call-optionsbeholdninger. Da salgsoptioner generelt indikerer negativ stemning, og købsoptioner indikerer positiv stemning, kan vi få en fornemmelse af den overordnede institutionelle stemning ved at plotte forholdet mellem put og kald. Diagrammet til højre viser det historiske put/call-forhold for dette instrument.
Brug af Put/Call Ratio som en indikator for investorernes stemning overvinder en af de vigtigste mangler ved at bruge totalt institutionelt ejerskab, som er, at en betydelig mængde af aktiver under forvaltning investeres passivt for at spore indekser. Passivt forvaltede fonde køber typisk ikke optioner, så indikatoren for put/call-forholdet følger mere nøje følelsen af aktivt forvaltede fonde.
13F og NPORT arkivering
Detaljer om 13F-arkivering er gratis. Detaljer om NP-ansøgninger kræver et premium-medlemskab. Grønne rækker angiver nye positioner. Røde rækker angiver lukkede positioner. Klik på linket ikon for at se den fulde transaktionshistorik.
Opgrader
for at låse premium-data op og eksportere til Excel ![]() .
.
| Fil dato | Kilde | Investor | Type | Gennemsnitlig pris (Øst) |
Aktier | Δ Aktier (%) |
Rapporteret Værdi ($1000) |
Δ Værdi (%) |
Port Alloc (%) |
|
|---|---|---|---|---|---|---|---|---|---|---|
| 2026-02-17 | 13F | Raymond James Financial Inc | 203.040 | -3,00 | 16.131 | 2,24 | ||||
| 2026-04-07 | 13F | CoreCap Advisors, LLC | 35 | 0,00 | 3 | 50,00 | ||||
| 2026-02-05 | 13F | L & S Advisors Inc | 34.147 | -0,94 | 2.713 | 4,43 | ||||
| 2026-04-15 | 13F | Mainsail Financial Group, LLC | 81.144 | 0,17 | 7.054 | 9,60 | ||||
| 2026-02-13 | 13F | Maia Wealth LLC | 2.261 | 210 | ||||||
| 2026-02-13 | 13F | Morgan Stanley | 1.107.012 | 3,36 | 87.948 | 8,95 | ||||
| 2026-02-13 | 13F | Allie Family Office LLC | 30.012 | 0,00 | 2.384 | 5,39 | ||||
| 2026-02-17 | 13F | Snowden Capital Advisors LLC | 24.890 | -5,00 | 1.977 | 0,15 | ||||
| 2026-01-29 | 13F | Sanctuary Advisors, LLC | 13.724 | -1,05 | 1.090 | 4,31 | ||||
| 2026-02-12 | 13F | CIBC Private Wealth Group, LLC | 51 | 0,00 | 4 | 33,33 | ||||
| 2026-02-13 | 13F | Wells Fargo & Company/mn | 418.051 | 9,97 | 33.213 | 15,92 | ||||
| 2026-02-17 | 13F | Creative Planning | 3.059 | 6,66 | 243 | 12,50 | ||||
| 2026-01-28 | 13F | Chicago Partners Investment Group LLC | 3.513 | 0,77 | 307 | 14,55 | ||||
| 2026-01-29 | 13F | Quest 10 Wealth Builders, Inc. | 292 | 0,00 | 23 | 4,55 | ||||
| 2026-02-17 | 13F | GeoWealth Management, LLC | 3.399 | -7,16 | 270 | -1,82 | ||||
| 2026-02-10 | 13F | REAP Financial Group, LLC | 714 | -2,86 | 57 | 1,82 | ||||
| 2026-02-13 | 13F | Golden State Wealth Management, LLC | 2.170 | -5,24 | 172 | 0,00 | ||||
| 2026-02-04 | 13F | Topsail Wealth Management, LLC | 717 | 0,00 | 57 | 3,70 | ||||
| 2026-01-29 | 13F | Comerica Bank | 13.997 | -36,13 | 1.112 | -32,65 | ||||
| 2026-02-04 | 13F | Family Legacy, Inc. | 6.321 | 502 | ||||||
| 2026-02-17 | 13F | Captrust Financial Advisors | 7.477 | -0,68 | 594 | 4,76 | ||||
| 2025-11-06 | 13F | 1776 Wealth LLC | 0 | -100,00 | 0 | |||||
| 2026-01-22 | 13F | Pinnacle Bancorp, Inc. | 400 | 0,00 | 32 | 3,33 | ||||
| 2026-02-18 | 13F | GWM Advisors LLC | 12.895 | 100,51 | 1.024 | 111,57 | ||||
| 2026-04-07 | 13F | Park Avenue Securities Llc | 16.996 | 1 | ||||||
| 2026-04-10 | 13F | Novem Group | 5.140 | 447 | ||||||
| 2026-02-13 | 13F | Smartleaf Asset Management LLC | 591 | 222,95 | 47 | 261,54 | ||||
| 2026-01-16 | 13F | Formidable Asset Management, LLC | 3.745 | 0,00 | 282 | 9,73 | ||||
| 2026-02-06 | 13F | TPG Financial Advisors, LLC | 57.801 | -1,21 | 4.592 | 4,15 | ||||
| 2026-02-17 | 13F | Fmr Llc | 872 | 121,88 | 69 | 137,93 | ||||
| 2026-04-08 | 13F | Towerpoint Wealth, LLC | 31.565 | -0,02 | 2.744 | 9,37 | ||||
| 2026-04-13 | 13F | IFP Advisors, Inc | 37.997 | -9,83 | 3.303 | -1,31 | ||||
| 2026-02-13 | 13F | Resources Investment Advisors, LLC. | 7.583 | 602 | ||||||
| 2026-02-17 | 13F | Signature Equity Partners, LLC | 447 | 35 | ||||||
| 2026-02-17 | 13F | Mpwm Advisory Solutions, Llc | 0 | -100,00 | 0 | |||||
| 2026-03-23 | 13F | J. Derek Lewis & Associates Inc. | 2.766 | 220 | ||||||
| 2025-11-06 | 13F | Ameritas Advisory Services, LLC | 0 | -100,00 | 0 | -100,00 | ||||
| 2026-04-20 | 13F | Greenup Street Wealth Management Llc | 47.192 | -4,56 | 4.102 | 4,43 | ||||
| 2026-02-13 | 13F | Mml Investors Services, Llc | 30.038 | 44,74 | 2.386 | 52,56 | ||||
| 2026-01-29 | 13F | UBS Group AG | 284.768 | 26,45 | 22.624 | 33,30 | ||||
| 2026-04-20 | 13F | Kestra Private Wealth Services, Llc | 22.363 | 1.944 | ||||||
| 2026-02-12 | 13F | Commonwealth Equity Services, Llc | 22.155 | -8,53 | 1.760 | 175.900,00 | ||||
| 2026-01-21 | 13F | Newbridge Financial Services Group, Inc. | 275 | 0,00 | 22 | 5,00 | ||||
| 2026-02-18 | 13F | Caitlin John, LLC | 60 | 0,00 | 5 | 0,00 | ||||
| 2026-01-29 | 13F | Ashton Thomas Private Wealth, LLC | 2.710 | 215 | ||||||
| 2026-02-02 | 13F | Truist Financial Corp | 40.000 | 9,51 | 3.178 | 15,40 | ||||
| 2026-01-27 | 13F | PFG Advisors | 4.634 | -29,87 | 368 | -26,10 | ||||
| 2026-02-10 | 13F | SFI Advisors, LLC | 15.605 | -1,30 | 1.240 | 4,03 | ||||
| 2026-01-29 | 13F | D.a. Davidson & Co. | 18.576 | 5,18 | 1.476 | 10,82 | ||||
| 2026-04-17 | 13F | Worth Asset Management, LLC | 2.519 | 0,00 | 219 | 9,00 | ||||
| 2026-02-02 | 13F | Benjamin Edwards Inc | 142.768 | 16,42 | 11.345 | 22,73 | ||||
| 2026-04-07 | 13F | Farther Finance Advisors, LLC | 1.679 | -91,04 | 149 | -90,06 | ||||
| 2026-04-07 | 13F | Signaturefd, Llc | 30 | 3 | ||||||
| 2026-02-02 | 13F | RIA Advisory Group LLC | 3.159 | 2,17 | 251 | 7,73 | ||||
| 2026-01-29 | 13F | Traction Financial Partners, LLC | 3.744 | -0,37 | 297 | 4,95 | ||||
| 2026-04-13 | 13F | Cyndeo Wealth Partners, LLC | 10.153 | 0,00 | 883 | 9,43 | ||||
| 2026-01-26 | 13F | AE Wealth Management LLC | 37.368 | -8,92 | 2.969 | -4,01 | ||||
| 2026-02-09 | 13F | Huntington National Bank | 46 | 4,65 | ||||||
| 2026-02-06 | 13F | Envestnet Portfolio Solutions, Inc. | 7.397 | 0,11 | 588 | 5,58 | ||||
| 2026-02-13 | 13F | First Trust Advisors Lp | 11.974 | -1,49 | 951 | 3,82 | ||||
| 2026-02-17 | 13F | Susquehanna International Group, Llp | 79.935 | 6.351 | ||||||
| 2026-01-20 | 13F | American National Bank | 78 | 0,00 | 6 | 20,00 | ||||
| 2026-02-03 | 13F | Koshinski Asset Management, Inc. | 36.108 | 139,25 | 2.869 | 152,24 | ||||
| 2026-02-09 | 13F | Kingsview Wealth Management, LLC | 86.031 | -39,99 | 6.835 | -36,75 | ||||
| 2026-04-13 | 13F | Creative Financial Designs Inc /adv | 872 | 419,05 | 76 | 476,92 | ||||
| 2026-04-15 | 13F | Redhawk Wealth Advisors, Inc. | 29.378 | 2.554 | ||||||
| 2025-11-06 | 13F | Stratos Wealth Partners, LTD. | 0 | -100,00 | 0 | |||||
| 2026-04-16 | 13F | Triad Wealth Partners, LLC | 6.799 | -7,79 | 591 | 1,03 | ||||
| 2026-02-11 | 13F | Janney Montgomery Scott LLC | 39.614 | 7,69 | 3 | 50,00 | ||||
| 2026-02-13 | 13F | MAI Capital Management | 220 | 0,00 | 17 | 6,25 | ||||
| 2026-04-15 | 13F | DAVENPORT & Co LLC | 6.143 | 534 | ||||||
| 2026-01-30 | 13F | Sigma Planning Corp | 0 | -100,00 | 0 | |||||
| 2026-02-17 | 13F | Jones Financial Companies Lllp | 8.970 | 60,95 | 713 | 71,15 | ||||
| 2026-02-09 | 13F | Harbour Investments, Inc. | 9.161 | -0,48 | 728 | 4,91 | ||||
| 2026-02-12 | 13F | Hrt Financial Lp | 0 | -100,00 | 0 | |||||
| 2026-02-12 | 13F | Jane Street Group, Llc | 0 | -100,00 | 0 | |||||
| 2026-02-17 | 13F | Private Advisor Group, LLC | 13.832 | -0,12 | 1.099 | 5,27 | ||||
| 2026-02-05 | 13F | Petix & Botte Co | 3.972 | 0,00 | 316 | 5,35 | ||||
| 2026-02-05 | 13F | BlueChip Wealth Advisors LLC | 6.014 | 0,00 | 478 | 5,30 | ||||
| 2026-04-15 | 13F | Trust Co Of Toledo Na /oh/ | 210 | 0,00 | 18 | 12,50 | ||||
| 2026-02-06 | 13F | Global Retirement Partners, LLC | 6.350 | -5,34 | 504 | -0,20 | ||||
| 2026-01-28 | 13F | Sage Private Wealth Group, Llc | 179.043 | 5,75 | 14.224 | 11,46 | ||||
| 2026-02-17 | 13F | Risk Paradigm Group, LLC | 0 | -100,00 | 0 | |||||
| 2026-02-10 | 13F/A | LVZ Advisors, Inc. | 25.830 | -6,45 | 2.052 | -1,39 | ||||
| 2026-02-13 | 13F | Element Wealth, LLC | 4.116 | 0,00 | 327 | 5,48 | ||||
| 2026-02-12 | 13F | Wealthspire Advisors, LLC | 0 | -100,00 | 0 | |||||
| 2026-02-13 | 13F | SRS Capital Advisors, Inc. | 240 | 19 | ||||||
| 2026-04-07 | 13F | SMI Advisory Services, LLC | 203.985 | 23,62 | 17.951 | 29,68 | ||||
| 2026-04-14 | 13F | Prospera Financial Services Inc | 34.995 | -32,02 | 3.042 | -25,61 | ||||
| 2026-01-13 | 13F | Signature Securities Group Corporation | 11.272 | 3,47 | 896 | 9,01 | ||||
| 2026-02-02 | 13F | Fifth Third Bancorp | 103 | 8 | ||||||
| 2026-01-21 | 13F | Flagship Harbor Advisors, Llc | 20 | 2 | ||||||
| 2026-02-13 | 13F | Stifel Financial Corp | 101.773 | -4,71 | 8.085 | 0,45 | ||||
| 2026-02-19 | 13F | Mcguire Capital Advisors Inc | 9 | 1 | ||||||
| 2026-02-11 | 13F | LPL Financial LLC | 844.377 | 12,31 | 67.083 | 18,39 | ||||
| 2026-02-17 | 13F | Cetera Investment Advisers | 268.826 | 2,72 | 21.357 | 8,27 | ||||
| 2026-02-05 | 13F | Allworth Financial LP | 170 | 0,00 | 14 | 8,33 | ||||
| 2026-02-12 | 13F | StoneX Group Inc. | 20.189 | 7,37 | 1.604 | 13,13 | ||||
| 2026-01-27 | 13F | Belpointe Asset Management LLC | 6.134 | 57,32 | 487 | 66,21 | ||||
| 2026-04-17 | 13F | RFG Advisory, LLC | 23.771 | 224,25 | 2.066 | 254,98 | ||||
| 2026-02-10 | 13F | Bank of New York Mellon Corp | 42.197 | -5,54 | 3.352 | -0,42 | ||||
| 2026-02-12 | 13F | Principal Securities, Inc. | 5.791 | -0,31 | 460 | 5,26 | ||||
| 2025-11-12 | 13F | Transce3nd, LLC | 0 | -100,00 | 0 | |||||
| 2026-02-13 | 13F | Ubs Asset Management Americas Inc | 92 | 7 | ||||||
| 2026-01-26 | 13F | Keystone Wealth Services, LLC | 3.678 | 6,18 | 292 | 11,88 | ||||
| 2026-02-12 | 13F | Steward Partners Investment Advisory, Llc | 138 | 0,00 | 11 | 0,00 | ||||
| 2026-04-16 | 13F | Aurora Private Wealth, Inc. | 3.120 | 0,00 | 0 | |||||
| 2026-03-13 | 13F/A | Pensionmark Financial Group, Llc | 3.231 | 257 | ||||||
| 2026-02-05 | 13F | Atria Investments Llc | 43.526 | -5,77 | 3.458 | -0,66 | ||||
| 2026-02-06 | 13F | Larson Financial Group LLC | 912 | 0,55 | 72 | 5,88 | ||||
| 2026-04-06 | 13F | GAMMA Investing LLC | 1.731 | 0,00 | 150 | 9,49 | ||||
| 2026-01-28 | 13F | Geneos Wealth Management Inc. | 115 | 15,00 | 9 | 28,57 | ||||
| 2026-04-20 | 13F | Hilton Head Capital Partners, LLC | 4 | 0,00 | 0 | |||||
| 2026-02-12 | 13F | Richmond Investment Services, LLC | 2.802 | 0,43 | 223 | 5,71 | ||||
| 2026-02-17 | 13F | Advisor Group Holdings, Inc. | 151.398 | 12,24 | 12.028 | 21,12 | ||||
| 2026-01-21 | 13F | Sound Income Strategies, LLC | 55 | 5 | ||||||
| 2026-02-12 | 13F | Colonial Trust Advisors | 200 | 0,00 | 16 | 0,00 | ||||
| 2026-01-27 | 13F | Waterfront Wealth Inc. | 10.640 | 0,00 | 936 | 16,15 | ||||
| 2026-02-17 | 13F | Equitable Holdings, Inc. | 9.929 | 60,69 | 789 | 69,46 | ||||
| 2026-02-13 | 13F | Kestra Advisory Services, LLC | 0 | -100,00 | 0 | |||||
| 2026-02-17 | 13F | Bank Of America Corp /de/ | 310 | 362,69 | 25 | 380,00 | ||||
| 2026-04-15 | 13F | Iams Wealth Management, Llc | 10.717 | -35,76 | 932 | -29,74 | ||||
| 2026-02-06 | 13F | Empirical Asset Management, LLC | 18.742 | 57,19 | 1.489 | 65,81 | ||||
| 2026-04-20 | 13F | SILVER OAK SECURITIES, Inc | 0 | -100,00 | 0 | |||||
| 2026-02-06 | 13F | Lloyd Advisory Services, LLC. | 42 | 3 | ||||||
| 2026-02-18 | 13F | Pacific Excel Wealth Advisors, Inc. | 10.219 | 812 | ||||||
| 2026-02-03 | 13F | Fsb Premier Wealth Management, Inc. | 23.050 | 0,44 | 1.831 | 5,90 | ||||
| 2026-02-05 | 13F | Cambridge Investment Research Advisors, Inc. | 200.248 | -1,74 | 16 | 0,00 | ||||
| 2026-02-11 | 13F | Gateway Wealth Partners, LLC | 33.523 | 11,62 | 2.663 | 17,68 | ||||
| 2026-02-12 | 13F | Brinker Capital Investments, LLC | 23.993 | 2,86 | 1.906 | 8,42 | ||||
| 2026-02-03 | 13F | NewEdge Wealth, LLC | 22.683 | -1,60 | 1.802 | 2,04 | ||||
| 2026-04-06 | 13F | Private Client Services, Llc | 3.962 | -6,71 | 344 | 2,08 | ||||
| 2026-01-22 | 13F | Apollon Wealth Management, LLC | 4.479 | -14,59 | 356 | -10,13 | ||||
| 2026-02-13 | 13F | Pine Valley Investments Ltd Liability Co | 12.040 | 3,45 | 957 | 9,01 | ||||
| 2026-02-02 | 13F | Oppenheimer & Co Inc | 3.556 | 283 | ||||||
| 2026-02-06 | 13F | EverSource Wealth Advisors, LLC | 49 | 4 | ||||||
| 2026-02-17 | 13F | Pinnacle Family Advisors, LLC | 7.262 | -5,41 | 577 | -0,35 | ||||
| 2026-01-15 | 13F | Private Advisory Group LLC | 10.493 | 49,37 | 834 | 57,47 | ||||
| 2026-02-13 | 13F | Mariner, LLC | 3.031 | 0,20 | 241 | 5,26 | ||||
| 2026-02-18 | 13F | Beacon Pointe Advisors, LLC | 3.383 | 0,00 | 269 | 5,51 | ||||
| 2026-04-15 | 13F | Nations Financial Group Inc, /ia/ /adv | 6.785 | 590 | ||||||
| 2026-01-23 | 13F | Assetmark, Inc | 153.132 | 0,28 | 12.166 | 5,71 | ||||
| 2026-02-05 | 13F | Tucker Asset Management Llc | 2.914 | -15,46 | 232 | -10,81 | ||||
| 2026-02-17 | 13F | Royal Bank Of Canada | 207.835 | -8,97 | 16.512 | -4,04 | ||||
| 2026-02-13 | 13F | Arkadios Wealth Advisors | 8.700 | -2,38 | 691 | 2,98 | ||||
| 2026-02-11 | 13F | Jpmorgan Chase & Co | 928 | 57,82 | 74 | 65,91 | ||||
| 2026-02-10 | 13F/A | Northwestern Mutual Wealth Management Co | 5.162 | 35,88 | 410 | 43,36 | ||||
| 2026-02-05 | 13F | Sequent Planning LLC | 2.829 | -2,45 | 225 | 2,75 | ||||
| 2026-02-17 | 13F | LaSalle St. Investment Advisors, LLC | 7.703 | -1,96 | 1 | |||||
| 2026-01-23 | 13F | ABLE Financial Group, LLC | 7.010 | -2,01 | 557 | 3,15 | ||||
| 2026-02-11 | 13F | OneAscent Financial Services LLC | 25.017 | -6,84 | 1.988 | -1,83 | ||||
| 2026-02-06 | 13F | Cullen/frost Bankers, Inc. | 529 | 50,71 | 42 | 61,54 | ||||
| 2026-02-14 | 13F | Rockefeller Capital Management L.P. | 3.136 | 79,51 | 249 | 90,08 | ||||
| 2026-04-16 | 13F | Davis Capital Management | 93 | 0,00 | 8 | 14,29 | ||||
| 2026-02-12 | 13F | BRYN MAWR TRUST Co | 600 | 0,00 | 48 | 4,44 | ||||
| 2026-01-30 | 13F | Us Bancorp \de\ | 16.331 | 55,50 | 1.297 | 63,97 | ||||
| 2026-02-13 | 13F | Gts Securities Llc | 0 | -100,00 | 0 | |||||
| 2026-02-17 | 13F | Ameriflex Group, Inc. | 114 | -50,00 | 9 | -47,06 | ||||
| 2026-01-23 | 13F | HBW Advisory Services LLC | 16.811 | 165,58 | 1.336 | 179,87 | ||||
| 2026-02-13 | 13F | Asset Allocation Strategies LLC | 3.998 | 26,68 | 318 | 33,76 | ||||
| 2026-01-13 | 13F | Synergy Financial Management, LLC | 5.564 | -85,68 | 442 | -84,90 | ||||
| 2026-02-03 | 13F | We Are One Seven, LLC | 3.435 | 273 | ||||||
| 2026-02-05 | 13F | Plante Moran Financial Advisors, LLC | 752 | 0,00 | 60 | 5,36 | ||||
| 2026-01-26 | 13F | Cwm, Llc | 10.758 | -10,38 | 1 | |||||
| 2026-02-10 | 13F | Envestnet Asset Management Inc | 406.082 | -3,18 | 32.262 | 2,05 | ||||
| 2026-02-13 | 13F | Citigroup Inc | 246 | 0,00 | 20 | 5,56 | ||||
| 2026-02-12 | 13F | Rossby Financial, LCC | 2.449 | -6,85 | 195 | -2,51 | ||||
| 2025-10-23 | 13F | Spire Wealth Management | 0 | -100,00 | 0 | |||||
| 2026-04-14 | 13F | Nbc Securities, Inc. | 2.191 | 0,37 | 191 | 9,83 | ||||
| 2026-02-10 | 13F | IFG Advisory, LLC | 4.513 | 359 | ||||||
| 2026-02-17 | 13F | Wiley Bros.-aintree Capital, Llc | 4.595 | 365 | ||||||
| 2026-04-17 | 13F | Ignite Planners, LLC | 5.776 | 115,04 | 529 | 126,07 | ||||
| 2026-02-18 | 13F | Crusonia Wealth Advisors LLC | 63.361 | 5.034 | ||||||
| 2026-02-17 | 13F | Coppell Advisory Solutions LLC | 45.824 | 3,51 | 3.663 | 10,50 | ||||
| 2026-04-16 | 13F | Balboa Wealth Partners | 18.443 | 1.603 | ||||||
| 2026-04-02 | 13F | Hilltop National Bank | 1.450 | 0,00 | 126 | 9,57 | ||||
| 2026-02-13 | 13F | Centaurus Financial, Inc. | 1.492 | -23,01 | 0 |