Grundlæggende statistik
| Institutionelle ejere | 88 total, 88 long only, 0 short only, 0 long/short - change of 7,32% MRQ |
| Gennemsnitlig porteføljeallokering | 0.0864 % - change of -45,67% MRQ |
| Institutionelle aktier (lange) | 5.160.589 (ex 13D/G) - change of 0,45MM shares 9,53% MRQ |
| Institutionel værdi (lang) | $ 425.118 USD ($1000) |
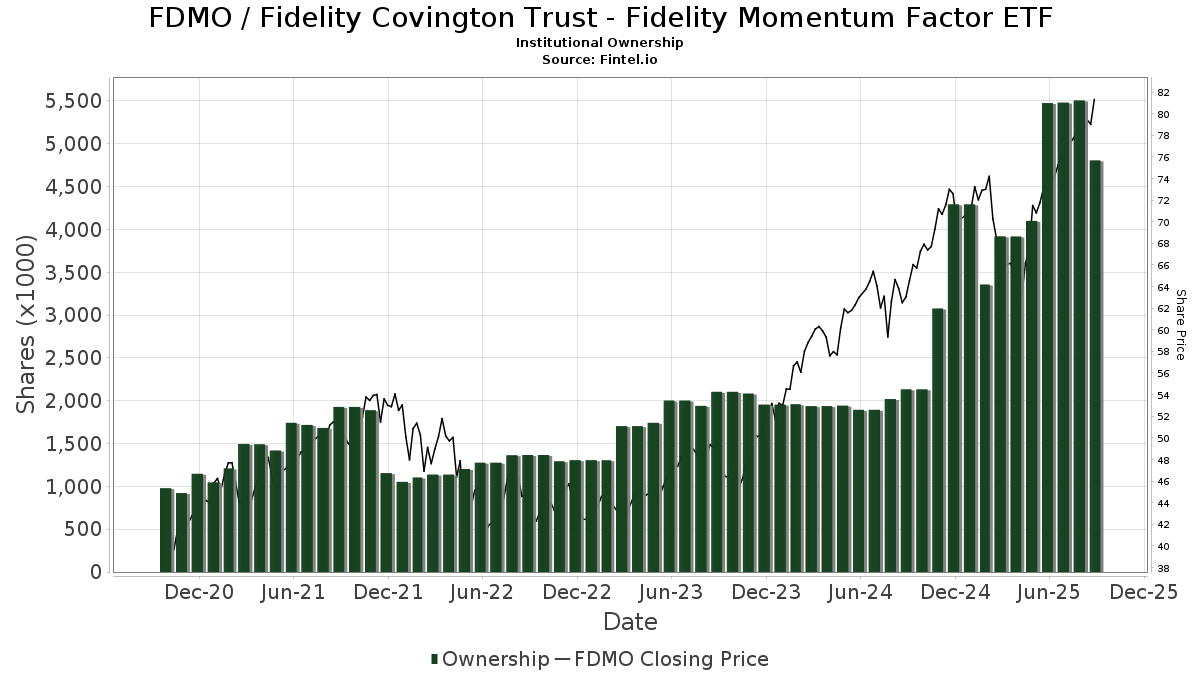
Institutionelt ejerskab og aktionærer
Fidelity Covington Trust - Fidelity Momentum Factor ETF (US:FDMO) har 88 institutionelle ejere og aktionærer, der har indsendt 13D/G- eller 13F-formularer til Securities Exchange Commission (SEC). Disse institutioner har i alt 5,160,589 aktier. Største aktionærer omfatter Fmr Llc, Envestnet Asset Management Inc, Great Lakes Retirement, Inc., Cetera Investment Advisers, Portfolio Strategies, Inc., Raymond James Financial Inc, LPL Financial LLC, Cambridge Investment Research Advisors, Inc., Commonwealth Equity Services, Llc, and Kestra Private Wealth Services, Llc .
Fidelity Covington Trust - Fidelity Momentum Factor ETF (ARCA:FDMO) institutionel ejerskabsstruktur viser aktuelle positioner i virksomheden efter institutioner og fonde, samt seneste ændringer i positionsstørrelse. Større aktionærer kan omfatte individuelle investorer, investeringsforeninger, hedgefonde eller institutioner. Skema 13D angiver, at investoren besidder (eller besidder) mere end 5 % af virksomheden og har til hensigt (eller har til hensigt at) aktivt at forfølge en ændring i forretningsstrategi. Skema 13G indikerer en passiv investering på over 5%.
The share price as of March 6, 2026 is 81,43 / share. Previously, on March 10, 2025, the share price was 63,82 / share. This represents an increase of 27,59% over that period.
Fondens stemningsscore
Fund Sentiment Score (fka Ownership Accumulation Score) finder de aktier, der bliver mest købt af fonde. Det er resultatet af en sofistikeret, multi-faktor kvantitativ model, der identificerer virksomheder med de højeste niveauer af institutionel akkumulering. Scoringsmodellen bruger en kombination af den samlede stigning i oplyste ejere, ændringerne i porteføljeallokeringer i disse ejere og andre målinger. Tallet går fra 0 til 100, hvor højere tal indikerer et højere niveau af akkumulering for sine jævnaldrende, og 50 er gennemsnittet.
Opdateringsfrekvens: Dagligt
Se Ownership Explorer, som giver en liste over højest rangerende virksomheder.
AI+ Ask Fintel’s AI assistant about Fidelity Covington Trust - Fidelity Momentum Factor ETF.
Select a question to share a public post with an AI-crafted answer.
Thinking of good questions…
Institutionel Put/Call-forhold
Ud over at indberette standardaktie- og gældsudstedelser skal institutter med mere end 100 mill. aktiver under forvaltning også oplyse deres put- og call-optionsbeholdninger. Da salgsoptioner generelt indikerer negativ stemning, og købsoptioner indikerer positiv stemning, kan vi få en fornemmelse af den overordnede institutionelle stemning ved at plotte forholdet mellem put og kald. Diagrammet til højre viser det historiske put/call-forhold for dette instrument.
Brug af Put/Call Ratio som en indikator for investorernes stemning overvinder en af de vigtigste mangler ved at bruge totalt institutionelt ejerskab, som er, at en betydelig mængde af aktiver under forvaltning investeres passivt for at spore indekser. Passivt forvaltede fonde køber typisk ikke optioner, så indikatoren for put/call-forholdet følger mere nøje følelsen af aktivt forvaltede fonde.
13F og NPORT arkivering
Detaljer om 13F-arkivering er gratis. Detaljer om NP-ansøgninger kræver et premium-medlemskab. Grønne rækker angiver nye positioner. Røde rækker angiver lukkede positioner. Klik på linket ikon for at se den fulde transaktionshistorik.
Opgrader
for at låse premium-data op og eksportere til Excel ![]() .
.
| Fil dato | Kilde | Investor | Type | Gennemsnitlig pris (Øst) |
Aktier | Δ Aktier (%) |
Rapporteret Værdi ($1000) |
Δ Værdi (%) |
Port Alloc (%) |
|
|---|---|---|---|---|---|---|---|---|---|---|
| 2026-02-09 | 13F | Kestra Investment Management, LLC | 6.069 | 68,82 | 510 | 70,81 | ||||
| 2025-11-14 | 13F | Prudential Plc | 0 | -100,00 | 0 | |||||
| 2026-02-13 | 13F | Morgan Stanley | 22.835 | -48,07 | 1.917 | -47,58 | ||||
| 2026-02-10 | 13F/A | Northwestern Mutual Wealth Management Co | 6.470 | 18,04 | 543 | 19,34 | ||||
| 2026-01-20 | 13F | Signaturefd, Llc | 51 | 0,00 | 4 | 0,00 | ||||
| 2026-02-17 | 13F | Blair William & Co/il | 6 | 1 | ||||||
| 2026-02-17 | 13F | Bank Of America Corp /de/ | 27.723 | 1,50 | 2.328 | 2,47 | ||||
| 2026-02-20 | 13F | Sunbelt Securities, Inc. | 1.989 | 0,05 | 167 | 0,61 | ||||
| 2026-01-23 | 13F | Assetmark, Inc | 2.533 | 126.550,00 | 213 | |||||
| 2026-01-28 | 13F | Dentgroup LLC | 2.974 | 3,59 | 250 | 4,62 | ||||
| 2026-02-10 | 13F | ShoreHaven Wealth Partners, LLC | 2.906 | 244 | ||||||
| 2026-01-29 | 13F | Quest 10 Wealth Builders, Inc. | 429 | 0,00 | 36 | 2,86 | ||||
| 2026-02-17 | 13F | Wiley Bros.-aintree Capital, Llc | 9.225 | 776 | ||||||
| 2026-02-06 | 13F | Larson Financial Group LLC | 605 | 0,00 | 51 | 0,00 | ||||
| 2026-02-12 | 13F | Steward Partners Investment Advisory, Llc | 441 | 30,09 | 37 | 32,14 | ||||
| 2025-10-30 | 13F | Twin Peaks Wealth Advisors, LLC | 0 | -100,00 | 0 | -100,00 | ||||
| 2026-03-04 | 13F | SHP Wealth Management | 47 | 4 | ||||||
| 2026-01-26 | 13F | Elevation Capital Advisory, LLC | 52.354 | 125,40 | 4.396 | 127,60 | ||||
| 2026-02-10 | 13F | Envestnet Asset Management Inc | 1.317.601 | 4,68 | 110.626 | 5,68 | ||||
| 2026-02-12 | 13F | Foster Dykema Cabot & Partners, Llc | 0 | -100,00 | 0 | |||||
| 2026-02-06 | 13F | Creative Financial Designs Inc /adv | 1.517 | 17,96 | 127 | 19,81 | ||||
| 2026-02-14 | 13F | Rockefeller Capital Management L.P. | 24.470 | 14,44 | 2.055 | 15,52 | ||||
| 2026-03-04 | 13F | Rehmann Capital Advisory Group | 17.153 | -1,63 | 1.440 | -0,69 | ||||
| 2026-02-05 | 13F | HighMark Wealth Management LLC | 0 | -100,00 | 0 | |||||
| 2026-02-17 | 13F | Raymond James Financial Inc | 141.954 | 7,32 | 11.918 | 8,35 | ||||
| 2026-02-11 | 13F | Cerity Partners LLC | 56.849 | -1,33 | 4.773 | -0,40 | ||||
| 2026-02-13 | 13F | Wells Fargo & Company/mn | 1 | -94,44 | 0 | -100,00 | ||||
| 2026-02-10 | 13F | Foundations Investment Advisors, LLC | 23.575 | 5,71 | 1.979 | 6,74 | ||||
| 2026-02-13 | 13F | Integrated Wealth Concepts LLC | 0 | -100,00 | 0 | |||||
| 2026-02-06 | 13F | Cullen/frost Bankers, Inc. | 9.540 | 2,58 | 801 | 3,49 | ||||
| 2026-02-12 | 13F | Mosley Wealth Management | 7.394 | 618 | ||||||
| 2026-02-12 | 13F | Principal Securities, Inc. | 0 | -100,00 | 0 | |||||
| 2026-02-06 | 13F | Global Retirement Partners, LLC | 4.509 | 0,11 | 379 | 1,07 | ||||
| 2025-11-14 | 13F | Glen Eagle Advisors, LLC | 0 | -100,00 | 0 | |||||
| 2026-02-10 | 13F | Goldman Sachs Group Inc | 3.765 | -69,94 | 316 | -69,64 | ||||
| 2026-01-20 | 13F | Ascent Group, LLC | 4.857 | 1,55 | 408 | 2,52 | ||||
| 2026-01-15 | 13F | Retireful, LLC | 4.184 | 351 | ||||||
| 2026-02-17 | 13F | Russell Investments Group, Ltd. | 307 | 26 | ||||||
| 2026-01-23 | 13F | Capital Investment Counsel, Inc | 2.360 | 198 | ||||||
| 2026-02-11 | 13F | Jpmorgan Chase & Co | 27.113 | -18,66 | 2.276 | -17,89 | ||||
| 2026-02-11 | 13F | O'shaughnessy Asset Management, Llc | 301 | 0,00 | 25 | 0,00 | ||||
| 2026-02-13 | 13F | Mariner, LLC | 4.280 | 359 | ||||||
| 2026-02-11 | 13F | J.w. Cole Advisors, Inc. | 11.012 | 44,31 | 925 | 45,74 | ||||
| 2026-02-03 | 13F | AssuredPartners Investment Advisors, LLC | 4.168 | 0,00 | 350 | 0,87 | ||||
| 2026-02-17 | 13F | Old Mission Capital Llc | 0 | -100,00 | 0 | |||||
| 2025-11-25 | 13F | Briaud Financial Planning, Inc | 0 | -100,00 | 0 | |||||
| 2026-01-30 | 13F | Bogart Wealth, LLC | 130 | 11 | ||||||
| 2026-02-06 | 13F | IFP Advisors, Inc | 1.412 | 38,57 | 119 | 40,48 | ||||
| 2026-02-11 | 13F | Marks Group Wealth Management, Inc | 5.163 | 433 | ||||||
| 2026-02-12 | 13F | Commonwealth Equity Services, Llc | 83.352 | 23,09 | 6.998 | 139.860,00 | ||||
| 2025-11-14 | 13F | Flow Traders U.s. Llc | 0 | -100,00 | 0 | |||||
| 2026-01-22 | 13F | Harwood Advisory Group, LLC | 4.331 | 0,05 | 364 | 0,83 | ||||
| 2026-02-12 | 13F | CIBC Private Wealth Group, LLC | 412 | -10,43 | 35 | -10,53 | ||||
| 2026-02-13 | 13F | Pinnacle Wealth Planning Services, Inc. | 44 | 4 | ||||||
| 2026-02-17 | 13F | Royal Bank Of Canada | 15.259 | 869,44 | 1.281 | 877,86 | ||||
| 2026-02-10 | 13F | Calton & Associates, Inc. | 4.847 | 407 | ||||||
| 2026-02-11 | 13F | First Command Advisory Services, Inc. | 0 | -100,00 | 0 | |||||
| 2026-02-17 | 13F | Fmr Llc | 2.108.970 | 16,72 | 177.069 | 17,83 | ||||
| 2026-01-08 | 13F | Wealth Enhancement Advisory Services, Llc | 19.343 | -1,29 | 1.675 | 3,14 | ||||
| 2026-01-14 | 13F | Spire Wealth Management | 207 | 0,00 | 17 | 0,00 | ||||
| 2025-10-27 | 13F | Hoxton Planning & Management, LLC | 7.878 | 0,00 | 655 | 9,72 | ||||
| 2026-01-23 | 13F | Halbert Hargrove Global Advisors, Llc | 118 | 10 | ||||||
| 2026-01-07 | 13F | Orgel Wealth Management, LLC | 8.961 | -1,61 | 752 | -0,66 | ||||
| 2026-01-29 | 13F | High Point Wealth Management, LLC | 1.018 | 85 | ||||||
| 2026-02-06 | 13F | Axxcess Wealth Management, Llc | 4.331 | 364 | ||||||
| 2026-02-13 | 13F | National Bank Of Canada /fi/ | 79 | 0,00 | 7 | 0,00 | ||||
| 2026-01-30 | 13F | Strategic Blueprint, LLC | 32.812 | 37,21 | 2.755 | 38,53 | ||||
| 2025-11-14 | 13F | Jane Street Group, Llc | 0 | -100,00 | 0 | |||||
| 2026-01-14 | 13F | Nova Wealth Management, Inc. | 13.147 | 39,70 | 1.104 | 41,05 | ||||
| 2026-01-23 | 13F | Farther Finance Advisors, LLC | 4.056 | 75,58 | 341 | 77,08 | ||||
| 2026-01-26 | 13F | Keystone Wealth Services, LLC | 7.375 | 9,11 | 619 | 10,14 | ||||
| 2026-01-26 | 13F | AE Wealth Management LLC | 10.804 | 44,34 | 907 | 45,82 | ||||
| 2026-02-18 | 13F | GWM Advisors LLC | 27.321 | -50,27 | 2.294 | -49,80 | ||||
| 2026-02-12 | 13F | Great Lakes Retirement, Inc. | 229.207 | 0,72 | 19.244 | 1,68 | ||||
| 2026-02-13 | 13F | Kestra Advisory Services, LLC | 0 | -100,00 | 0 | |||||
| 2026-02-10 | 13F | Koss-Olinger Consulting, LLC | 0 | -100,00 | 0 | |||||
| 2026-01-29 | 13F | Kestra Private Wealth Services, Llc | 70.085 | 9,64 | 5.884 | 10,68 | ||||
| 2026-01-30 | 13F | Sigma Planning Corp | 5.020 | 38,10 | 421 | 39,40 | ||||
| 2025-11-14 | 13F | Two Sigma Investments, Lp | 0 | -100,00 | 0 | |||||
| 2026-02-13 | 13F | MAI Capital Management | 57 | 0,00 | 5 | 0,00 | ||||
| 2026-01-29 | 13F | Inscription Capital, LLC | 6.610 | 0,00 | 555 | 0,91 | ||||
| 2026-02-10 | 13F | Linscomb & Williams, Inc. | 4.000 | 0,00 | 336 | 0,90 | ||||
| 2026-02-12 | 13F | Wealthspire Advisors, LLC | 0 | -100,00 | 0 | |||||
| 2026-01-27 | 13F | Portfolio Strategies, Inc. | 153.992 | 3,99 | 12.929 | 4,99 | ||||
| 2026-02-17 | 13F | High Falls Advisors, Inc | 4.242 | -12,97 | 356 | -12,10 | ||||
| 2026-02-04 | 13F | Ameritas Advisory Services, LLC | 0 | -100,00 | 0 | |||||
| 2026-02-09 | 13F | Harbour Investments, Inc. | 37 | 0,00 | 3 | 0,00 | ||||
| 2026-02-06 | 13F | Envestnet Portfolio Solutions, Inc. | 20.913 | 26,70 | 1.756 | 27,92 | ||||
| 2026-02-17 | 13F | Susquehanna International Group, Llp | 17.538 | 1.472 | ||||||
| 2025-11-03 | 13F | Absolute Capital Management, LLC | 0 | -100,00 | 0 | |||||
| 2025-11-14 | 13F | Citadel Advisors Llc | 0 | -100,00 | 0 | |||||
| 2026-01-13 | 13F | Stonehearth Capital Management, LLC | 6.980 | 0,00 | 586 | 1,03 | ||||
| 2026-02-17 | 13F | Cetera Investment Advisers | 195.063 | 10,94 | 16.377 | 11,99 | ||||
| 2026-02-11 | 13F | LPL Financial LLC | 106.798 | 87,34 | 8.967 | 89,12 | ||||
| 2026-01-22 | 13F | Westbourne Investments, Inc. | 5.138 | 31,34 | 431 | 29,82 | ||||
| 2026-01-26 | 13F | Cwm, Llc | 629 | 4.392,86 | 0 | |||||
| 2026-02-05 | 13F | Cambridge Investment Research Advisors, Inc. | 96.737 | 90,15 | 8 | 100,00 | ||||
| 2026-02-13 | 13F | SRS Capital Advisors, Inc. | 1.328 | 111 | ||||||
| 2026-02-05 | 13F | Allworth Financial LP | 30 | 3 | ||||||
| 2026-01-26 | 13F | Valmark Advisers, Inc. | 5.046 | 424 | ||||||
| 2026-01-12 | 13F | Sax Wealth Advisors, Llc | 6.811 | 0,00 | 572 | 0,88 | ||||
| 2026-01-29 | 13F | UBS Group AG | 0 | -100,00 | 0 | |||||
| 2026-02-17 | 13F | Advisor Group Holdings, Inc. | 38.658 | -11,25 | 3.247 | -9,78 | ||||
| 2026-02-02 | 13F | Cornerstone Planning Group LLC | 625 | 0,00 | 55 | 3,85 | ||||
| 2026-02-17 | 13F | Advisory Services Network, LLC | 0 | -100,00 | 0 | |||||
| 2026-02-04 | 13F | Nwam Llc | 0 | -100,00 | 0 | -100,00 | ||||
| 2026-02-03 | 13F | Foronjy Financial Llc | 2.655 | 223 | ||||||
| 2026-02-17 | 13F | Equitable Holdings, Inc. | 5.372 | 42,99 | 451 | 44,55 | ||||
| 2026-01-23 | 13F | Bryant Woods Investment Advisors, LLC | 11.917 | 0,11 | 1.001 | 1,01 | ||||
| 2025-09-26 | 13F | Capital A Wealth Management, LLC | 0 | -100,00 | 0 | |||||
| 2026-02-12 | 13F | Founders Financial Alliance, LLC | 0 | -100,00 | 0 | |||||
| 2026-02-10 | 13F | Rothschild Investment Llc | 164 | 14 |