Grundlæggende statistik
| Institutionelle ejere | 159 total, 159 long only, 0 short only, 0 long/short - change of 11,19% MRQ |
| Gennemsnitlig porteføljeallokering | 0.2111 % - change of -19,41% MRQ |
| Institutionelle aktier (lange) | 13.820.699 (ex 13D/G) - change of -2,75MM shares -16,60% MRQ |
| Institutionel værdi (lang) | $ 810.335 USD ($1000) |
Institutionelt ejerskab og aktionærer
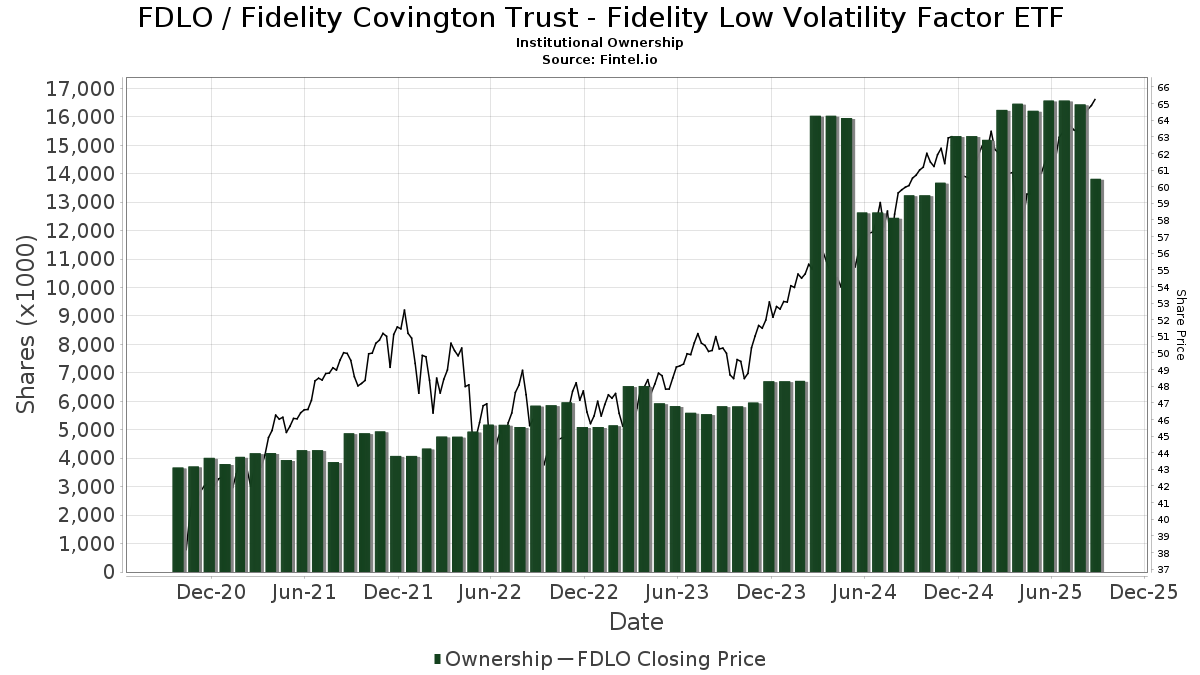
Fidelity Covington Trust - Fidelity Low Volatility Factor ETF (US:FDLO) har 159 institutionelle ejere og aktionærer, der har indsendt 13D/G- eller 13F-formularer til Securities Exchange Commission (SEC). Disse institutioner har i alt 13,820,699 aktier. Største aktionærer omfatter Fmr Llc, Commonwealth Equity Services, Llc, Envestnet Asset Management Inc, Bank Of America Corp /de/, Kestra Advisory Services, LLC, Campbell Deegan Wealth Management, LLC, CI Private Wealth, LLC, Segall Bryant & Hamill, Llc, LPL Financial LLC, and GWM Advisors LLC .
Fidelity Covington Trust - Fidelity Low Volatility Factor ETF (ARCA:FDLO) institutionel ejerskabsstruktur viser aktuelle positioner i virksomheden efter institutioner og fonde, samt seneste ændringer i positionsstørrelse. Større aktionærer kan omfatte individuelle investorer, investeringsforeninger, hedgefonde eller institutioner. Skema 13D angiver, at investoren besidder (eller besidder) mere end 5 % af virksomheden og har til hensigt (eller har til hensigt at) aktivt at forfølge en ændring i forretningsstrategi. Skema 13G indikerer en passiv investering på over 5%.
The share price as of September 12, 2025 is 65,65 / share. Previously, on September 16, 2024, the share price was 60,93 / share. This represents an increase of 7,75% over that period.
Fondens stemningsscore
Fund Sentiment Score (fka Ownership Accumulation Score) finder de aktier, der bliver mest købt af fonde. Det er resultatet af en sofistikeret, multi-faktor kvantitativ model, der identificerer virksomheder med de højeste niveauer af institutionel akkumulering. Scoringsmodellen bruger en kombination af den samlede stigning i oplyste ejere, ændringerne i porteføljeallokeringer i disse ejere og andre målinger. Tallet går fra 0 til 100, hvor højere tal indikerer et højere niveau af akkumulering for sine jævnaldrende, og 50 er gennemsnittet.
Opdateringsfrekvens: Dagligt
Se Ownership Explorer, som giver en liste over højest rangerende virksomheder.
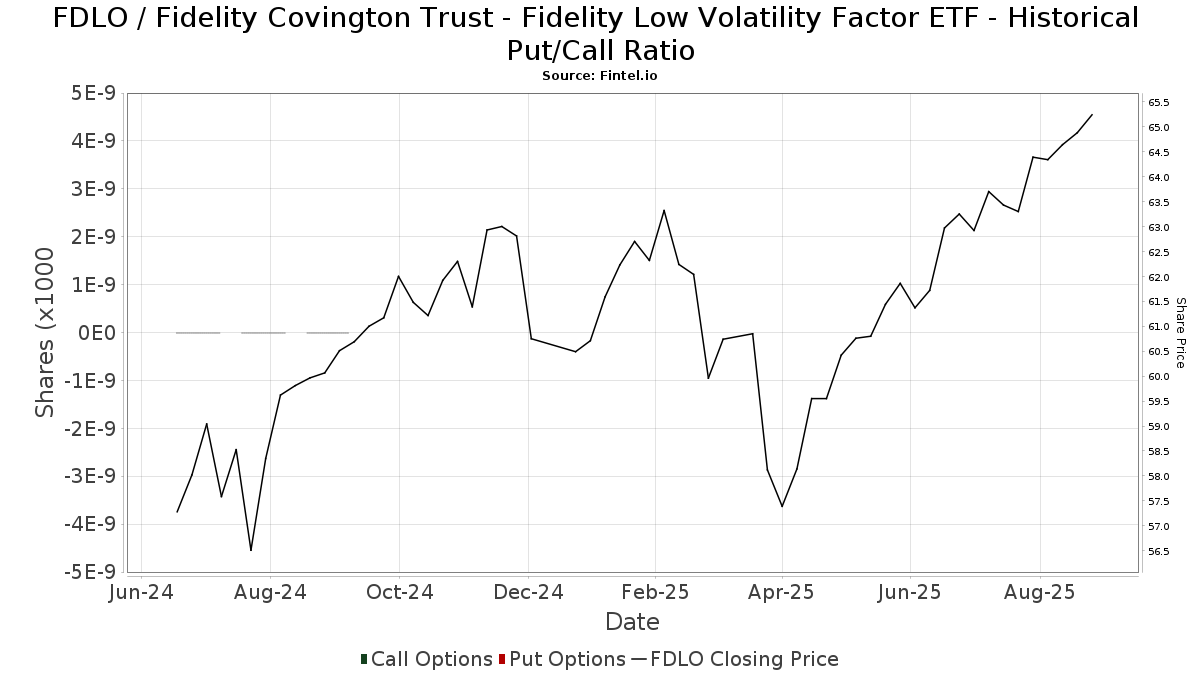
Institutionel Put/Call-forhold
Ud over at indberette standardaktie- og gældsudstedelser skal institutter med mere end 100 mill. aktiver under forvaltning også oplyse deres put- og call-optionsbeholdninger. Da salgsoptioner generelt indikerer negativ stemning, og købsoptioner indikerer positiv stemning, kan vi få en fornemmelse af den overordnede institutionelle stemning ved at plotte forholdet mellem put og kald. Diagrammet til højre viser det historiske put/call-forhold for dette instrument.
Brug af Put/Call Ratio som en indikator for investorernes stemning overvinder en af de vigtigste mangler ved at bruge totalt institutionelt ejerskab, som er, at en betydelig mængde af aktiver under forvaltning investeres passivt for at spore indekser. Passivt forvaltede fonde køber typisk ikke optioner, så indikatoren for put/call-forholdet følger mere nøje følelsen af aktivt forvaltede fonde.
13F og NPORT arkivering
Detaljer om 13F-arkivering er gratis. Detaljer om NP-ansøgninger kræver et premium-medlemskab. Grønne rækker angiver nye positioner. Røde rækker angiver lukkede positioner. Klik på linket ikon for at se den fulde transaktionshistorik.
Opgrader
for at låse premium-data op og eksportere til Excel ![]() .
.
| Fil dato | Kilde | Investor | Type | Gennemsnitlig pris (Øst) |
Aktier | Δ Aktier (%) |
Rapporteret Værdi ($1000) |
Δ Værdi (%) |
Port Alloc (%) |
|
|---|---|---|---|---|---|---|---|---|---|---|
| 2025-08-08 | 13F | Glassman Wealth Services | 0 | -100,00 | 0 | |||||
| 2025-08-14 | 13F | Mercer Global Advisors Inc /adv | 7.834 | -13,80 | 492 | -10,73 | ||||
| 2025-08-08 | 13F | Foundations Investment Advisors, LLC | 74.355 | 12,88 | 4.670 | 16,93 | ||||
| 2025-05-13 | 13F | Coston, McIsaac & Partners | 0 | -100,00 | 0 | |||||
| 2025-08-13 | 13F | Colonial Trust Advisors | 9 | 1 | ||||||
| 2025-07-28 | 13F | BRYN MAWR TRUST Co | 360 | 0,00 | 23 | 4,76 | ||||
| 2025-08-07 | 13F | Samalin Investment Counsel, LLC | 5.494 | 0,05 | 345 | 3,92 | ||||
| 2025-07-08 | 13F | RMR Wealth Builders | 3.540 | -6,99 | 222 | -3,48 | ||||
| 2025-09-04 | 13F/A | Advisor Group Holdings, Inc. | 118.808 | -22,53 | 7.466 | -19,73 | ||||
| 2025-07-25 | 13F | Atria Wealth Solutions, Inc. | 8.861 | -8,67 | 556 | -5,44 | ||||
| 2025-08-11 | 13F | Aptus Capital Advisors, LLC | 6.024 | 88,90 | 378 | 95,85 | ||||
| 2025-08-14 | 13F | Mml Investors Services, Llc | 6.641 | -36,69 | 0 | |||||
| 2025-08-11 | 13F | Empowered Funds, LLC | 0 | -100,00 | 0 | |||||
| 2025-07-11 | 13F | Farther Finance Advisors, LLC | 436 | 19,45 | 27 | 22,73 | ||||
| 2025-08-12 | 13F | Integrated Advisors Network LLC | 7.603 | -30,12 | 477 | -27,62 | ||||
| 2025-08-06 | 13F | Hoxton Planning & Management, LLC | 3.561 | 0,00 | 224 | 3,72 | ||||
| 2025-07-28 | 13F | Harbour Investments, Inc. | 96 | -92,10 | 6 | -91,78 | ||||
| 2025-08-01 | 13F | Envestnet Asset Management Inc | 555.092 | -9,25 | 34.860 | -5,98 | ||||
| 2025-08-15 | 13F | Morgan Stanley | 77.179 | -28,32 | 4.847 | -25,75 | ||||
| 2025-08-14 | 13F | Clarity Asset Management, Inc. | 2.228 | 0,36 | 140 | 3,73 | ||||
| 2025-07-18 | 13F | Provident Wealth Management, LLC | 2.886 | 0,00 | 181 | 4,02 | ||||
| 2025-08-07 | 13F | Kestra Private Wealth Services, Llc | 26.095 | 6,30 | 1.639 | 10,08 | ||||
| 2025-08-08 | 13F | Avantax Advisory Services, Inc. | 12.509 | 1,08 | 786 | 4,67 | ||||
| 2025-08-27 | 13F/A | Brinker Capital Investments, LLC | 3.360 | 211 | ||||||
| 2025-07-17 | 13F | Beacon Capital Management, LLC | 70 | 4 | ||||||
| 2025-08-14 | 13F | Qube Research & Technologies Ltd | 0 | -100,00 | 0 | |||||
| 2025-08-12 | 13F | Absolute Capital Management, LLC | 3.473 | -25,52 | 218 | -22,70 | ||||
| 2025-07-21 | 13F | Ameritas Advisory Services, LLC | 130.449 | -48,98 | 8.192 | -47,14 | ||||
| 2025-08-08 | 13F | Advisors Capital Management, LLC | 34.774 | -2,44 | 2.184 | 1,06 | ||||
| 2025-08-14 | 13F | Stifel Financial Corp | 49.645 | 4,39 | 3.118 | 8,15 | ||||
| 2025-07-24 | 13F | Capital Advisors, Ltd. LLC | 10 | 0 | ||||||
| 2025-08-14 | 13F | Fmr Llc | 7.934.912 | -23,10 | 498.312 | -20,33 | ||||
| 2025-07-25 | 13F | Cwm, Llc | 700 | 233,33 | 0 | |||||
| 2025-08-13 | 13F | Cresset Asset Management, LLC | 6.304 | -0,02 | 396 | 3,40 | ||||
| 2025-08-04 | 13F | Savvy Advisors, Inc. | 3.329 | 209 | ||||||
| 2025-07-24 | 13F | Us Bancorp \de\ | 120 | -6,98 | 8 | 0,00 | ||||
| 2025-08-12 | 13F | Running Point Capital Advisors, LLC | 165.902 | 1,36 | 10.419 | 5,00 | ||||
| 2025-07-28 | 13F | Private Wealth Asset Management, LLC | 1.050 | 0,00 | 66 | 3,17 | ||||
| 2025-08-04 | 13F | AMG National Trust Bank | 3.518 | 0,23 | 221 | 3,77 | ||||
| 2025-08-14 | 13F | Bank Of America Corp /de/ | 443.513 | 9,54 | 27.853 | 13,48 | ||||
| 2025-07-31 | 13F | Buckingham Strategic Partners | 10.068 | 0,24 | 632 | 3,95 | ||||
| 2025-08-13 | 13F | Capital Analysts, Inc. | 33.953 | 1,90 | 2 | 0,00 | ||||
| 2025-07-14 | 13F | Mechanics Bank Trust Department | 73.282 | 17,87 | 4.602 | 22,13 | ||||
| 2025-05-16 | 13F | Coppell Advisory Solutions LLC | 0 | -100,00 | 0 | |||||
| 2025-08-07 | 13F | Allworth Financial LP | 74 | -64,08 | 5 | -66,67 | ||||
| 2025-08-12 | 13F | MAI Capital Management | 264 | 42,70 | 17 | 45,45 | ||||
| 2025-08-18 | 13F | Hershey Financial Advisers, LLC | 0 | -100,00 | 0 | |||||
| 2025-08-11 | 13F | Private Advisor Group, LLC | 5.014 | -16,35 | 315 | -13,50 | ||||
| 2025-08-12 | 13F | J.w. Cole Advisors, Inc. | 5.043 | 1,67 | 317 | 5,33 | ||||
| 2025-08-14 | 13F | Betterment LLC | 7.494 | -2,24 | 0 | |||||
| 2025-08-14 | 13F | AllSquare Wealth Management LLC | 9.933 | 0,00 | 624 | 3,49 | ||||
| 2025-08-12 | 13F | SRS Capital Advisors, Inc. | 1.817 | 0,39 | 114 | 4,59 | ||||
| 2025-08-08 | 13F | OmniStar Financial Group, Inc. | 8.493 | 0,41 | 533 | 3,29 | ||||
| 2025-05-15 | 13F | EP Wealth Advisors, Inc. | 0 | -100,00 | 0 | -100,00 | ||||
| 2025-08-06 | 13F | Nvwm, Llc | 19.688 | 5,94 | 1.236 | 9,77 | ||||
| 2025-08-12 | 13F | Global Retirement Partners, LLC | 2.160 | 0,56 | 136 | 3,85 | ||||
| 2025-08-08 | 13F | Pnc Financial Services Group, Inc. | 44 | 76,00 | 3 | 100,00 | ||||
| 2025-05-14 | 13F | Orion Portfolio Solutions, LLC | 4.032 | 0,00 | 244 | 0,00 | ||||
| 2025-08-15 | 13F | Kestra Advisory Services, LLC | 346.284 | 7,32 | 21.747 | 11,18 | ||||
| 2025-08-13 | 13F | Cary Street Partners Financial Llc | 8.955 | -8,91 | 562 | -5,55 | ||||
| 2025-05-16 | 13F/A | Kestra Investment Management, LLC | 0 | -100,00 | 0 | |||||
| 2025-07-30 | 13F | Exencial Wealth Advisors, Llc | 78.286 | -7,41 | 4.916 | -4,08 | ||||
| 2025-08-13 | 13F | Transce3nd, LLC | 133 | 0,00 | 8 | 0,00 | ||||
| 2025-07-30 | 13F | Avidian Wealth Solutions, LLC | 9.666 | -0,30 | 607 | 3,41 | ||||
| 2025-08-12 | 13F | Argent Trust Co | 22.759 | -5,03 | 1.429 | -1,58 | ||||
| 2025-07-31 | 13F | Sequent Asset Management, LLC | 22.710 | 0,00 | 1.426 | 3,63 | ||||
| 2025-08-12 | 13F | Segall Bryant & Hamill, Llc | 227.641 | -2,94 | 14.296 | 0,54 | ||||
| 2025-08-14 | 13F | Valley Financial Group, Inc. | 5.554 | -0,61 | 349 | 2,96 | ||||
| 2025-08-15 | 13F | Semmax Financial Advisors Inc. | 55 | 0,00 | 3 | 0,00 | ||||
| 2025-08-12 | 13F | Steward Partners Investment Advisory, Llc | 4.035 | -5,79 | 253 | -2,32 | ||||
| 2025-08-13 | 13F | Truvestments Capital Llc | 800 | 0,00 | 50 | 4,17 | ||||
| 2025-07-18 | 13F | Dogwood Wealth Management LLC | 6 | 0 | ||||||
| 2025-07-30 | 13F | Rehmann Capital Advisory Group | 20.897 | 0,00 | 1.312 | 3,63 | ||||
| 2025-08-12 | 13F | Jpmorgan Chase & Co | 76.116 | -3,60 | 4.780 | -0,13 | ||||
| 2025-07-17 | 13F | Tempus Wealth Planning, LLC | 27.794 | 0,34 | 1.745 | 3,93 | ||||
| 2025-07-10 | 13F | Wealth Enhancement Advisory Services, Llc | 16.987 | -20,48 | 1.080 | -16,54 | ||||
| 2025-05-09 | 13F | Blair William & Co/il | 0 | -100,00 | 0 | |||||
| 2025-08-14 | 13F | GWM Advisors LLC | 176.211 | 49,47 | 11.066 | 54,86 | ||||
| 2025-08-08 | 13F | Campbell Deegan Wealth Management, LLC | 314.733 | 3,08 | 19.765 | 6,79 | ||||
| 2025-08-04 | 13F | Assetmark, Inc | 143 | 197,92 | 9 | 300,00 | ||||
| 2025-07-30 | 13F | Brookstone Capital Management | 8.581 | 10,51 | 539 | 14,47 | ||||
| 2025-08-15 | 13F | CI Private Wealth, LLC | 236.209 | 0,29 | 14.834 | 3,89 | ||||
| 2025-08-04 | 13F | Spire Wealth Management | 16 | 0,00 | 1 | |||||
| 2025-08-05 | 13F | Westside Investment Management, Inc. | 14.750 | 0,14 | 926 | 3,81 | ||||
| 2025-07-31 | 13F | Carnegie Capital Asset Management, LLC | 3.912 | 0,00 | 246 | 13,95 | ||||
| 2025-08-15 | 13F | Asset Allocation Strategies LLC | 21.830 | -31,72 | 1.371 | -29,31 | ||||
| 2025-07-24 | 13F | Ronald Blue Trust, Inc. | 1.071 | 67 | ||||||
| 2025-07-31 | 13F | Cambridge Investment Research Advisors, Inc. | 41.154 | -3,81 | 3 | 0,00 | ||||
| 2025-08-14 | 13F/A | Rockefeller Capital Management L.P. | 14.634 | -67,79 | 919 | -66,63 | ||||
| 2025-08-14 | 13F | Jane Street Group, Llc | 15.034 | 4,82 | 944 | 8,63 | ||||
| 2025-08-14 | 13F | Integrated Wealth Concepts LLC | 8.153 | 0,97 | 512 | 4,70 | ||||
| 2025-07-31 | 13F | Briaud Financial Planning, Inc | 722 | 0 | ||||||
| 2025-07-21 | 13F | Ascent Group, LLC | 3.674 | -0,43 | 231 | 3,14 | ||||
| 2025-08-14 | 13F | Royal Bank Of Canada | 51.430 | -53,21 | 3.230 | -51,52 | ||||
| 2025-08-01 | 13F | Howard Capital Management Inc. | 80.838 | 91,48 | 5.077 | 98,36 | ||||
| 2025-07-14 | 13F | Abound Wealth Management | 529 | 33 | ||||||
| 2025-08-13 | 13F | Northwestern Mutual Wealth Management Co | 25.113 | -12,44 | 1.577 | -9,26 | ||||
| 2025-08-14 | 13F | Harwood Advisory Group, LLC | 3.069 | -2,39 | 193 | 1,05 | ||||
| 2025-08-14 | 13F | Sunbelt Securities, Inc. | 6.126 | -46,56 | 371 | -46,54 | ||||
| 2025-05-02 | 13F | Transcendent Capital Group LLC | 0 | -100,00 | 0 | |||||
| 2025-05-14 | 13F | Islay Capital Management, Llc | 0 | -100,00 | 0 | |||||
| 2025-07-10 | 13F | ARS Wealth Advisors Group, LLC | 4.727 | 0,36 | 297 | 3,86 | ||||
| 2025-07-15 | 13F | Maseco Llp | 374 | 23 | ||||||
| 2025-08-06 | 13F | Atlantic Union Bankshares Corp | 291 | 18 | ||||||
| 2025-07-25 | 13F | Johnson Investment Counsel Inc | 4.604 | -5,91 | 289 | -2,36 | ||||
| 2025-08-08 | 13F | Cetera Investment Advisers | 172.247 | 2,56 | 10.817 | 6,25 | ||||
| 2025-08-05 | 13F | Bank Of Montreal /can/ | 65 | 0,00 | 4 | 33,33 | ||||
| 2025-07-15 | 13F | Regatta Capital Group, Llc | 7.578 | 476 | ||||||
| 2025-07-21 | 13F | Abundance Wealth Counselors | 79.114 | -5,65 | 5 | 0,00 | ||||
| 2025-08-08 | 13F | Citizens Financial Group Inc/ri | 3.461 | 217 | ||||||
| 2025-08-14 | 13F | Comerica Bank | 394 | 0,00 | 25 | 4,35 | ||||
| 2025-08-12 | 13F | O'shaughnessy Asset Management, Llc | 10.881 | 2.350,68 | 683 | 2.526,92 | ||||
| 2025-05-12 | 13F | Independent Advisor Alliance | 0 | -100,00 | 0 | |||||
| 2025-07-11 | 13F | SILVER OAK SECURITIES, Inc | 6.374 | 0,05 | 400 | 4,44 | ||||
| 2025-07-08 | 13F | Strategic Advocates LLC | 7.779 | 489 | ||||||
| 2025-07-16 | 13F | RWM Asset Management, LLC | 5.169 | 0,00 | 325 | 3,51 | ||||
| 2025-08-14 | 13F | Mariner, LLC | 6.607 | 16,28 | 415 | 20,35 | ||||
| 2025-08-05 | 13F | Aviance Capital Partners, LLC | 3.546 | 0,00 | 223 | 3,74 | ||||
| 2025-05-12 | 13F | Sandy Spring Bank | 291 | 18 | ||||||
| 2025-07-14 | 13F | AdvisorNet Financial, Inc | 106 | 0,00 | 7 | 0,00 | ||||
| 2025-08-26 | 13F/A | Thrivent Financial For Lutherans | 0 | -100,00 | 0 | -100,00 | ||||
| 2025-05-02 | 13F | Capital A Wealth Management, LLC | 14 | 0,00 | 1 | |||||
| 2025-08-06 | 13F | Stonebridge Financial Planning Group, LLC | 5.250 | 0,00 | 330 | 3,46 | ||||
| 2025-08-12 | 13F | Ameritas Investment Partners, Inc. | 994 | 0,30 | 62 | 3,33 | ||||
| 2025-08-13 | 13F | Jones Financial Companies Lllp | 75 | 5 | ||||||
| 2025-07-30 | 13F | Strategic Blueprint, LLC | 14.494 | 910 | ||||||
| 2025-08-05 | 13F | Sigma Planning Corp | 8.279 | 8,52 | 520 | 12,34 | ||||
| 2025-07-24 | 13F | GFG Capital, LLC | 118.446 | -7,39 | 7.438 | -4,05 | ||||
| 2025-08-19 | 13F | Asset Dedication, LLC | 11 | 0,00 | 1 | |||||
| 2025-07-07 | 13F | Roxbury Financial LLC | 2.124 | 494,96 | 133 | 504,55 | ||||
| 2025-08-12 | 13F | Weaver Consulting Group | 43.877 | -0,98 | 2.755 | 2,57 | ||||
| 2025-08-13 | 13F | Lido Advisors, LLC | 115.900 | -7,90 | 7.279 | -4,59 | ||||
| 2025-08-12 | 13F | Proequities, Inc. | 0 | 0 | ||||||
| 2025-08-14 | 13F | Goldman Sachs Group Inc | 73.927 | -0,66 | 4.643 | 2,90 | ||||
| 2025-08-08 | 13F | MTM Investment Management, LLC | 919 | 58 | ||||||
| 2025-08-06 | 13F | AE Wealth Management LLC | 70.575 | -6,50 | 4.432 | -3,13 | ||||
| 2025-08-18 | 13F | Tyler-Stone Wealth Management | 33.877 | -0,83 | 2.127 | 2,75 | ||||
| 2025-08-14 | 13F | Two Sigma Investments, Lp | 0 | -100,00 | 0 | |||||
| 2025-08-14 | 13F | UBS Group AG | 2.636 | -66,30 | 166 | -65,19 | ||||
| 2025-07-14 | 13F | UMA Financial Services, Inc. | 33 | 0,00 | 2 | 0,00 | ||||
| 2025-07-24 | 13F | JB Capital LLC | 3.594 | 2,02 | 226 | 5,63 | ||||
| 2025-07-23 | 13F | Kingswood Wealth Advisors, Llc | 4.928 | -0,36 | 309 | 3,34 | ||||
| 2025-08-01 | 13F | Gwn Securities Inc. | 0 | -100,00 | 0 | |||||
| 2025-08-14 | 13F | Susquehanna International Group, Llp | 21.833 | 1.371 | ||||||
| 2025-07-17 | 13F | Sound Income Strategies, LLC | 14 | -95,85 | 1 | -100,00 | ||||
| 2025-07-30 | 13F | Cullen/frost Bankers, Inc. | 8.249 | 6,66 | 518 | 10,68 | ||||
| 2025-08-15 | 13F | Equitable Holdings, Inc. | 3.587 | 8,04 | 225 | 11,94 | ||||
| 2025-04-21 | 13F | Nelson, Van Denburg & Campbell Wealth Management Group, LLC | 0 | -100,00 | 0 | |||||
| 2025-05-08 | 13F | Eastern Bank | 0 | -100,00 | 0 | |||||
| 2025-07-14 | 13F | GAMMA Investing LLC | 192 | 0,00 | 12 | 9,09 | ||||
| 2025-08-01 | 13F | Logan Capital Management Inc | 3 | 0,00 | 0 | |||||
| 2025-07-14 | 13F | Buttonwood Financial Group, LLC | 9.157 | 2,88 | 579 | 14,00 | ||||
| 2025-08-13 | 13F | Russell Investments Group, Ltd. | 26 | 2 | ||||||
| 2025-07-25 | 13F | Sovereign Financial Group, Inc. | 5.057 | 0,38 | 318 | 3,93 | ||||
| 2025-08-12 | 13F | CIBC Private Wealth Group, LLC | 6 | 0,00 | 0 | |||||
| 2025-08-08 | 13F | Creative Planning | 8.196 | 6,06 | 515 | 9,83 | ||||
| 2025-08-13 | 13F | EverSource Wealth Advisors, LLC | 278 | 0,00 | 17 | 6,25 | ||||
| 2025-08-14 | 13F | Citadel Advisors Llc | 49.455 | 159,61 | 3.106 | 169,06 | ||||
| 2025-08-13 | 13F | Twin Peaks Wealth Advisors, LLC | 387 | 25 | ||||||
| 2025-08-19 | 13F | Advisory Services Network, LLC | 11.103 | -0,23 | 701 | 3,86 | ||||
| 2025-08-14 | 13F | Great Valley Advisor Group, Inc. | 12.986 | -9,06 | 816 | -5,78 | ||||
| 2025-08-11 | 13F | Principal Securities, Inc. | 130 | -37,50 | 8 | -33,33 | ||||
| 2025-08-13 | 13F | Cerity Partners LLC | 3.510 | -15,28 | 220 | -12,35 | ||||
| 2025-05-02 | 13F | Apollon Wealth Management, LLC | 0 | -100,00 | 0 | |||||
| 2025-07-25 | 13F | Envestnet Portfolio Solutions, Inc. | 15.777 | 14,84 | 991 | 18,99 | ||||
| 2025-08-13 | 13F | Luminist Capital LLC | 13 | 0,00 | 1 | |||||
| 2025-08-14 | 13F | Wells Fargo & Company/mn | 2.387 | 109,02 | 150 | 115,94 | ||||
| 2025-08-05 | 13F | Snider Financial Group | 8.542 | -12,46 | 536 | -9,31 | ||||
| 2025-05-08 | 13F | Regions Financial Corp | 0 | -100,00 | 0 | |||||
| 2025-07-25 | 13F | Concord Wealth Partners | 193 | 12 | ||||||
| 2025-08-12 | 13F | LPL Financial LLC | 177.522 | -9,96 | 11.148 | -6,72 | ||||
| 2025-07-09 | 13F | Pallas Capital Advisors LLC | 14.128 | 2,97 | 887 | 6,74 | ||||
| 2025-08-11 | 13F | Citigroup Inc | 772 | 48 | ||||||
| 2025-08-06 | 13F | Commonwealth Equity Services, Llc | 747.249 | -1,12 | 47 | 2,22 | ||||
| 2025-07-24 | 13F | IFP Advisors, Inc | 3.511 | 14,44 | 220 | 18,92 | ||||
| 2025-07-15 | 13F | Unified Investment Management | 6.150 | 0,00 | 386 | 3,76 | ||||
| 2025-08-14 | 13F | Raymond James Financial Inc | 104.585 | 1,84 | 6.568 | 5,49 | ||||
| 2025-08-05 | 13F | Key FInancial Inc | 2.427 | 0,00 | 152 | 3,40 | ||||
| 2025-08-08 | 13F | Security Financial Services, INC. | 11.004 | 691 |